VacSIM: LEARNING EFFECTIVE STRATEGIES FOR COVID-19 VACCINE DISTRIBUTION USING REINFORCEMENT LEARNING
←
→
Page content transcription
If your browser does not render page correctly, please read the page content below
VacSIM: L EARNING E FFECTIVE S TRATEGIES FOR COVID-19
                                             VACCINE D ISTRIBUTION USING R EINFORCEMENT L EARNING

                                                                                              A P REPRINT

                                             Raghav Awasthi,1 , Keerat Kaur Guliani2 , Arshita Bhatt3 , Mehrab Singh Gill1 , Aditya Nagori4 , Ponnurangam
                                                                                Kumaraguru1 , and Tavpritesh Sethi1
arXiv:2009.06602v1 [cs.AI] 14 Sep 2020

                                                                        1
                                                                         Indraprastha Institute of Information Technology Delhi
                                                                                2
                                                                                  Indian Institute of Technology Roorkee
                                                                       3
                                                                         Bhagwan Parshuram Institute of Technology, New Delhi
                                                                    4
                                                                      CSIR-Institute of genomics and integrative biology, New Delhi

                                                                                           September 15, 2020

                                         1   Abstract
                                         A COVID-19 vaccine is our best bet for mitigating the ongoing onslaught of the pandemic. However, vaccine is
                                         also expected to be a limited resource. An optimal allocation strategy, especially in countries with access inequities
                                         and a temporal separation of hot-spots might be an effective way of halting the disease spread. We approach this
                                         problem by proposing a novel pipeline VacSIM that dovetails Actor-Critic using Kronecker-Factored Trust Region
                                         (ACKTR) model into a Contextual Bandits approach for optimizing the distribution of COVID-19 vaccine. Whereas
                                         the ACKTR model suggests better actions and rewards, Contextual Bandits allow online modifications that may need to
                                         be implemented on a day-to-day basis in the real world scenario. We evaluate this framework against a naive allocation
                                         approach of distributing vaccine proportional to the incidence of COVID-19 cases in five different States across India
                                         and demonstrate up to 100,000 additional lives potentially saved and a five-fold increase in the efficacy of limiting the
                                         spread over a period of 30 days through the VacSIM approach. We also propose novel evaluation strategies including
                                         a standard compartmental model based projections and a causality preserving evaluation of our model. Finally, we
                                         contribute a new Open-AI environment meant for the vaccine distribution scenario, and open-source VacSIM for wide
                                         testing and applications across the globe.
                                         Content Areas: COVID-19, Vaccine Distribution, Policy Modeling, Reinforcement Learning, Contextual Bandits
                                         Problem
                                         2   Introduction
                                         All countries across the globe are eagerly waiting for the launch of an effective vaccine against SARS-CoV-2. The
                                         Operation Warp Speed[1] aims to deliver 300 million doses of a safe, effective vaccine for COVID-19 by January 2021,
                                         however, the pace of development continues to be punctuated by the safety concerns [2]. As potential candidates start
                                         getting ready to enter the market, there will be an urgent need for optimal distribution strategies that would mitigate
                                         the pandemic at the fastest rate possible [3] [4]. Center for American Progress estimated that 462 million doses of
                                         COVID-19 vaccine along with accompanying syringes will be needed for the US alone to reach herd immunity [5].
                                         Here we summarize the key factors that will need to be considered for effective mitigation:

                                               • Scarcity of supply: Despite large scale production efforts, it is expected that the vaccine will still be a scarce
                                                 resource as compared to the number of people who would need it. In addition to the vaccine itself, there may
                                                 also be scarcity in the components leading to its delivery, e.g syringes. The White House director of trade
                                                 and manufacturing policy stated earlier this year that the US would need 850 million syringes to deliver the
                                                 vaccine en-masse. This highlights the next challenge of the optimal distribution of scarce resources related to
                                                 the vaccine.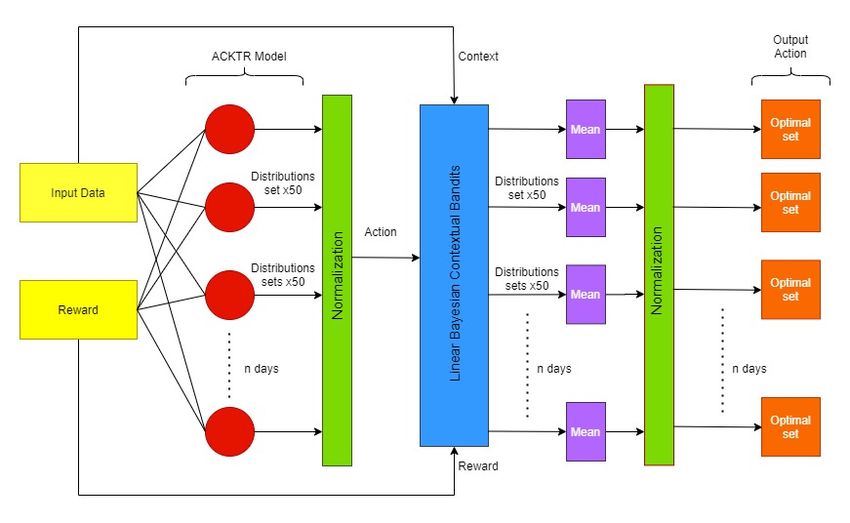
A PREPRINT - S EPTEMBER 15, 2020

       • Equitable distribution: A truly equitable distribution will not just be defined by the population or incidence
         of new cases alone, although these will be strong factors. Other factors ensuring equity of distribution include
         quantum of exposure e.g. to the healthcare workforce that needs to be protected. In this paper, we assume that
         the exposure is proportional to the number of cases itself, although the proposed methodology allows more
         nuanced models to be constructed. There may also be unseen factors such as vaccine hoarding and political
         influence, which are not accounted for in this work.
       • Transparent, measurable and effective policy: The design of policy would need to be guided by data,
         before, during and after the vaccine administration to a section of the population. Since the viral dynamics
         are rapidly evolving, the policy should allow changes to be transparent and effects to be measurable in order
         to ensure maximum efficacy of the scarce vaccine resource. On the larger scale of states and nations, this
         would imply continuous monitoring of incidence rates vis-a-vis a policy action undertaken.

Although the aforementioned factors seem straightforward, the resulting dynamics that may emerge during the actual
roll-out of the vaccine may be far too complex for human decision making. The daunting nature of such decision-
making can be easily imagined for large and diverse countries such as India and the United States, especially where
Health is a State subject. Artificial intelligence for learning data-driven policies is expected to aid such decision
making as there would be limited means to identify optimal actions in real-world. A ”near real-time” evaluation as per
the demographic layout of states and consequent initiation of a rapid response to contain the spread of COVID-19 [6]
will be required. Furthermore, these policies will need to be contextualized to the many variables governing demand
or ‘need’ for the vaccine distribution to be fair and equitable[7]. Therefore, ground testing of these scenarios is not an
option, and countries will have to face this challenge. In this paper, we introduce VacSIM, a novel feed-forward
reinforcement learning approach for learning effective policy combined with near real-time optimization of
vaccine distribution and demonstrate its potential benefit if applied to five States across India. Since real-world
experimentation was out of question, the change in projected cases obtained via a standard epidemiological model was
used to compare the VacSIM policy with a naive approach of incidence-based allocation. Finally, our novel model is
open-sourced and can be easily deployed by policymakers and researchers, thus can be used in any part of the world,
by anyone, to make the process of distribution more transparent.

3     Background
3.1   Actor Critic in Reinforcement Learning

Actor-Critic Methods are temporal difference (TD) learning-based methods that have a policy structure(Actor) which
select actions, and an estimated value function(Critic) that critiques the actions made by the actor. A Markov decision
process is represented as a function of (X, A, γ, P, r), at a given time t. An agent performs an action ∈ A following
a certain policy πθ (a|X) to receive a reward r(X, A) and a transition to the consequent state X 0 with a probability
P (X 0 |X, A). The objective of this task is to maximize the expected γ-discounted cumulative return
                                                            X∞
                                      J(θ) = Eπ [Rt ] = Eπ [   γ i r(Xt+i , At+i )]                                      (1)
                                                                      i≥0

(given the policy parameters θ). Policy Gradient methods optimises a policy πθ (a|X) with respect to its parameters
and update θ, to maximise J(θ)[8], [9]. As defined in [10], policy gradient is expressed as follows:
                                                           ∞
                                                           X
                                        ∇θ J(θ) = Eπ [            ψ t ∇θ logπθ (At |Xt )]                                (2)
                                                            t=0

where ψ t is representative of the advantage function Ap i(X, A). An advantage function provides a relativistic idea
of how useful a certain action is, given a certain state. A good advantage function provides low variance and low
bias gradient estimates. In our work, we refer to [11], which uses the A3C (asynchronous advantage critic) method
proposed by [12] and suggests the following advantage function:
                                            k−1
                                            X
                          Aπ (Xt , At ) =         (γ i r(Xt+i , At+i ) + γ k Vφπ (Xt+k )) − Vφπ (Xt )                    (3)
                                            i=0

where Vφπ (Xt ) represents the value network, whose parameters are further trained by performing temporal difference
updates. The variable k corresponds to the k-step return from the advantage function.

                                                                  2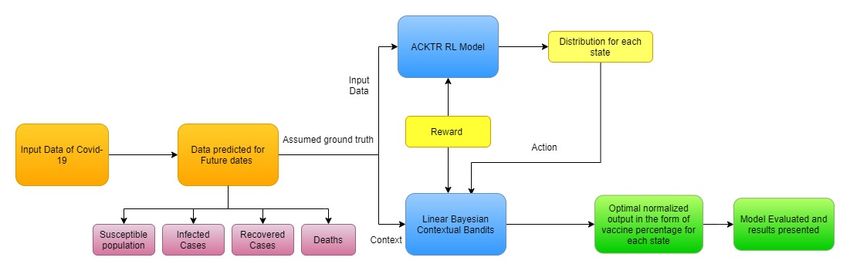
A PREPRINT - S EPTEMBER 15, 2020

3.2   Trust Region Policy Optimisation(TRPO)

TRPO[13] is an on-policy algorithm that is well suited for environments with both discrete and continuous action
spaces. Considering we make use of the latter, this optimization scheme can be employed in our model. Updating
policy using TRPO involves taking the largest possible step to improve model performance, whilst also satisfying a
constraint setting the proximity between the old and the new policies. The constraint is expressed as KL-Divergence.
If πθ is a policy (θ being the parameters), then the TRPO update is performed as follows:
                                     θk+1 = argmaxL(θk , θ)s.t.DKL (θ||θk ) ≤ δ                                  (4)
where L(θk , θ) is a surrogate advantage function comparing how the current policy performs with respect to the old
policy, and DKL (θ||θk ) is the average KL-Divergence metric.

3.3   Kronecker-factored Fisher approximation

Natural Gradient Descent (NGD)[14] is an efficient realization of second-order optimization and is based on Infor-
mation Geometry. In contrast to first-order methods such as Stochastic Gradient Descent, NGD converges faster by
approximating the loss landscape using the Fisher Information Matrix (FIM)[15] as the curvature matrix correspond-
ing to the loss function. Kronecker-factored Approximate Curvature [16] provides an efficient way to approximate the
inverse of FIM, which is otherwise a computational challenge associated with this approach.

3.4   Actor-Critic using Kronecker-Factored Trust Region (ACKTR)

ACKTR is a scalable and sample efficient algorithm to apply the natural gradient method to policy gradient for actor-
critic methods. Proposed in [11], it is used to calculate and apply the natural gradient update to both actor and critic.
It uses a critic to estimate the advantage function. Training the model amounts to solving the least-squares problem
of minimizing the mean squared error (MSE) between the model predictions and the target values, i.e., (r(x) =
estimated(x) − target(x)).

3.5   Contextual Bandits problem

The Contextual Bandits algorithm is an extension of the multi-armed bandits approach [17] which contextualizes the
choice of the bandit to its current environment. This serves to circumvent the problem where a multi-armed bandit
may simply end up playing the same action multiple times even though the environment (context) may have changed,
thus getting stuck at a sub-optimal condition. Contextual Bandits play an action based on its current context, given a
corresponding reward, hence are more relevant to real-world environments such as the vaccine distribution problem
attacked in this work. Given, for time t = 1...n, a set of contexts C and a set of possible actions X and reward/payoffs
P are defined. At a particular instant, based on a context ct ∈ C, an action xt ∈ X is chosen and a reward or a payoff
pt = f (ct , xt ) is obtained. Regret[18] is a conceptual function to understand and optimize the performance of the
Bandits problem. Since we don’t know if an action played was the most “reward-fetching”, rewards against all actions
that can be played are sampled, and the difference between the action chosen and the action against the maximum
reward is defined as ‘regret’. Therefore, minimizing regret achieves the goal of maximizing reward. For an optimal
action x∗ ∈ X such that the expectation of reward against this action is maximum,         ∗
                                                                                     Pnp = maxxt ∈X (E(p | xt )), the
regret and cumulative regret can be expressed as Z = [p∗ − E(p | xt )] and Z ∗ = t=1 Z respectively.

3.6   Linear Bayesian method for solving the Contextual Bandits problem

In order to derive the exact posterior inference in linear models, a Bayesian linear regression [19] may be performed,
and several computationally-efficient versions are available [20]. Linear posteriors assume that the data were generated
as per
                                                      P = CT β +                                                      (5)
where  ∼ N (0, σ ), P represents the reward or payoff and C is the context. The joint distribution of β and σ 2 for
                    2

each action is modeled. Sequentially estimating the noise level σ 2 for each action allows the algorithm to adaptively
improve its understanding of the volume of the hyper-ellipsoid of plausible β’s which generally leads to a more
aggressive initial exploration phase (for both β and σ 2 ). The posterior at time t for action xt after observing C and P,
is
                                             πt (β, σ 2 ) = πt (β | σ 2 )πt (σ 2 )                                     (6)
where we assume σ ∼ IG(at , bt ), and β | σ 2 ∼ N (µt , σ 2 Σt ), an Inverse Gamma and Gaussian distribution,
                      2

respectively. Their parameters are given by
                                    Σt = (C T C + λ0 )−1 , µt = Σt (Λ0 µ0 + C T P )                                   (7)

                                                            3
A PREPRINT - S EPTEMBER 15, 2020
1
at = a0 + t/2, bt = b0 + (P T P + µT0 Σ0 µ0 − µTt Σ−1
t µt ) (8)
2
We set the prior hyperparameters to µ0 = 0, and Λ0 = λ Id, while a0 = b0 = η > 1. It follows that initially, for
σ02 ∼ IG(η, η), we have the prior β | σ02 ∼ N (0, σ02 /λId), where E[σ02 ] = η/(η − 1). Note that we independently
model and regress each action’s parameters, βi , σi2 for i = 1, . . . , k [18]. For practical purposes, a0 and b0 are
initialized as integer values.
3.7 VacSIM: A Feed forward Approach
In this paper, we concatenate the ACKTR sub-model and Contextual Bandits sub-model in a feedforward manner. This
was done to select the optimal policy through the supervised Contextual Bandits approach from the ones generated
by the reinforcement learning-based ACKTR model as shown in Figure 1. This was done to address the following
challenges that need to be tackled in real-world problems such as optimal vaccine distribution:
• Solving in real-time: A vaccine distribution problem is expected to be fast-paced. Thus an overwhelming
amount of brainstorming with constrained resources and time would be required to develop effective policy
for a near future. This calls for the development of a prompt and an easily reproducible setup.
• Lack of ground truth: This is one of the key challenges addressed in this paper. Since roll out of the vaccine
will not give us the liberty of testing various hypotheses, a lack of ground truth data is generally expected. This
is analogous to zero-shot learning problems thus precluding a simple supervised learning based approach.
• Absence of evaluation with certainty: Lack of ground testing naturally implies nil on-ground evaluation.
In that case, it often becomes challenging to employ evaluation metrics that offer a significant amount of
confidence in results. In order to solve this problem, we rely upon the simulated decrease in number of
susceptible people as vaccine is administered.
• Model scaling: We ensured that the learning process of the models simulates the relationship between dif-
ferent objects in the real world environment accurately, and at the same time can be scaled down in response
to computational efficiency and resource utilization challenges. This is done by choosing the right set of
assumptions that reflect the real world.
Figure 1. VacSIM architecture: A novel feed forwarded pipeline for policy learning of COVID-19 vaccine
distribution. To make decisions online through Contextual Bandit Problem, reward and action obtained from the
ACKTR model were fed forward into the training of Contextual Bandit learning. Optimal online decisions can be
calculated by trained Contextual Bandit problems.
While reinforcement learning approaches replicate human decision-making processes, the absence of evaluation makes
them less trustworthy, especially when real lives may be at stake. Therefore, we pipelined the ACKTR model with a
4A PREPRINT - S EPTEMBER 15, 2020
supervised learning based Contextual Bandits approach where recommendations for vaccine distribution policy were
used as training data for the latter.
4 Model Setup
We extracted the State-wise time series data of COVID-19 characteristics from the website https://mohfw.gov.in/ and
use them in the experiments as described below.
Figure 2. Flow diagram for optimization of vaccine distribution policy in India using the VacSIM approach.
The five States chosen for this study, i.e., Assam, Delhi, Jharkhand, Maharashtra and Nagaland are representative
of possible scenarios for the vaccine distribution problem, i.e., high incidence(Maharashtra and Delhi), moderate
incidence (Assam) and low incidence (Jharkhand and Nagaland) as on August 15, 2020. This particular date was
chosen following the announcement that India may launch its indigenous vaccine on this date. In choosing the five
different States, we hope to generalize our predictions to other States across the spectrum while minimizing the bias
introduced into the learning by a widely variant COVID-19 incidence across the country.
We also enhanced our modeling context with:
Population share: The percentage ratio of the population of the state to the population of all the five states.
Predicted Death Rate: The percentage ratio of the predicted deaths in the State to the total predicted cases in that
State calculated using projections obtained from a fitted standard Compartmental model, i.e. a Susceptible, Exposed,
Infected and Recovered(SEIR) model.
Predicted Recovery Rate: The percentage ratio of the predicted recoveries in the State to the total predicted cases in
that State using projections obtained from the SEIR model.
The implementation of ACKTR and contextual bandit sub-models of VacSIM are detailed henceforth:
ACKTR Model: Open-AI[21] stable-baselines framework was used to construct a novel and relevant environment
suited to our problem statement for ACKTR to learn in this environment.
a. Input: With both the observation space and action space being declared as Box-type, a context vector describing the
situation of the state in terms of Total Predicted Cases, Predicted Death Rate, Predicted Recovery Rate, Susceptible
cases and Population, at a given time, was fed as input. Predictions were obtained from SEIR projections[22].
The action space was a one-dimensional vector with its size equal to the number of recipients of the vaccine in
one round of distribution. Notably, we accounted for the cumulative time it would take for vaccine distribution,
administration and generation of the immune response by the body i.e. the total time between dispatch of vaccine
from the distribution centre to achievement of immunity in the vaccinated individual. This introduces a lag of 15 days
between the distribution date of vaccines at day ‘t’, to the gathering of context at day ‘t+15’ by VacSIM using SEIR
projections.
b. Model working: Following are the assumptions used while building the environment:
5A PREPRINT - S EPTEMBER 15, 2020
S.No. Hyperparameter Name Hyperparameter Value
1 Batch Size: number of vials in one round of distribution. 10000
2 Exploration Rate 40%
3 Vaccine efficacy 100%
4 Number of recipients per day 5
Table 1: Hyper-parameters used during Policy learning
• The nature of the vaccine is purely preventative and NOT curative, i.e., it introduces immunity when admin-
istered to a susceptible person against future COVID infection, but plays no role in fighting against existing
infections (if any).
• The vaccine has 100% efficacy i.e. all people who are vaccinated will necessarily develop immunity against
future SARS-CoV-2 infection. This assumption is easily modifiable and is expected to have little consequence
in deciding the optimal allocation, unless data reveal differential immunity response of certain populations
within India. However, we leave scope for it to be modified as per the situation by taking this as a hyper-
parameter for VacSIM.
• Each person requires only 1 dose (vial) of the vaccine to be vaccinated completely and successfully. This
too may be treated as a hyperparameter.
Reward Function: The reward function was designed to maximize the decrease in the susceptible population count
with the minimum amount of vaccine, considering it to be a limited resource.
Ri = Si ∗ exp(−qi ) (9)
Where
Ri was the reward given to vaccine recipient i
Si was the susceptible population count of the same state 15 days from the day of distribution.
qi was the amount of vaccine given to the state by the model.
Flow: VacSIM gives us a recommendation for the distribution ratio between various recipients (Indian States) of the
vaccine as its output. Following this distribution set, it awards the corresponding number of vials to each State and
converts a corresponding number of individuals in that the State from Susceptible to Recovered, thus short-circuiting
the SEIR model.
The Explore-Exploit Tradeoff: We tap into the explore-vs-exploit dilemma, allowing the model to reassess its
approach with ample opportunities and accordingly, redirect the learning process. We set the exploration rate at 40%.
However, this too is flexible and can be treated as a hyperparameter.
Hyperparameters: A complete list of the hyperparameters is given in Table 1.
c. Output: The output of the first sub-model was a distribution set dictating the share of each recipient in the batch of
vaccines dispatched at the time of delivery.
Contextual Bandits Model): The output of the first sub-model spanned over 15 days (1 September-15 September
2020) with each state having a total of 50 episodes being run for each day. For every episode, the distribution sets
so obtained (one per episode) were normalised to get the percentage distribution ratio for all states. Normalised here
refers to the percentage ratio of a given distribution set of a state and the sum of the distribution sets of the 5 states
over an entire episode for a given date. Since the time period is fifteen days, this amounts to a total of 3750 episodes.
a. Training: These episodes, which comprised of the normalised distribution sets along with the corresponding set of
rewards, were then fed to the second sub-model, i.e., Contextual Bandits as training data set.
b. Number of actions and features: The action space in this model was assumed to lie in the range [0,100] (both
inclusive) to represent the percentage of vaccine that went to each state during the distribution process. The features
6A PREPRINT - S EPTEMBER 15, 2020
in the context were the same as in sub-model 1, except population, which was now replaced by population share
(fraction of population of a state with respect to the total recipient population). This was done merely for scaling
purposes.
c. Testing: Using the context, normalised actions and the corresponding set of rewards as the training dataset, we
tested the model day-wise for a period of fifteen days (16 September-30 September) with each day having fifty
possible actions for each State as output, similar to what was done in ACKTR model.
d. Output: The unadjusted actions (which were not normalised) obtained after testing the model were first adjusted
day-wise for each State by taking the mean of all possible fifty actions for the State on that particular day. These were
then normalized to obtain the percentage vaccine distribution for the five States for the period under consideration (15
days).
We considered fifteen days i.e. from 16 September to 30 September 2020 to check whether our model was temporally
consistent or not. The consequent distribution of vaccine among the five States for each distribution day were
then evaluated. The maximum and minimum percent vaccine distributions for the states were as follows: Assam
- 20.33020395 (max) and 18.83016932 (min), Delhi - 22.0996237 (max) and 19.80338895 (min), Jharkhand -
20.47530782 (max) and 18.69553908 (min), Maharashtra - 21.7416602 (max) and 19.26386866 (min) and Nagaland
- 21.54122323 (max) and 19.01590586 (min). Results indicate that out of the five states, Maharashtra, which had the
highest number of cases, saw a gradually decreasing trend whereas Nagaland, which has the lowest number of cases,
sees a gradually increasing trend with respect to the distribution of the vaccine Figure 3(Right).
Figure 3:(Left) Bar plot of state-wise(India) total number of confirmed cases on 15 August. (Right) State-wise
distribution of vaccine from 16 September to 30 September along with the Confidence Intervals using our model
driven policy.
We also calculated that if the vaccine were to be distributed on 16 September, Assam, Delhi, Jharkhand, Maharash-
tra and Nagaland should get 18.93% (95% CI [15.96,21.90]), 20.13% (95% CI [16.13,24.13]), 19.32% (95% CI
[16.39,22.25]), 21.74% (95% CI [17.72,25.75]) and 19.86% (95% CI [16.05,23.66]) of the vaccine respectively for
the most effective mitigation of the epidemic among these five States.
4.1 Model Evaluation through Projection Scenario
Since there is no way that the evaluation of distribution policy can be done in the absence of vaccine and real-world
distribution, we defined the Naive baseline distribution policy as % of vaccine given to a state = % of Infected People
in that state and compared it with our model’s learned distribution. With 100000 doses and 5 States, we simulated
the distribution of the available vaccine on 16 September for the Naive and VacSIM policies. The number of resulting
(projected) infections for 30 days after the vaccine distribution were calculated using the SEIR Model. Day-wise total
cases of all 5 states for both policy models were summarized. Our results indicate that the VacSIMbased policy would
additionally reduces a total of 102385 infected cases, with 95% CI [10234,102427], in the next 30 days.
7A PREPRINT - S EPTEMBER 15, 2020
Figure 4:(Left) Grouped bar plot of state-wise vaccine distribution from 15 September to 30 September using Naive
Approach. (Right) Difference of total COVID-19 projected cases in next 30 days after vaccine distribution by Naive
Approach and through Model driven way.
As seen from Figure 3(Right) and Figure 4(Left), in the case where distribution was done using Naive approach,
vaccine distribution for all the fifteen days was nearly the same with Maharashtra, receiving the highest amount of
vaccine and Nagaland, receiving the least amount of vaccine as expected as per their infection rates. On the other hand,
in case of the results obtained through VacSIM, each State would get a variable and sufficient amount of vaccine during
the fifteen-day period including Nagaland, which received a negligible amount under the Naive approach. Unlike the
Naive approach, VacSIM, therefore was not biased towards any State, thus ensuring equitable distribution while
mitigating the epidemic.
4.2 Model evaluation through learning the causal structure of simulated data obtained
The ultimate goal of vaccine distribution is to reduce mortality and morbidity. Since our model relies entirely upon
simulations, in the absence of a vaccine, we checked if the data generated by such an approach follow the cause-and-
effect relationships as expected in the real world data. Structure-learning was carried out using a data-driven Bayesian
network[23] approach using Hill Climbing algorithm[24] with Akaike Information Criterion as a scoring function, and
ensemble averaging over 101 bootstrapped networks. These models were learned using wiseR package[25].
Figure 5: Ensemble averaged causal structure of the Bayesian network obtained from 101 bootstraps, using Hill
Climbing optimizer for AIC as a scoring function. Vaccine Percentage obtained from model was observed as a
parent node of Susceptible cases thus indicating the causality preserving nature of VacSIM simulations.
8A PREPRINT - S EPTEMBER 15, 2020
State-wise time series data of death, recovery, infected people, susceptible people and the amount of vaccine obtained
from our model were used to learn the structure. Blacklisting among nodes was done such that vaccine percentage
cannot be the child node of COVID-19 trajectory indicators (Susceptible, Recovery, Infected People, Death). The
resulting structure shows a causal relationship between the vaccine amount(parent node) and susceptible count (child
node), thus confirming the technical correctness of the VacSIM model through an external evaluation approach (refer
Figure 5).
5 Conclusion
Researchers worldwide are working around the clock to find a vaccine against SARS-CoV-2, the virus responsible for
the COVID-19 pandemic. Once available, distribution of the vaccine will have numerous logistical challenges (supply
chain, legal agreements, quality control, application to name a few) which might slow down the distribution process.
In this paper, we have developed a novel distribution policy model, VacSIM using Reinforcement Learning. We have
pipelined an Actor-Critic using Kronecker-Factored Trust Region (ACKTR) model and Bayesian Regression-based
Contextual Bandit model in a feed-forward way such that the output (Action and Rewards) of ACKTR model are fed
into the Contextual Bandit model in order to provide a sensible context comprising actions and rewards. Contextual
Bandits then optimized the policy considering demographic metrics such as population share of state with respect to
the chosen 5 states and time series-based characteristics of the COVID-19 spread (susceptible population, recovery
rate, death rate, total infected cases) as context. While distributing the vaccine, identifying the part of the population
who needs it the most is a challenging task, and in our case, we addressed it by the usage of the aforementioned Con-
text. Rather than using the present-day count of infected and susceptible people, we have used SEIR-based projections,
which makes our predicted policy more robust and trustworthy. Evaluation of model-driven policy is a tough assign-
ment due to unavailability of ground truth, and we proposed a novel causality-preserving approach to evaluate such
models. The open-source code will enable testing of our claims by other researchers. VacSIM may have some limita-
tions shared by all RL models, i.e. the transparency of their learning process and the explainability of their decisions.
Secondly, the development of VacSIM has been carried out while observing the pandemic in the past few months.
However, the dynamic nature of pandemic may require change in actions, thus calling for common-sense working
alongside artificial intelligence. In conclusion, we believe that artificial intelligence has a role to play in optimal dis-
tribution of the scarce resources such as vaccines, syringes, drugs, personal protective equipment (PPEs) etc. that the
world will see in the coming months. We provide a novel, open source, and extensible solution to this problem that
policymakers and researchers may refer to while making decisions.
References
[1] N. Division, “Fact Sheet: Explaining Operation Warp Speed,” Jun. 2020, last Modified: 2020-08-12T16:32-04:00.
[Online]. Available: https://www.hhs.gov/about/news/2020/06/16/fact-sheet-explaining-operation-warp-speed.
html
[2] “AstraZeneca Covid-19 vaccine study is put on hold,”
Sep. 2020. [Online]. Available: https://www.statnews.com/2020/09/08/
astrazeneca-covid-19-vaccine-study-put-on-hold-due-to-suspected-adverse-reaction-in-participant-in-the-u-k/
[3] D. B. White and D. C. Angus, “A Proposed Lottery System to Allocate Scarce COVID-19 Medications:
Promoting Fairness and Generating Knowledge,” JAMA, vol. 324, no. 4, pp. 329–330, Jul. 2020, publisher:
American Medical Association. [Online]. Available: https://jamanetwork.com/journals/jama/fullarticle/2767751
[4] R. Khamsi, “If a coronavirus vaccine arrives, can the world make enough?” Nature, vol. 580, no.
7805, pp. 578–580, Apr. 2020, number: 7805 Publisher: Nature Publishing Group. [Online]. Available:
https://www.nature.com/articles/d41586-020-01063-8
[5] T. Spiro and Z. Emanuel, “A Comprehensive COVID-19 Vaccine Plan.” [Online]. Available: https://www.
americanprogress.org/issues/healthcare/reports/2020/07/28/488196/comprehensive-covid-19-vaccine-plan/
[6] D. Foster, C. Mcgregor, and S. El-masri, “A Survey of Agent-Based Intelligent Decision Support Systems to
Support Clinical,” in Management and Research”, 1st Intl. Workshop on Multi-Agent Systems for Medicine,
Computational Biology, and Bioinformatics.
[7] S. Deo, S. Manurkar, S. Krishnan, and C. Franz, “COVID-19 Vaccine: Development, Access and Distribution in
the Indian Context,” no. 378, p. 16, 2020.
[8] R. S. Sutton, D. A. McAllester, S. P. Singh, and Y. Mansour, “Policy Gradient Methods for Reinforcement
Learning with Function Approximation,” in Advances in Neural Information Processing Systems 12, S. A. Solla,
9A PREPRINT - S EPTEMBER 15, 2020
T. K. Leen, and K. Müller, Eds. MIT Press, 2000, pp. 1057–1063. [Online]. Available: http://papers.nips.cc/
paper/1713-policy-gradient-methods-for-reinforcement-learning-with-function-approximation.pdf
[9] R. J. Williams, “Simple statistical gradient-following algorithms for connectionist reinforcement learning,”
Machine Learning, vol. 8, no. 3, pp. 229–256, May 1992. [Online]. Available: https://doi.org/10.1007/
BF00992696
[10] J. Schulman, P. Moritz, S. Levine, M. Jordan, and P. Abbeel, “High-Dimensional Continuous Control Using
Generalized Advantage Estimation,” arXiv:1506.02438 [cs], Oct. 2018, arXiv: 1506.02438. [Online]. Available:
http://arxiv.org/abs/1506.02438
[11] Y. Wu, E. Mansimov, S. Liao, R. Grosse, and J. Ba, “Scalable trust-region method for deep reinforcement
learning using Kronecker-factored approximation,” arXiv:1708.05144 [cs], Aug. 2017, arXiv: 1708.05144.
[Online]. Available: http://arxiv.org/abs/1708.05144
[12] V. Mnih, A. P. Badia, M. Mirza, A. Graves, T. P. Lillicrap, T. Harley, D. Silver, and K. Kavukcuoglu,
“Asynchronous Methods for Deep Reinforcement Learning,” arXiv:1602.01783 [cs], Jun. 2016, arXiv:
1602.01783. [Online]. Available: http://arxiv.org/abs/1602.01783
[13] J. Schulman, S. Levine, P. Moritz, M. I. Jordan, and P. Abbeel, “Trust Region Policy Optimization,”
arXiv:1502.05477 [cs], Apr. 2017, arXiv: 1502.05477. [Online]. Available: http://arxiv.org/abs/1502.05477
[14] J. Martens, “New insights and perspectives on the natural gradient method,” arXiv:1412.1193 [cs, stat], Jun.
2020, arXiv: 1412.1193. [Online]. Available: http://arxiv.org/abs/1412.1193
[15] A. Ly, M. Marsman, J. Verhagen, R. Grasman, and E.-J. Wagenmakers, “A Tutorial on Fisher
Information,” arXiv:1705.01064 [math, stat], Oct. 2017, arXiv: 1705.01064. [Online]. Available: http:
//arxiv.org/abs/1705.01064
[16] J. Martens and R. Grosse, “Optimizing Neural Networks with Kronecker-factored Approximate Curvature,”
arXiv:1503.05671 [cs, stat], Jun. 2020, arXiv: 1503.05671. [Online]. Available: http://arxiv.org/abs/1503.05671
[17] M. Collier and H. U. Llorens, “Deep Contextual Multi-armed Bandits,” arXiv:1807.09809 [cs, stat], Jul. 2018,
arXiv: 1807.09809. [Online]. Available: http://arxiv.org/abs/1807.09809
[18] C. Riquelme, G. Tucker, and J. Snoek, “Deep Bayesian Bandits Showdown: An Empirical Comparison of
Bayesian Deep Networks for Thompson Sampling,” arXiv:1802.09127 [cs, stat], Feb. 2018, arXiv: 1802.09127.
[Online]. Available: http://arxiv.org/abs/1802.09127
[19] S. Agrawal and N. Goyal, “Thompson Sampling for Contextual Bandits with Linear Payoffs,” arXiv:1209.3352
[cs, stat], Feb. 2014, arXiv: 1209.3352. [Online]. Available: http://arxiv.org/abs/1209.3352
[20] C. M. Bishop, Pattern recognition and machine learning, ser. Information science and statistics. New York:
Springer, 2006.
[21] OpenAI, “Gym: A toolkit for developing and comparing reinforcement learning algorithms.” [Online].
Available: https://gym.openai.com
[22] M. Y. Li and J. S. Muldowney, “Global stability for the SEIR model in epidemiology,” Mathematical
Biosciences, vol. 125, no. 2, pp. 155–164, Feb. 1995. [Online]. Available: http://www.sciencedirect.com/science/
article/pii/0025556495927565
[23] D. Heckerman, “A Tutorial on Learning With Bayesian Networks,” arXiv:2002.00269 [cs, stat], Feb. 2020,
arXiv: 2002.00269. [Online]. Available: http://arxiv.org/abs/2002.00269
[24] J. A. Gámez, J. L. Mateo, and J. M. Puerta, “Learning Bayesian networks by hill climbing: efficient methods
based on progressive restriction of the neighborhood,” Data Mining and Knowledge Discovery, vol. 22, no. 1,
pp. 106–148, Jan. 2011. [Online]. Available: https://doi.org/10.1007/s10618-010-0178-6
[25] T. Sethi and S. Maheshwari, “wiseR: A Shiny Application for End-to-End Bayesian Decision Network Analysis
and Web-Deployment,” Nov. 2018. [Online]. Available: https://CRAN.R-project.org/package=wiseR
10You can also read