UNDERSTANDING THE DYNAMICS OF SARS-COV-2 VARIANTS OF CONCERN IN ONTARIO, CANADA: A CASE STUDY
←
→
Page content transcription
If your browser does not render page correctly, please read the page content below
Understanding the Dynamics of SARS-CoV-2 Variants of
Concern in Ontario, Canada: A Case Study
Anita Layton ( anita.layton@uwaterloo.ca )
University of Waterloo
Mehrshad Sadria
University of Waterloo
Research Article
Keywords: VOC, NPI, spread of Delta, Alarmingly, health care system, vaccine
Posted Date: August 12th, 2021
DOI: https://doi.org/10.21203/rs.3.rs-788073/v1
License: This work is licensed under a Creative Commons Attribution 4.0 International License. Read Full License
Page 1/22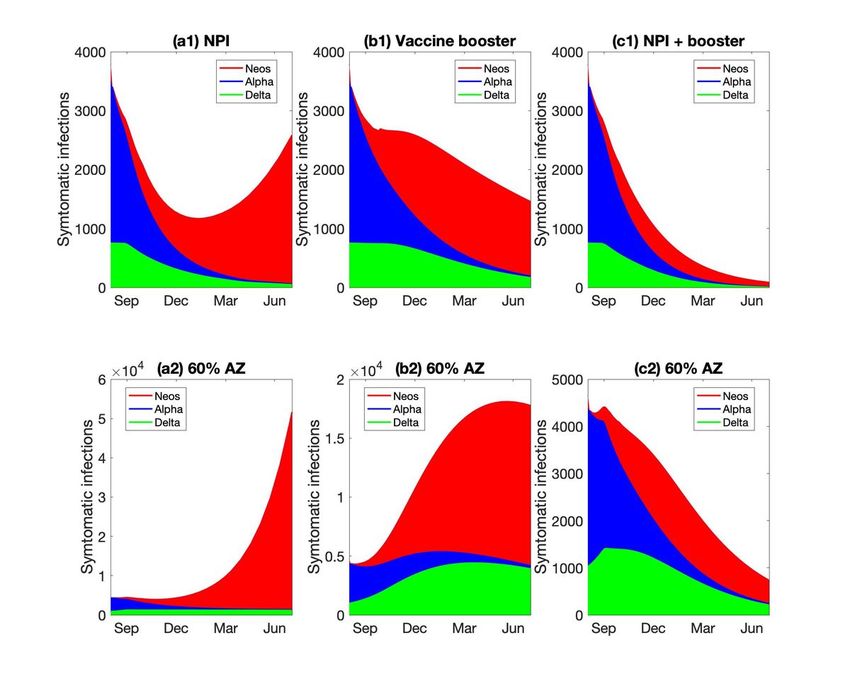
Abstract
A year after the initial wild-type Severe Acute Respiratory Syndrome Coronavirus 2 (SARS-CoV-2) strains began their
devastation of the world, they were supplanted by new variants of concern (VOC). In Ontario, Canada, the wild type was
overtaken first by the Alpha/B1.1.17 variant, and then by the Delta/B.1.617 variant. The principal objective of the present
study is to develop and apply a much expanded Susceptible-Infection-Recovered-type model to better understand the
spread of multiple VOC, and assess the effectiveness of vaccination and non-pharmaceutical interventions (NPI). The
model represents competition among VOC, and reveals their mutual inhibitory effects. By separately tracking asymptomatic
and symptomatic infections, model simulations identify a significant role of vaccine breakthrough in the spread of Delta.
Furthermore, the severity of a Delta outbreak depends not only on the NPI and vaccination rate but also on the vaccine
types. Alarmingly, despite Ontario’s existing NPI and relatively successful vaccine rollout, a future, more dangerous VOC
could potentially infect a significant fraction of the province’s population and overwhelm the health care system. To stop
that VOC, the province may need the simultaneous and rapid deployment of a third booster vaccine and stringent NPI.

Introduction
In recent months, severe acute respiratory syndrome coronavirus 2 (SARS-CoV-2) variants associated with increased
transmissibility have emerged and spread, one after another. The World Health Organization has designated a list of
variants of concern (VOC), including Alpha (B.1.1.7), Beta (B.1.351), Gamma (P.1) and Delta (B.1.617.2), as well as multiple
variants of interest.1 Viral lineages carrying the N501Y and/or E484K mutations, i.e., the Alpha, Beta, and Gamma variants,
were first identified in Ontario, Canada in December 2020.2 These VOC quickly outcompeted earlier SARS-CoV-2 lineages
and, as of late April 2021, accounted for all new infections in Ontario, with Alpha being the most prevalent lineage.1 Around
that time, the Delta variant was first reported in the province. By 3 June 2021, the Alpha variant has been reported from at
least 160 countries, Beta from 113 countries, Gamma from 64 countries, and Delta from 62 countries. Since then, the Delta
variant has rapidly become the dominant circulating lineage. As of July 2021, Delta represented the majority of infections
in Ontario.3

Initially, no pharmaceutical agents are known to be safe and effective at preventing or treating coronavirus disease 2019
(COVID-19).4 This leaves public health authorities with nonpharmaceutical interventions (NPI) as the only recourse to
reduce disease transmission; these measures include bans on public gatherings, compulsory stay-at-home policies,
mandating closures of schools and nonessential businesses, face mask ordinances, and quarantine. Even though the WHO
initially expected vaccine development to take 18 months,5 dedicated global efforts resulted in the approval of vaccines
first in China6 and Russia7 in the summer of 2020. Near the end of that year, major vaccines developed by Pfizer-BioNTech,
Moderna, and Oxford-AstraZeneca were approved in North America. Since then, the deployment of vaccines has become
the most important intervention for mitigating disease severity and spread.

Despite costly NPI and the availability of vaccines, SARS-CoV-2 continues to spread and wreak havoc on a global scale. A
major challenge is the rapid emergence of VOC with higher transmissivity, as noted above, and vaccine breakthrough. While
major vaccines are similarly effective against the SARS-CoV-2 wild type, their efficacy against VOC is significantly less and
differs among vaccine types.8 Large discrepancy exists in vaccine deployment among countries, not only in the fraction of
the population vaccinated, but also in the types of vaccines distributed. Thus, a pressing question is: How ready are
different regions of the world in stopping the spread of SARS-CoV-2 VOC? This question must be addressed not only for
existing VOC, but also for future, potentially deadlier ones. Another challenge lies in the role of asymptomatic and
vaccinated patients in spreading the disease. Asymptomatic patients may account for more than half of the COVID-19
cases,9 and non-severe COVID-19 patients can transmit the disease regardless of their symptomatic status.10 Given the
increasing prevalence of VOC vaccine breakthrough, many of these asymptomatic patients may have been vaccinated and

                                                          Page 2/22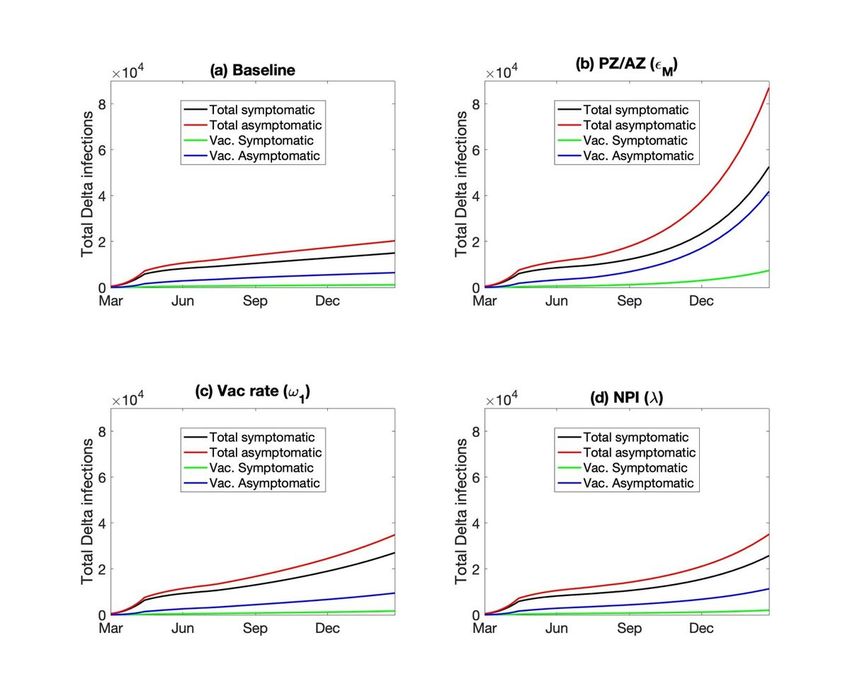
underestimate the likelihood of themselves being COVID-19 carriers. Thus, another critical question is: What role do
vaccinated individuals with asymptomatic infections play in disease transmission?

To answer the above equations, we developed and applied a computational model of the spread of SARS-CoV-2 variants
within a community. The model represents (i) asymptomatic and symptomatic infections, (ii) two-dose vaccinations with
variable dosing intervals, (iii) the effects of NPI (Fig. 1). A large number of epidemiological modeling studies have been
published,11 many of which are based on the Susceptible-Infected-Recovered (SIR) formulation (e.g., 12–15). A key feature
that distinguishes the present study from existing SIR-type models in that it is the first model to represent multiple SARS-
CoV-2 VOC and their competition. We refer to this model as a SV2(AIR)3 model, for its representation of two vaccine types
(V2), asymptomatic infections (A), and three VOC (the power ‘3’ refers to the three instantiations of each infected and
recovered class). The SV2(AIR)3 model can answer the question: To what extent do the interactions and competition among
VOC impact the spread of COVID-19? An example of VOC competition at a population level is this: an individual having
been infected and subsequently recovered from one strain may be partially but incompletely protected against other strains,
and if infected again, they may be more likely to develop an asymptomatic infection. Given the key role of asymptomatic
cases in disease transmission, a thorough understanding of VOC competition is important in determining which (costly)
NPI are necessary to prevent and limit the spread of COVID-19. We apply the model to analyze VOC dynamics in the
province of Ontario in Canada. Ontario has managed a reasonable deployment of vaccines, but is nonetheless on the cusp
of another wave of infections due to Delta. That said, at the time of this study, the number of Delta infections in Ontario
remains substantially lower than much of the rest of the world, which makes Ontario an interesting case study.

Methods
Computational model description.

The SV2(AIR)3 model simulates the spread of three SARS-CoV-2 strains in Ontario: wild type, Alpha, and Delta. Population in
the province is divided into several classes based on their health and vaccination status. Two “susceptible” populations are
tracked: the original susceptible individuals (denoted ‘S’), who are unvaccinated and have never been infected, and those
who become susceptible again after losing their immunity from either vaccination or infection (denoted ‘S VR’; more about
loss of immunity below). The original susceptible population (S, but not S VR) vaccinate at a rate of ω1 and enter the V1M
class. Two vaccine types are represented, Pfizer-BioNTech (M = PZ) and AstraZeneca (M = AZ). Pfizer-BioNTech, which we
refer to as “Pfizer,” also represents the Moderna vaccines. We denote the fraction of Pfizer vaccines by εPZ and the
remainder εAZ = 1-εPZ are AstraZeneca. Those who received the first dose will receive their second dose and enter the V2M
class at rate of ω2M, where M denotes either PZ or AZ, as dosing interval differs between vaccine types. Mixed vaccination
is not represented. Individuals vaccinated with one or two doses lose their immunity at a rate of ηV1 and ηV2, respectively,
and enter the S VR class. We assume that those who lost the immunity did so unwittingly so would not get vaccinated again.

                                          dS
                                          dt
                                             = −S
                                                  X=W,A,D
                                                         (
                                                    ∑ β XIXtotal + ω1               )   + μ ( N − S)

(1)

                                                                        (                       )
      dS VR
                                      M                          M                                                        X
       dt
              = η V1      ∑          V 1 + η V2      ∑          V 2 + η R RF +     ∑       RX       − S VR     ∑       β XItotal − μS VR
                       M = PZ , AZ                M = PZ , AZ                    X=W,A,D                     X=W,A,D

(2)
                                                                     Page 3/22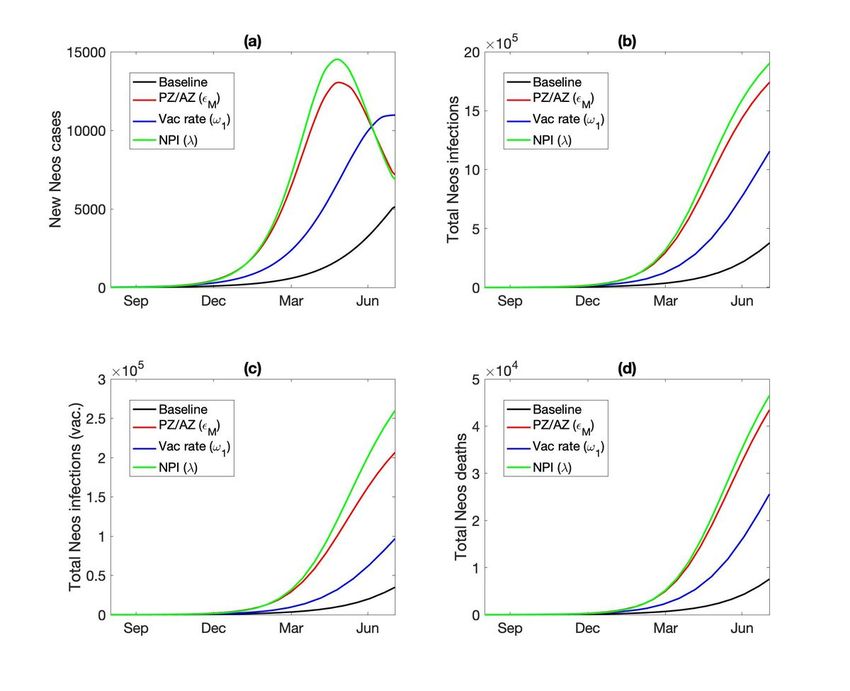
dV M
                    1
                    dt
                          = ϵ Mω 1 S +
                                        (             ∑
                                                  X=W,A,D
                                                              AX
                                                                   )   − VM
                                                                          1           ∑
                                                                                X=W,A,D
                                                                                               βX       X         M
                                                                                                                   (             M
                                                                                                V1 , MI total − ω 2 + η V1 + μ V 1          )
(3)
                                dV M
                                   2
                                   dt
                                            = ωM  M    M
                                               2 V1 − V2           (        ∑
                                                                       X=W,A,D
                                                                                  βX       X
                                                                                   V2 , MI total    )    −   (η V2 + μ )V M2

(4)
where IX        X    X     X
       total = I + I V + I R + α            (             )
                                 X A X + A X . Except for the symptomatic patients (see below), all die naturally at a rate
                                           R

of µ. Births are added to S at a rate of µ.

Both susceptible classes (S and S VR) become infected by one of the viruses at rate βX, potentially by coming in contact with
a symptomatic infected individual (denoted IX), where superscript ‘X’ denotes one of the SARS-CoV-2 viruses: ‘W’ for wild-
type, ‘A’ for Alpha, and ‘D’ for Delta. An infection can also be caused by an asymptomatic infected individual (denoted AX),
with a higher rate of αXβX, where αX > 1 with the assumption that asymptomatic individuals are more socially active. We
assume that for a virus type X, a fraction σX of the infections are asymptomatic. Symptomatic infection is associated with
a mortality rate (µX) higher than natural death (µ), but asymptomatic infection does not increase one’s mortality rate.
Vaccinated individuals may be infected as well, at a reduced rate of βXVM (< βX), where V is either V1 or V2, and M denotes
the vaccine type. Asymptomatic infections of vaccinated individuals enter AX class, same as infections of unvaccinated
individuals. In contrast, symptomatic infections of vaccinated individuals are assumed to have a better survival rate (with a
mortality rate µXV < µX), and are represented as a separate infected class IXV. Unvaccinated asymptomatic patients
vaccinate at the same rate as the susceptible population (ω1).

                               dIX
                               dt
                                   =        (1 − σ ) (S + S )
                                                      X
                                                                       VR   (     ∑
                                                                                X=W,A,D
                                                                                            β XIX
                                                                                                total    )     (
                                                                                                             − γ X + μ X IX    )
(5)
dIX
  V
 dt
      =   (1 − σ )
                X
                     (      ∑
                         M = PZ , AZ
                                       (   VM
                                            1      ∑
                                                X=W,A,D
                                                          βX       X
                                                           V1 , MI total      )   +       ∑
                                                                                      M = PZ , AZ
                                                                                                    (   VM
                                                                                                         2     ∑
                                                                                                             X=W,A,D
                                                                                                                           βX       X
                                                                                                                            V2 , MI total   ))     (
                                                                                                                                                 − γX + μX )X
                                                                                                                                                         V IV

(6)
                                            dIX
                                            dt
                                              R
                                                  =   (1 − σ )βX       X X
                                                                       RI total   (∑ )
                                                                                  Y≠X
                                                                                          RY        (
                                                                                                 − γX + μX  X
                                                                                                         V IR      )
(7)
      dA X
       dt        (
           = σ X S + S VR      )   (X=W,A,D
                                            ∑      β XIX
                                                       total   ) ( + σX
                                                                      V           ∑
                                                                             X=W,A,D
                                                                                           (β   X
                                                                                                V1V 1    + βX       X
                                                                                                                       )
                                                                                                            V2V 2 I total       )     (
                                                                                                                                    − ω1 + γ X + μ A X )

                                                                            Page 4/22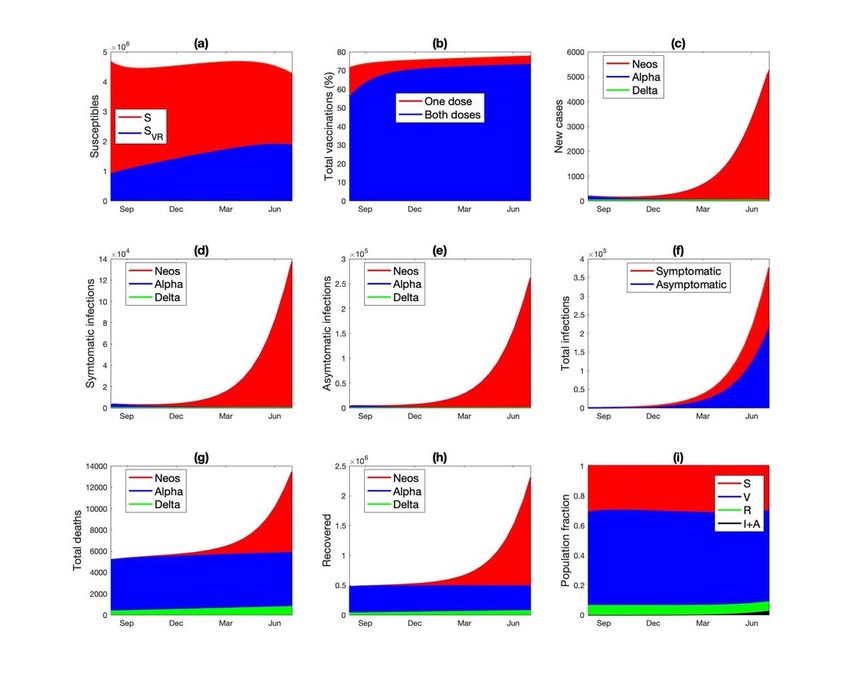
(8)
                                              X
                                         dA R
                                             dt
                                                        X X
                                                                               (
                                                  = σ Xβ RItotal ∑ R Y − γ X + μ A R
                                                                   Y≠X
                                                                                           )   X

(9)
Infected individuals recover and enter class RX at a rate of γX. Recovered individuals are entirely protected from the variant
that they were infected with, but may be infected by a different variant at rate βYR, where Y ≠ X, and βYR < βY to represent
some degree of protection. Infected recovered individuals are denoted IXR, which like IXV are associated with a better
survival rate (µXR < µX). Recovered individuals lose their partial immunity and enter S VR at a rate of ηR. Four recovered
classes are represented, one for each virus type (RW, RA, RD) and also RF who has recovered from two infections. We
assume that RF is fully immune to all three viruses, until they lose their immunity and become fully susceptible.

                            dR X
                             dt          (   X
                                                         )
                                 = γ X IX + IV + A X − R X
                                                                     (∑        Y Y
                                                                           β RItotal
                                                                         Y≠X
                                                                                       )   −   ( η R + μ )R X

(10)
                                      dR F
                                       dt
                                           =
                                             X=W,A,D
                                                               (
                                               ∑ γ X IXR + A XR −              ) (η   R        )
                                                                                          + μ RF

(11)
Model parameters.

The SV2(AIR)3 model involves parameters that describe the clinical characteristics of SARS-CoV-2 VOC, which were
estimated from published studies. Other parameters describe the demographics and social behaviors of the Ontario
population, which were estimated from published provincial statistics. Parameters were then fine-tuned manually so that
model predictions approximate the published number of new infections and deaths (Ontario COVID-19 Science Advisory
Table). Baseline parameter values are shown in Table S1.

Simulating NPI.

As the number of COVID-19 rose, on March 23 2020 the Ontario government began a number of public health safety
measures, which varied in severity over time, including stay-at-home orders, workplace safety measures, restrictions on
public events and social gatherings, temporary shutdown of selected businesses, and mandatory mask wearing. These NPI
reduce the transmissivity of COVID-19, and are represented by scaling all βX’s and βXV,M’s simultaneously by a NPI severity
index λ, where 0 ≤ λ ≤ 1. The time-varying function λ is chosen in part based on Ontario COVID-19 lockdown timeline and
Google mobility data, and in part to fit the predicted new case numbers against provincial data; the values of λ for 2020–
2021 are shown in Fig. S1.

Results
The dynamics of COVID-19 VOC in Ontario, Canada.

                                                              Page 5/22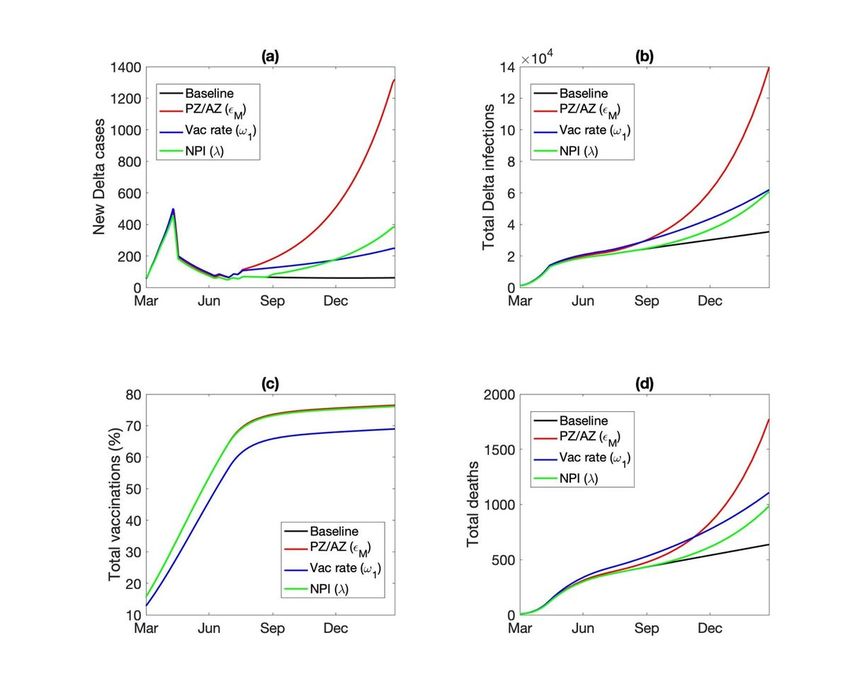
Model solution was computed to simulate the spread of SARS-CoV-2 in Ontario for two years, from January 1 2020 to
December 31 2021. The SV2(AIR)3 model represents the dynamics of and interactions among three SARS-CoV-2 strains:
Wild type, Alpha, and Delta, denoted by superscripts ‘W’, ‘A’, and ‘D’, respectively. On January 1 2020, we assume that the
entire Ontario population was susceptible, except for 15 infected symptomatic individuals (wild-type). The Alpha strain was
introduced into Ontario via the entrance of 50 asymptomatic infected individuals per day for 1.5 months at the end of 2020;
Delta was introduced similarly in February and March 2021 (25 asymptomatic infected individuals per day). Vaccination
became available on December 14 2020; details for vaccination rates can be found in the supplement.
Key measures of the pandemic are illustrated in Fig. 2. The total number of new infections exhibits two peaks (Fig. 2(a)),
with the first wave in December 2020 driven by the wild type, and the second around March 2021 driven by Alpha. By mid-
June 2021, the new infections are dominated by the Delta variant. These predictions are consistent with Ontario statistics
(Ontario COVID-19 Science Advisory Table). The total number of infections, including asymptomatic and symptomatic
infections, are shown in Fig. 2(b). The model predicts that by the end of 2021, about 600K people would have been infected,
half of whom are asymptomatic. The cumulative infection curves exhibit the steepest rise in December 2020 and March
2021, corresponding to the two peaks in the new case counts. By the end of 2021, 71% of the Ontario population would
have been vaccinated with at least one dose, with 57% fully vaccinated (Fig. 2(c)). At that time, 10K would have died from
COVID, with 39, 48, and 13% from wild type, Alpha, and Delta, respectively (Fig. 2(d)).
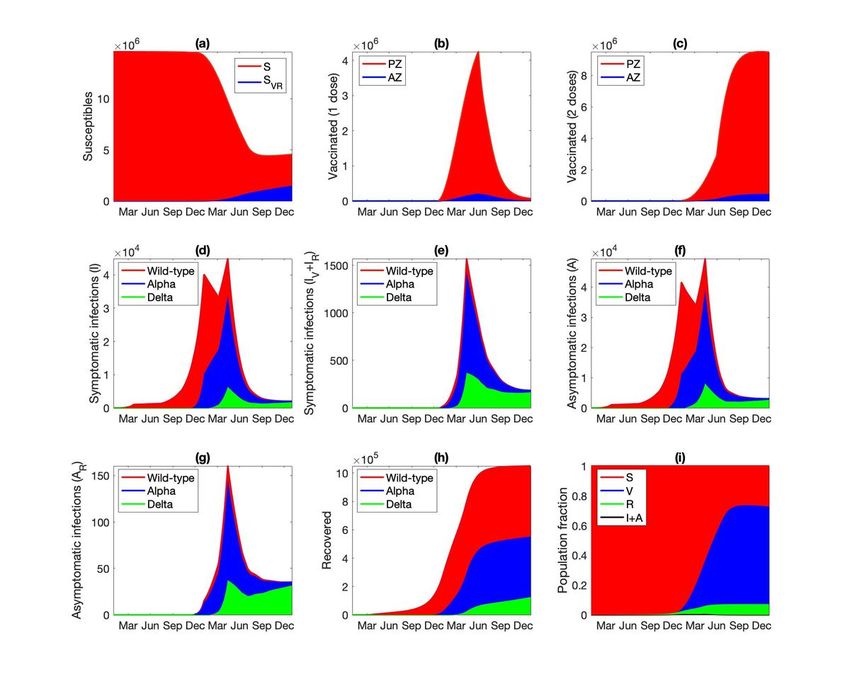
Predicted population dynamics are shown in Fig. 3. The drop in the susceptible population becomes significant after
December 2020 (Fig. 3(a)) and is driven primarily by the vaccine deployment. By the end of June 2021, only 37% of the
Ontario population are susceptible, with the majority having received at least one dose of vaccine (Fig. 3(b,c)). The number
of active infections peaks at the end of 2020, followed by an even higher peak at the end of spring (Fig. 3(d)). These are the
wild-type and Alpha-driven waves identified in Fig. 2(a) and described above. The Alpha-driven infection peak accounts for
0.7% of the total population, but subsides as the vaccination effort accelerates. The infections are split approximately half-
half between asymptomatic and symptomatic ones, with the majority unvaccinated (Fig. 3(d-g)). As the infection spreads,
the recovered population also increases, to 7% of the population at the end of 2021 (Fig. 3(h)). These dynamics are
summarized as fractions of the population that are susceptible, vaccinated, infected, and recovered, as shown in Fig. 3(i).
Sensitivity analysis.
To identify the strongest determinants of the pandemic severity, we assess the sensitivity of model predictions to variations
in key model parameters. We conduct the sensitivity analysis in a simplified model that represents only the wild-type SARS-
CoV-2, for the year 2020, but with infectivity βW elevated to 5E-9. The Alpha and Delta strains are not included. We assume
that NPI begin on March 1 2020, with the restrictiveness index λ taken to be uniformly 0.5 (i.e., infectivity β’s halved) for
simplicity. Vaccination begins on April 1 2020 (not the end of 2020, for this simplified one-year simulation), with baseline
dosing interval taken to be 4 weeks for Pfizer and 8 weeks for AstraZeneca (dosing interval is one of the parameters
varied).16 Parameters that are varied include those that describe the clinical features of the viruses as well as provincial
policy and pharmaceutical intervention.
Clinical features of the viruses that were considered include its infectivity (βW), the fraction of infections that are
asymptomatic (σW), the infectivity ratio between asymptomatic and symptomatic individuals (αW), mortality rate (µW), and
recovery rates (γWA and γWI, varied simultaneously). Recall the baseline assumption that asymptomatic individuals are
assumed to be more active and 3 times more likely to spread the disease than symptomatic ones (αW = 3). Thus, the
number of infections directly depends on, and is in fact highly sensitive to, βW, σW, αW, and also to the recovery rate γW,
which impacts how many new infections an infected individual can cause. Small variations in these four parameters (5%)
result in changes in the number of infections and deaths that are an order of magnitude larger; see Fig. 4. COVID-19
mortality rate µWI affects the number of infected individuals who are alive and can participate in the spread of the disease.
Page 6/22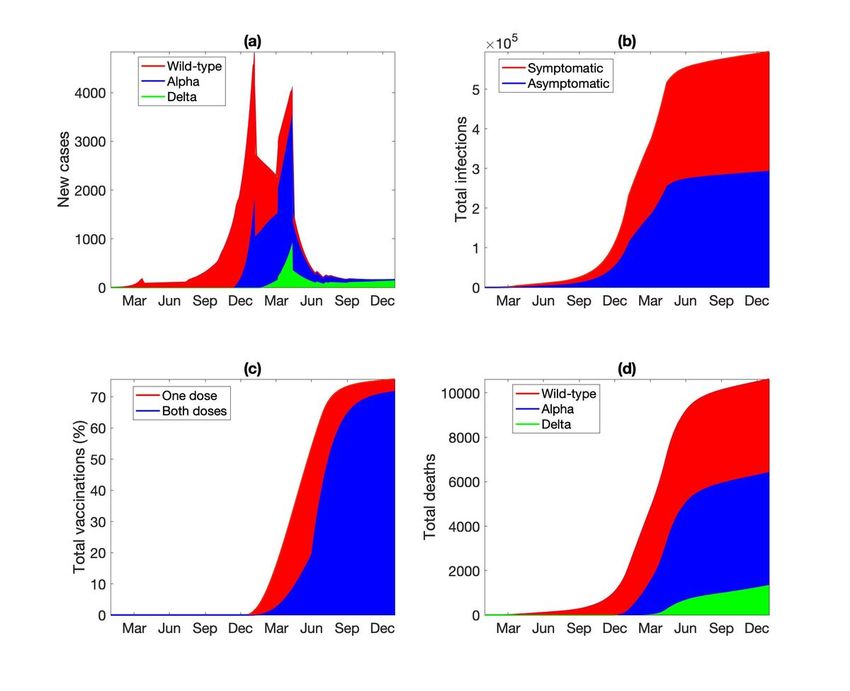
Because COVID-19 mortality rate can vary substantially depending on health care infrastructure, we varied µWI by 50%. As
expected, changes in µWI are immediately reflected in the number of deaths. However, compared to other clinical features of
SARS-CoV-2, the mortality rate has a relatively small effect on the infected population, since < 5% of them die (Fig. 4).

Provincial policy and pharmaceutical interventions that were considered include NPI that reduce the effective disease
infectivity (via scaling by λ), vaccination rate (ω1), delay between the first and second vaccine doses (ω2,PZ and ω2,AZ,
varied simultaneously), and vaccine escape rate (βWV). λ and ω1 are varied by 5%. Since NPI are modelled by scaling βW
directly, they have large effects on model predictions (Fig. 4). Vaccination rate has lesser but still significant effects on the
spread of the disease. The effects of dosing interval (ω2) and vaccine escape rate (βWV) are much smaller. Because dosing
interval can vary greatly within the population, and because vaccine escape rate is not sufficiently well characterized, these
two parameters were varied by 50%. The vaccine-related results suggest that among these three factors, an effective
vaccine deployment (captured in ω1) is the key in combating a pandemic, and success may be achieved even by means of
a less-than-ideal vaccine with higher escape rate (Fig. 4). Since the predicted numbers of infections and deaths are
substantially more sensitive to variations in ω1 than ω2, if vaccine supply is limited, prioritizing the first dose by
lengthening the dosing interval would be advisable, as was done in Canada.

Competition among VOC.

Individuals who have recovered from COVID-19 gain partial immunity not only to that particular strain, but other strains as
well, albeit to a lesser extent. In that sense, the VOC don’t spread independently but may instead exhibit inhibitory effect on
each other. To understand their interactions, we conduct simulations with some of the VOC eliminated. The predicted
number of infections for each scenario is shown in Fig. 5. Results suggest that Alpha and Delta have minimal impact on
the spread of the wild type. When Alpha and/or Delta were eliminated, the number of wild-type infections was barely
affected. That insensitivity can be explained by the observation that the wild-type strain spread with little competition for
almost a year. By the time the other VOC emerge, the wild type is already on its decline due to the NPI. In contrast, the wild
type has a significant impact on both Alpha and Delta. In the absence of the wild type, fewer of the population would have
acquired partial immunity to Alpha, and the number of Alpha infections would be 19% higher. Similarly, in the absence of
both the wild type and Alpha, there would have been 35% more Delta infections. Similar trends are seen in the mortality
counts (results not shown). These results point to the importance of taking VOC competition into account when analyzing
and predicting COVID-19 dynamics.

Spread of the Delta variant.

The Delta variant, which compared to earlier strains exhibits substantially higher transmissivity and vaccines breakthrough
rate, is driving a surge in COVID-19 cases in much of the world. The baseline model simulation describes what happened in
Ontario: that after its introduction at the beginning of 2021, the number of new Delta cases peaked in April, before it was
suppressed by the provincial lockdown that began on April 13. Simulation predicts that provided that some significant NPI
remain in place throughout the remainder of 2021 and 2022 (λ ≤ 0.4), the Delta variant will remain under control. However,
given the high price that society must pay for being insufficiently vigilant against COVID-19, it is prudent to explore all
possibilities in which the pandemic can explode. Hence, we conduct simulations to analyze the spread of the Delta variant
under alternative scenarios.

The baseline model assumes that 95% of the vaccines are Pfizer and 5% are AstraZeneca, consistent with Ontario
vaccination statistics. What if a larger fraction of the vaccines were AstraZeneca, as is the case in the UK.17 A notable
difference between the two vaccine types is that the Pfizer vaccine offers stronger protection than AstraZeneca against all
COVID variants, especially Delta, after either one or two doses. For instance, an individual having received both doses of the
Pfizer vaccine is 88% protected against the Delta variant, whereas with the AstraZeneca vaccine the protection is only at
60%.18 We conduct a simulation in which only 40% of the vaccines are Pfizer. With a larger portion of the vaccinated
                                                            Page 7/22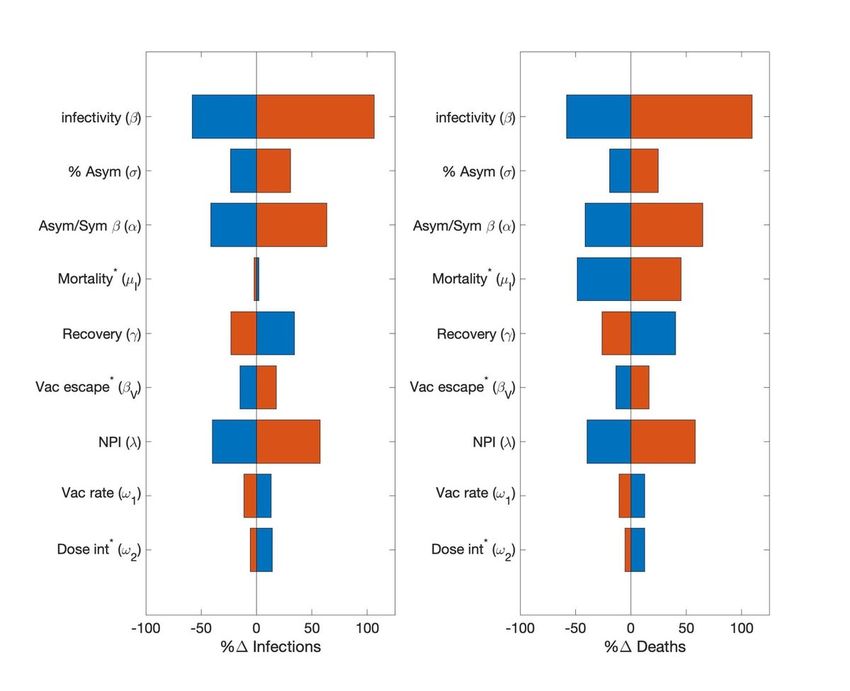
population now under reduced vaccine protection, the spread of the VOC is substantially accelerated. By the end of 2021,
the model predicts 733 new Delta infections a day, an order of magnitude higher than the baseline prediction of 60 new
Delta infections a day (Fig. 6(a)). The total number of Delta infections and related deaths are also much higher, predicted to
be 84K and 1.1K at the end of 2021, respectively, compared to baseline values of 33K and 584 (Fig. 6(b,d)).

If the provincial vaccination rate were lower, such that by September 1 2021 only 67% of the population are vaccinated with
at least one dose, compared to the baseline vaccinated percentage of 74% (Fig. 6(c)), the total number of Delta infections
and deaths would increase by 75% by the end of March 2022; see Fig. 6(b,d).

Beginning mid-June 2021, Ontario began to gradually reopen, with in-person classes set to resume in September. The
baseline model assumes that the NPI that remain will still reduce COVID-19 infectivity by 60%. What if that assumption is
overly optimistic? Indeed, it is not uncommon to experience pandemic fatigue and crave personal interactions; also, there
may be outbreaks in schools. Thus, we consider a scenario with less stringent NPI starting from the fall of 2021 (September
1 2021), with λ increased from its baseline value of 0.4 to 0.5 onwards. The model predicts the reduced NPI would
accelerate the spread of Delta, such that by March 2022, the total number of Delta infections would be 75% higher than
baseline (Fig. 6(b)).

Who are getting infected by the Delta variant, and who are the carriers? Interestingly, while the wild-type infections are about
equally split between asymptomatic and symptomatic, ~ 60% of the Delta-infected population are asymptomatic. This
difference may be attributable to the vaccination status of the infected population. Due to the larger vaccine breakthrough
rate of the Delta variant, almost a quarter of the infected individuals have been vaccinated (Fig. 7(a)); in contrast, for the
wild type, vaccinated individuals make up a negligible fraction of the infected population (Fig. 3). Because vaccination
protects one from most major COVID-19 symptoms, most of the vaccinated infections are assumed to be asymptomatic
(85% compared to 50% for the unvaccinated). Taken together, the vaccinated and asymptomatic individuals play a more
significant role in spreading the Delta variant, compared to the wild type. And that difference is even larger in the alternative
scenario where most of the vaccines are AstraZeneca (Fig. 7(b)).

The spread of a hypothetical, deadlier VOC, Neos.

Alpha is more infectious than the wild type; Delta is worse than Alpha; Lambda may be even worse. How bad can things
get? What are the effective and reasonable measures against the challenges presented by an ever-evolving coronavirus? To
gain insights, we simulate a dangerous hypothetical variant, which we refer to as “Neos.” Neos is designed to be deadlier by
increasing its (i) infectivity (14% higher than the Delta variant), (ii) vaccine escape rate (70% for one dose of Pfizer or
AstraZeneca, similar to Delta which is 67%; 25% and 50% for two doses of Pfizer and AstraZeneca, respectively; compared
to 12% and 40% for Delta), and (iii) fraction of asymptomatic infections (55% instead of 50%). Recovery rate, mortality rate,
and other clinical features are assumed to be the same as the wild type.

We assume that Neos emerges in the fall of 2021. The predicted population dynamics that describe its spread, from August
1 2021 to June 30 2022, is shown in Fig. 8. After its introduction, Neos quickly takes hold due to its high transmissivity, and
by the end of 2021, it has overtaken Delta to account for the majority of new infections (Fig. 8(c)). By mid 2022, the
infected individuals would account for 1% of the entire population (Fig. 8(f)), despite nearly 80% of the population having
been vaccinated. More than 13.5K would have died from Neos (Fig. 8(g)); that is likely an underestimate, since the number
of severe cases might overwhelm the hospitals, elevating the mortality rate.

While those predicted numbers are alarming, the situation could be even more dire. How much more quickly would Neos
spread under the three alternative scenarios we previously considered for Delta? That is, (i) if 60% of the vaccines are
AstraZeneca, (ii) if vaccination deployment is slower, and (iii) if NPI are relaxed. If the vaccination rate is 20% lower, the
model predicts that the total number of Neos infections would be 3 times the original value; with 60% AstraZeneca
vaccines, 4.6 times; fewer restrictions (λ = 0.5 instead of 0.4), 5 times. See Fig. 9(b). Similar trends are predicted for the

                                                            Page 8/22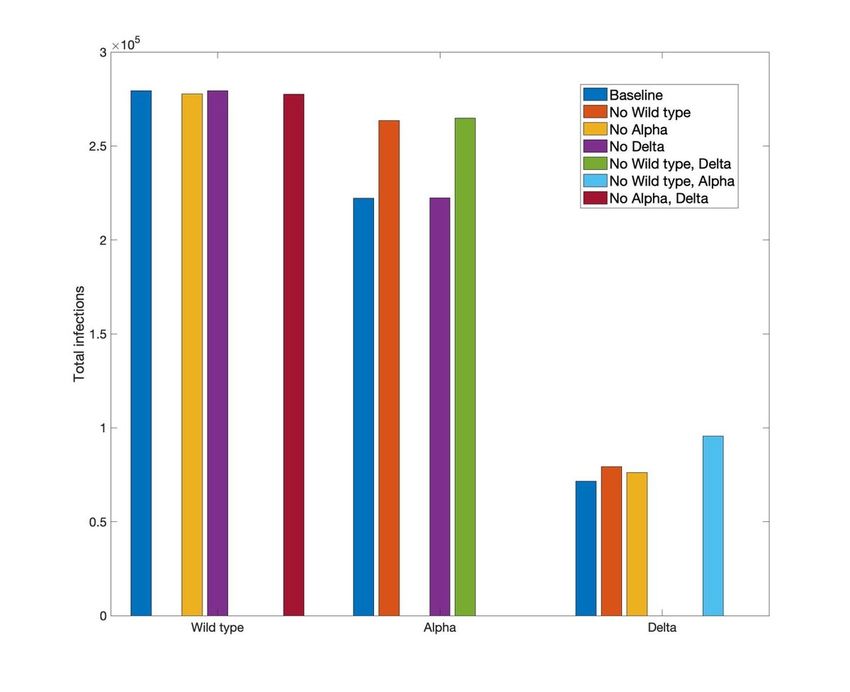
vaccinated individuals infected by Neos (Fig. 9 (c)), and for the total deaths from the Neos strain (Fig. 9(d)). In the case
where NPI are relaxed, by the middle of 2022, 13% of the entire population would have been infected by Neos, and 0.3%
would have died from the disease, not counting other strains.

What can the province to do combat the spread of Neos? Two potential measures are investigated. First, we consider more
stringent NPI, perhaps a provincial lockdown. As noted above, the baseline model includes some NPI that are assumed to
lower social contacts by at least 60%. We evaluate the effectiveness of additional NPI that further limit social contacts, and
thus infectivity of all variants, by another 60%. These measures are assumed to commence on September 1 2021 and
remain in place through the end of the simulation. The predicted number of symptomatic infections from Neos, Alpha, and
Delta are shown in Fig. 10(a1). We choose to highlight symptomatic infections because they strongly correlate with stress
on the healthcare system. During the simulated period, the wild-type has essentially disappeared and is thus not shown.
The model predicts that such stringent measures may slow the spread of Neos. The number of Neos infections still
increases, but at a drastically lower rate than in the original setting (compare Fig. 8(d) and Fig. 10(a1)).

Many stringent NPI are associated with high economic costs. And the model predicts that even stringent NPI may not
eradicate Neos. Thus, we consider an alternative pharmaceutical measure: a vaccine booster. A third Pfizer shot has been
reported to offer increased protection from the Delta variant.19 In this simulation, we assume that a third dose of either the
Pfizer or AstraZeneca vaccine would reduce vaccine breakthrough of Neos to 10% and 20%, respectively (compared to 25%
and 50%, respectively, with two doses), and also double the protection against Alpha and Delta. To model a third vaccine
dose, we add a new population V3M that has received three vaccine shots.

                        dV M
                         dt
                           3
                               = ωM  M    M
                                  2 V2 − V3      (     ∑
                                                     X=W,A,D
                                                               βX   (   X   X X
                                                                V3 , M I + α A    )   )   −   (η V3 + μ )V M3

(12)
The model predicts that the third vaccine dose, if indeed effective, would be successful in suppressing the spread of Neos;
see Fig. 10(b1). During 2022, the number of active COVID-19 cases steadily decreases, driven primarily by the decline in
Alpha and Delta infections, even as Neos infection numbers remain relatively stable.

While neither NPI or a vaccine booster alone can rapidly eradicate Neos, implemented together that goal can be
accomplished. A model that combines the two measures predicts that the number of symptomatic COVID-19 cases would
decrease throughout the simulated period to fewer than 100 cases in mid 2022; see Fig. 10(c1).

How effective are these measures in a region with 60% AstraZeneca vaccines? Model simulations predict that with NPI
alone, there would still be widespread Neos infections, due to Neos’ higher vaccine breakthrough with the AstraZeneca
vaccines (Fig. 10(a2)). With the dissemination of a third vaccine dose to increase vaccine protection, the number of Neos
infections continues to increase, albeit at a slower rate, and the total symptomatic infections finally begin to decline by mid
2022 (Fig. 10(b2)), after exceeding 0.1% of the total population. These results suggest that neither NPI nor a vaccine
booster would prevent the healthcare system from being overwhelmed. Implemented together, these two measures are
sufficiently efficient to bring the total number of symptomatic COVID-19 infections to < 750 by mid 2022 (Fig. 10(c2)).

Discussion
The principal objective of the present study is to better understand the spread of the VOC of SARS-CoV-2, and how effective
different interventions may be. To achieve that objective, we developed an SV2(AIR)3 model that represents factors key to
the spread of COVID-19: (i) asymptomatic and symptomatic infections,20,21 (ii) simultaneous spread of multiple VOC, (iii)

                                                           Page 9/22
two-dose vaccinations with variable dosing intervals,22 (iv) two vaccines with different efficacy, and (v) the effects of NPI.23
Main findings of this study include:
1. It is well understood that for any infectious disease, the major factors that determine how fast it spreads include
infectivity, the extent of the NPI, and vaccination rate. For COVID-19, our sensitivity analysis reveals two additional
factors, the prevalence of asymptomatic infections and the enhanced infectivity of asymptomatic patients (Fig. 4).
2. The present model is the first in capturing VOC interactions at a population level. Individuals having recovered from an
infection by one strain acquire partial immunity against other strains, and if infected again, are more likely to develop
an asymptomatic infection. Model simulations indicate that some VOC have an inhibitory effect on the spread of
others (Fig. 5).
3. While the Delta strain is undoubtedly wreaking havoc globally, severity differs among countries. Our analysis suggests
that how fast Delta spreads depends not only on the NPI and on the fraction of the population who are vaccinated, but
also on the types of the vaccines distributed (Fig. 6).
4. Vaccinated individuals have a significant chance of suffering a vaccine breakthrough with Delta. Model analysis
points to a significant role of the vaccinated individuals in the spread of Delta, particularly in a community where most
of the vaccines are AstraZeneca (Fig. 7).
5. Given its current NPI and relatively successful vaccination rollout, is Ontario prepared for the emergence of a more
dangerous VOC? A VOC that is more infectious, causes more asymptomatic infections, and has a higher vaccine
breakthrough rate? Unfortunately, our model simulation suggests that the answer is no. Without additional
interventions, such a VOC would infect many more and likely overwhelm the health care system (Fig. 8). The situation
would likely be worse in another region that has a lower rate of vaccination or less effective vaccines (Fig. 9).
6. To stop such a dangerous VOC, one may need both simultaneous and rapid deployment of pharmaceutical and NPI
(Fig. 10).
Results of this study point to the importance of sustained vigilance against SARS-CoV-2. As previously noted, a significant
number of the Delta infections are caused by vaccinated individuals with asymptomatic infections. Consequently, even
with > 70% of the Ontario population have received at least one vaccine dose, some NPI must remain to prevent the further
spread of Delta, or the emergence and rapid spread of the next series of more dangerous VOC. When in-person classes
resume in public schools and college in September, any Delta outbreak and the emergence of new VOC must be closely
monitored, and if necessary, NPI must be reinstated. And for these NPI to be effective, they must begin sufficiently early.
The news that a third dose of the Pfizer vaccine enhances one’s protection against the Delta strain is exciting.24 Indeed, the
combination of NPI and a booster shot may be necessary in our fight against a future, deadlier VOC. That said, given that
much of the world have inadequate access to vaccines, the deployment of a third vaccine dose raises some moral
questions.
Limitations of the study.
The SV2(AIR)3 model separates the population in terms of their health and vaccination status: susceptible, vaccinated (one
dose or two, with Pfizer or AstraZeneca), infected (asymptomatic or symptomatic, infected by different VOC), and
recovered. Each subpopulation is assumed to be homogeneous. In contrast, COVID-19 infection and mortality rates exhibit
distinct age and, to a lesser extent, gender specificity, and those demographics characteristics differ among the VOC.25
Also, age determines one’s social behaviors, which would affect their susceptibility, or ability to infect others if they are sick.
The severity of COVID-19 sequela depends also on the infected individual’s health.26 Age, gender, and health specificity of
COVID-19 infections can be incorporated into the present model by separating each subpopulation into key age groups,
genders, and health conditions.
Page 10/22Furthermore, as can be seen in the geographical heterogeneity in the number of COVID-19 cases in Ontario, socio-economic
factors also play an important role in the local spread of COVID-19. These factors include the number of people per
household, job locations, frequency of public transportation usage, regional vaccination rates, and social connectedness,
etc. Thus, a worthwhile extension would be to divide Ontario into regions with distinct demographics, represent the spread
of COVID-19 within each region using an incarnation of the SV2(AIR)3 model, and then loosely connect these sub-models
based on the estimated amounts of communications mediated by job or social travels.
The present model is formulated using data from Ontario, Canada (Ontario COVID-19 Science Advisory Table).
Geographical and socio-economic parameters can be refitted to simulate VOC dynamics in a different province in Canada
or a different country (e.g., infectivity β, vaccine type ε, COVID-19 mortality rate µX, NPI λ). These models can be a valuable
decision-support tool for public health.
Declarations
Acknowledgements
This study is partially supported by the Canada 150 Research Chairs Program, the Natural Sciences and Engineering
Research Council of Canada (NSERC Discovery award: RGPIN-2019-03916), and the Canadian Institutes of Health
Research, Canadian Immunity Task Force.
Author contributions
Conceptualization, ATL and MS; methodology, validation, analysis, and resources, ATL; data curation, ATL and MS; writing—
original draft preparation, ATL; writing—review and editing, MS and ATL; visualization, ATL; project administration and
funding acquisition, ATL. All authors have read and agreed to the published version of the manuscript.
Materials and Correspondence
Contact Prof. Anita Layton, anita.layton@uwaterloo.ca.
Competing interests
None.
Data availability
The computer code produced in this study is available in https://github.com/MehrshadSD/
References
1. (WHO), W. H. O. COVID-19 weekly epidemiological update. (2021).
2. Tuite, A. R. et al. COVID-19 Hospitalizations, ICU Admissions and Deaths Associated with the New Variants of Concern.
(2021).
3. Estimating the prevalence and growth of SARS-CoV-2 variants in Ontario using mutation profiles: Queen’s Printer for
Ontario. (Public Health Ontario, 2021).
4. Fauci, A. S., Lane, H. C. & Redfield, R. R. (Mass Medical Soc, 2020).
5. Grenfell, R. & Drew, T. Here's why the WHO says a coronavirus vaccine is 18 months away. (2020).
6. Pinghui, Z. in South China Morning Post (2020).
7. Kramer, A. in The New York Times (2020).
Page 11/228. Bernal, J. L. et al. Effectiveness of the Pfizer-BioNTech and Oxford-AstraZeneca vaccines on covid-19 related
symptoms, hospital admissions, and mortality in older adults in England: test negative case-control study. bmj373
(2021).
9. Al-Qahtani, M. et al. The prevalence of asymptomatic and symptomatic COVID-19 in a cohort of quarantined subjects.
International Journal of Infectious Diseases102, 285-288 (2021).
10. Li, Y. et al. Asymptomatic and symptomatic patients with non-severe coronavirus disease (COVID-19) have similar
clinical features and virological courses: a retrospective single center study. Frontiers in microbiology11, 1570 (2020).
11. Mohamadou, Y., Halidou, A. & Kapen, P. T. A review of mathematical modeling, artificial intelligence and datasets used
in the study, prediction and management of COVID-19. Applied Intelligence50, 3913-3925 (2020).
12. Cooper, I., Mondal, A. & Antonopoulos, C. G. A SIR model assumption for the spread of COVID-19 in different
communities. Chaos, Solitons & Fractals139, 110057 (2020).
13. Chen, Y.-C., Lu, P.-E., Chang, C.-S. & Liu, T.-H. A time-dependent SIR model for COVID-19 with undetectable infected
persons. IEEE Transactions on Network Science and Engineering7, 3279-3294 (2020).
14. He, S., Peng, Y. & Sun, K. SEIR modeling of the COVID-19 and its dynamics. Nonlinear dynamics101, 1667-1680 (2020).
15. Mwalili, S., Kimathi, M., Ojiambo, V., Gathungu, D. & Mbogo, R. SEIR model for COVID-19 dynamics incorporating the
environment and social distancing. BMC Research Notes13, 1-5 (2020).
16. Ontario Ministry of Health: COVID-19 public health measures and advice, (2021).
17. Medicines & Healthcare products Regulatory agency: Coronavirus vaccine - weekly summary of Yellow Card reporting,
(2021).
18. Duong, D. (Can Med Assoc, 2021).
19. Pfizer. Second quarter 2021 earnings teleconference. (2021).
20. Ahmed, I., Modu, G. U., Yusuf, A., Kumam, P. & Yusuf, I. A mathematical model of Coronavirus Disease (COVID-19)
containing asymptomatic and symptomatic classes. Results in Physics21, 103776 (2021).
21. Tomochi, M. & Kono, M. A mathematical model for COVID‐19 pandemic—SIIR model: Effects of asymptomatic
individuals. Journal of General and Family Medicine22, 5-14 (2021).
22. Saad-Roy, C. M. et al. Epidemiological and evolutionary considerations of SARS-CoV-2 vaccine dosing regimes.
Science372, 363-370 (2021).
23. Baker, R. E. et al. The impact of COVID-19 nonpharmaceutical interventions on the future dynamics of endemic
infections. Proceedings of the National Academy of Sciences117, 30547-30553 (2020).
24. Howard, J. in CNN (2021).
25. Sobotka, T., Brzozowska, Z., Muttarak, R., Zeman, K. & Di Lego, V. Age, gender and COVID-19 infections. MedRxiv
(2020).
26. Fang, L., Karakiulakis, G. & Roth, M. Are patients with hypertension and diabetes mellitus at increased risk for COVID-19
infection? The Lancet. Respiratory Medicine (2020).
Figures
Page 12/22Figure 1
Panel A, schematic diagram for a simplified version of the SV2(AIR)3 model, representing only one virus and one vaccine
type. S and SVR, susceptible class; IW, IWV and IWR, symptomatic infected class; AW and AWR, asymptomatic infected
class; RW and RF recovered class. Arrows denote the movement from one class to another, via infection (red arrows),
vaccination (blue arrows), recovery, or loss of immunity. Rates are indicated on the arrows. β, infection rate; Ɣ, recovery rate;
n, rate of immunity loss; μ, death rate; ω, vaccination rate. For a complete definition of the variables, superscripts, and
subscripts, see text. In the complete model, three viruses (W = wild type, A = Alpha, D = Delta) and two vaccine types (PZ =
Pfizer and AZ = AstraZeneca) are represented. Deaths are indicated only for the symptomatic infected classes, even though
natural deaths are represented for all populations. Panel B shows the full connections associated with the susceptible class
S. Arrows indicate movement of S into one of the six infected classes (the A’s and I’s) or one of the two vaccinated classes
(V1’s). Movements from one of these infected or vaccinated into another class are not shown.
Page 13/22Figure 2
(a) Number of new infections for each of the viruses, shown as 7-day means from January 1 2020 to December 31 2021.
(b) Cumulative asymptomatic and symptomatic infections for all viruses. (c) Fraction of population vaccinated with at
least one dose and with both doses. (d) Cumulative deaths from each of the viruses.
Page 14/22Figure 3
Simulated population dynamics from January 1 2020 to December 31 2021. (a) Susceptible individuals, original population
and those who lost their immunity acquired either from an infection or vaccination. (b) Vaccinated with only one dose, with
either Pfizer (PZ) or AstraZeneca (AZ). (c) Fully vaccinated. (d) Symptomatic infections of susceptible individuals. (e)
Symptomatic infections of vaccinated or recovered individuals. Asymptomatic infections of (g) susceptible or vaccinated
individuals and (h) recovered individuals. (i) Predicted fraction of population being susceptible (original or after losing
immunity), vaccinated (one or two doses), recovered, and infections (symptomatic or asymptomatic).
Page 15/22Figure 4
Sensitivity of model predictions, measured by total infections and deaths, to variations in model parameter values, in a one-
year simulation (2020) of wild-type viral dynamics. Parameters examined include virus infectivity (β), ratio of
asymptomatic versus symptomatic infections (σ), degree of increased infectivity β (due to mobility) of asymptomatic
infected individuals compared to symptomatic ones, mortality rate of infected individuals (μI), disease recovery rate (γ),
vaccine escape rate (βV), NPI stringency (λ), dosing interval (ω2), vaccination rate (ω1). Asterisk (*) denote parameters that
were varied by 50%; other parameters were varied by 5%. Red bar, parameter value increased; blue bar, decreased.
Page 16/22Figure 5
Predicted number of COVID-19 infections when some of the other variants are not in play. Results suggest that wild type
limits the spread of Alpha; wild type and Alpha together limit Delta.
Page 17/22Figure 6
Predicted spread of the Delta variant, from March 2021 to March 2022, obtained for baseline parameters and three
alternative scenarios. “PZ/AZ,” lower fraction of vaccines being Pfizer (from 95% to 40%), with the reduction made up with
AstraZeneca, which offers reduced protection from Delta infections and a longer dosing delay. “Vac rate,” vaccination rate
reduced by 20%. “NPI”, less stringent lockdown measured, with motility increased by 25%. Among these scenarios
considered, Delta outbreak is the most severe when the majority of the vaccines are AstraZeneca.
Page 18/22Figure 7
Number of different types of Delta infections: total symptomatic and asymptomatic infections, and those of vaccinated
individuals. In all four scenarios, asymptomatic patients and vaccinated patients account for a significant fraction of the
disease carriers.
Page 19/22Figure 8
Dynamics of hypothetical VOC (“Neos”), simulated from August 1 2021 to June 31 2022. (a) Susceptible individuals,
original population and those who lost their immunity acquired either from an infection or vaccination. (b) Vaccinated with
only one dose or both, with either Pfizer (PZ) or AstraZeneca (AZ). (c) New infections per day (Neos, Alpha, Delta) since
August 1 2021. (d) New symptomatic infections since August 1 2021. (e) New asymptomatic infections since August 1
2021. (f) Cumulative infections since August 1 2021. (g) Cumulative deaths from Neos, Alpha, and Delta. (h) Total number
of individuals having recovered from Neos, Alpha, and Delta infections. (i) Fraction of population being susceptible,
vaccinated (one or two doses), recovered, and infections (symptomatic or asymptomatic).
Page 20/22Figure 9
Predicted spread of hypothetical VOC “Neos,” shown from August 1 2021 to June 31 2022. Results are obtained for
baseline parameters and three alternative scenarios. “PZ/AZ,” lower fraction of vaccines being Pfizer (from 95% to 40%),
with the reduction made up with AstraZeneca, which offers reduced protection from Delta infections and a longer dosing
delay. “Vac rate,” vaccination rate reduced by 20%. “NPI”, less stringent lockdown measured, with motility increased by 25%.
(c) Total number of vaccinated individuals infected with Neos.
Page 21/22Figure 10
Predicted spread of hypothetical VOC “Neos,” shown from August 1 2021 to June 31 2022. Results are obtained for three
scenarios: (a1) more stringent NPI, with motility decreased further by 40% starting September 1 2021; (b1) a third vaccine
booster that offers twice the protection of two doses; (c1) a combination of NPI and vaccine booster. Analogous
simulations are then conducted with 60% of the vaccines being AstraZeneca instead of 5% (a2) to (c2). Only by combining
pharmaceutical and NPI can the spread of Neos be stopped.
Supplementary Files
This is a list of supplementary files associated with this preprint. Click to download.
parameters.docx
Page 22/22You can also read


