Modelling of HIV prevention and treatment progress in five South African metropolitan districts - Nature
←
→
Page content transcription
If your browser does not render page correctly, please read the page content below
www.nature.com/scientificreports
OPEN Modelling of HIV prevention
and treatment progress in five
South African metropolitan
districts
Cari van Schalkwyk1*, Rob E. Dorrington2, Thapelo Seatlhodi3,4, Claudia Velasquez5,
Ali Feizzadeh5 & Leigh F. Johnson3
Globally, large proportions of HIV-positive populations live in cities. The Fast-Track cities project aims
to advance progress toward elimination of HIV as a public health threat by accelerating the response
in cities across the world. This study applies a well-established HIV transmission model to provide key
HIV estimates for the five largest metropolitan districts in South Africa (SA): Cape Town, Ekurhuleni,
eThekwini, Johannesburg and Tshwane. We calibrate the model to metro-specific data sources and
estimate progress toward the 90-90-90 targets set by UNAIDS (90% of people living with HIV (PLHIV)
diagnosed, 90% of those diagnosed on antiretroviral therapy (ART) and viral suppression in 90%
of those on ART). We use the model to predict progress towards similarly defined 95-95-95 targets
in 2030. In SA, 90.5% of PLHIV were diagnosed in 2018, with metro estimates ranging from 86% in
Johannesburg to 92% in eThekwini. However, only 68.4% of HIV-diagnosed individuals nationally were
on ART in 2018, with the proportion ranging from 56% in Tshwane to 73% in eThekwini. Fractions of
ART users who were virally suppressed ranged from 77% in Ekurhuleni to 91% in eThekwini, compared
to 86% in the whole country. All five metros are making good progress to reach diagnosis targets and
all (with the exception of Ekurhuleni) are expected to reach viral suppression targets in 2020. However,
the metros and South Africa face severe challenges in reaching the 90% ART treatment target.
The HIV/AIDS epidemic in sub-Saharan Africa is characterized by extreme geospatial variation in HIV
prevalence1–3. Understanding this variation is critical to developing cost-effective, geographically-targeted
interventions3,4 and to understanding the drivers of local e pidemics5,6. In many sub-Saharan African countries,
HIV prevalence is substantially higher in urban areas than in rural areas, which is thought to be a reflection of
greater opportunities for sexual networking in urban c entres7. Cities tend to attract high numbers of migrants,
and migration is strongly associated with increased HIV risk8–10. Rates of migration are highest in young adults
and men11, and the age and sex profile of city populations is therefore very different from that in rural areas. The
high male-to-female ratios in cities are associated with higher levels of commercial sex activity, which may be
important in driving high rates of HIV transmission12–14. Cities are often perceived to be less homophobic social
environments15, and may therefore also have higher levels of same-sex activity. Given the rapid urbanization
that is occurring in many African countries, the high levels of HIV transmission in metropolitan settings and
the concentration of ‘key populations’ (sex workers, men who have sex with men and people who inject drugs)
in urban centres, cities are increasingly being recognized as critical to the success of the HIV response.
In light of this, the Joint United Nations Programme on HIV/AIDS (UNAIDS) and partners launched the
Paris Declaration on Fast-Track Cities Ending the AIDS Epidemic on World AIDS day in 2 01416. On this day,
the mayors of 26 cities committed to the Paris declaration and since 2014, more than 300 cities have joined. The
90-90-90 target set out in this declaration implied that 90% of people living with HIV (PLHIV) should know
their status, 90% of diagnosed individuals should receive antiretroviral therapy (ART) and 90% of those who
receive ART should be virally suppressed by 2020.
1
The South African DSI‑NRF Centre of Excellence in Epidemiological Modelling and Analysis, University of
Stellenbosch, Stellenbosch, South Africa. 2Centre for Actuarial Research, University of Cape Town, Cape Town,
South Africa. 3Centre for Infectious Disease Epidemiology and Research, University of Cape Town, Cape Town,
South Africa. 4National Department of Health, Pretoria, South Africa. 5UNAIDS Country Office, Midrand, South
Africa. *email: carivs@sun.ac.za
Scientific Reports | (2021) 11:5652 | https://doi.org/10.1038/s41598-021-85154-0 1
Vol.:(0123456789)
www.nature.com/scientificreports/
Some components of these targets are not simple to measure using surveillance or study data, and models have
been used to estimate progress toward these targets at different scales17. However, at the city level, few studies
have used transmission models to estimate progress18,19. Stuart et al.18 applied the Optima model20 to estimate
progress towards and the impact of achieving the Fast-track targets in Johannesburg. The Spectrum model has
been developed to provide estimates of some key HIV estimates at smaller s cales21, but estimates at district levels
are not based on dynamic transmission modelling, and rely instead on proportional disaggregation of provincial
estimates (usually in proportion to population size). In addition, the Naomi model, which is currently being
used to inform district-level planning in South Africa, is not a dynamic transmission model, but uses district-
specific HIV prevalence and programme data to produce estimates for recent years and short-term projections22.
The lack of dynamic transmission modelling in the Spectrum and Naomi district approaches means that they
are not able to assess the impact of HIV prevention and treatment programmes on HIV incidence, or to make
longer term projections.
South Africa has the largest HIV epidemic in the world, with an estimated 7.7 million people living with HIV
in 201817. The country has seen steady urbanization over the last three decades, with the fraction of the popula-
tion residing in urban areas increasing from around 50% in 1 98523 to 61.3% in 2 01824. During the apartheid era,
restrictions on population movement prevented black South Africans from settling permanently in ‘white’ urban
centres, thus perpetuating a system of circular migration between urban and rural areas. In the post-apartheid era
restrictions on population movement were lifted, but the pattern of circular urban–rural migration has persisted.
The HIV epidemic in South Africa began in urban centres in the late 1980s, and early studies noted a substantially
higher HIV prevalence in urban areas than in rural areas25,26. However, high rates of circular migration ensured
a rapid transfer of HIV from urban to rural areas, and by the late 1990s and early 2000s, HIV prevalence levels
were similar in urban and rural a reas27–29. However, these crude comparisons have not controlled for age and sex
differences between urban and rural areas, which could obscure the true extent of the urban–rural difference. To
date, most studies of geographical variation in HIV prevalence in South Africa have focused on inter-provincial
differences6,30–33, with few attempts to characterize differences between rural and urban, or between cities and
smaller urban centres34,35. The same is true of studies of geographical variation in the coverage of ART and HIV
prevention services30,36,37. The US-funded President’s Emergency Plan for AIDS Relief (PEPFAR) has prioritized
HIV interventions in the 27 health districts that have the largest HIV-positive populations, which include the
major metropolitan districts. Given the large fraction of the HIV-positive population in the metros, and the
extent of the resulting HIV expenditure, it is important that the size of the HIV burden and performance of HIV
programmes in these metropolitan districts be accurately quantified.
In this study, the Thembisa m odel36 is applied to provide HIV estimates and evaluate intervention impact
in the five largest metropolitan districts of South Africa: Cape Town, Ekurhuleni (formerly known as the East
Rand), eThekwini (Durban), Johannesburg and Tshwane (Pretoria). We use the model to estimate progress
toward the 90-90-90 targets, as well as progress in HIV prevention. We predict progress toward 2030 targets, if
interventions are maintained at current levels. Results are compared against corresponding estimates for South
Africa as a whole.
Methods
The Thembisa model. The Thembisa model simulates the population demographics and HIV epidemic of
South Africa and its provinces and has been used for a number of purposes. The model provides estimates at the
national and provincial level, and the methodology of the model at both scales is described in detail in technical
documents available for download at www.thembisa.org. The model stratifies the population by age, sex, risk
group (the ‘high-risk’ group representing individuals with a propensity for commercial sex and/or concurrent
partners), marital status, sexual experience and uptake of HIV prevention methods (condom use, male circum-
cision and pre-exposure prophylaxis). In addition, all adults are classified according to their HIV testing history
(never tested, ever tested and ever diagnosed positive), CD4 count, initiation of ART and ART duration. The use
of a wide range of different data sources in the model calibration, and the extensive validation of the model, make
it the most reliable and informative model for assessing the impact of HIV in South Africa.
For this study, the Thembisa 4.2 model (the most recent version at the time this study was performed) was
adapted to provide estimates at the metro level, with age- and sex-specific population size reconstructed to be
consistent with estimates from the 2011 census allowing for migration projected from estimates of past migra-
tion from questions on migration in that census. With the exception of eThekwini, rates of fertility, non-HIV
mortality, marriage and divorce are assumed to be the same as that of the province of the metro. In the case of
eThekwini, the fertility rates were sufficiently different from the provincial rates as to require the use of metro-
specific fertility rates.
The model allows for differences between metros in the uptake of traditional male circumcision and the
rollout of HIV prevention and treatment services such as uptake of HIV testing, ART, prevention of mother-to-
child transmission and medical male circumcision (MMC). To inform differences between metros, the model
makes use of routinely reported data, as shown in the supplementary material. A Bayesian approach was adopted
to fit the model to metro-specific HIV prevalence data obtained from antenatal prevalence surveys, and five
general population prevalence surveys—the Human Sciences Research Council (HSRC) surveys of 2005, 2008,
2012 and 2017 and the Demographic and Health Survey (DHS) of 2016. Age-specific antenatal clinic (ANC)
prevalence estimates at the metro-level are not published in the reports and therefore we did not estimate age
patterns of sexual activity, but have instead used the age-specific patterns of sexual activity previously estimated
at the provincial level.
We allowed for uncertainty in the following parameters: (1) the fraction of adults in the high -risk group,
(2) the level of sexual mixing between high- and low-risk groups, (3) the rate of early condom use relative to
Scientific Reports | (2021) 11:5652 | https://doi.org/10.1038/s41598-021-85154-0 2
Vol:.(1234567890)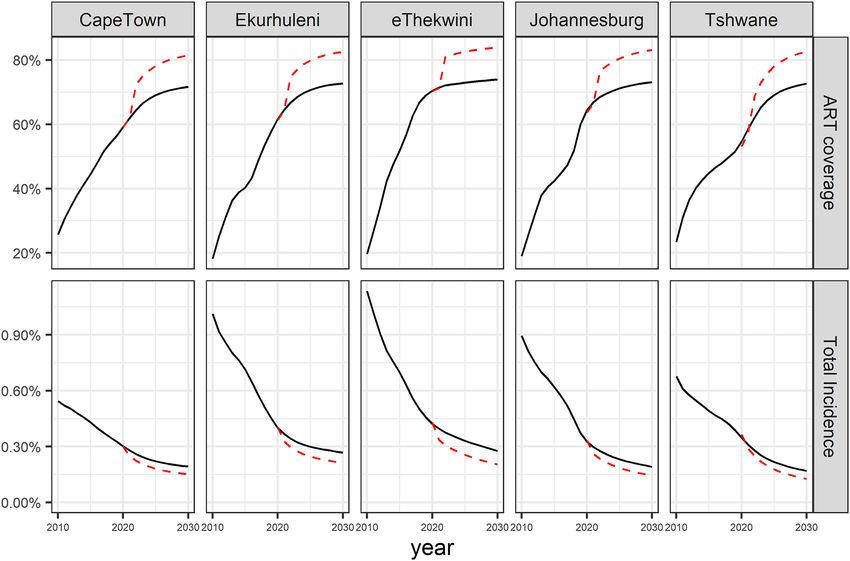
www.nature.com/scientificreports/
national levels, (4) changes in condom use, (5) the initial HIV prevalence in high-risk women and (6) the bias
in the antenatal survey data. The prior distributions for the first five parameters were the same as assumed previ-
ously at the provincial l evel38. A major source of antenatal bias is the inclusion of only public sector clinics in the
survey, and therefore the prior distribution of this parameter is a function of the fraction of the population of the
metro covered by medical aid (i.e. access to private healthcare). Prior distributions are summarised in Table S7.
Estimating the first 90. In the model, PLHIV can be diagnosed in antenatal clinics, when presenting with
opportunistic infections, or through other testing services. Testing depends on age, sex, stage of HIV infec-
tion and previous testing history. Metro-specific fractions of women tested during pregnancy over time were
obtained from District Health Barometer reports39. The method of estimating the number of PLHIV who have
been diagnosed is described in a previous publication40 and the metro-level testing data are described in the
supplementary material.
Estimating the second 90. Yearly ART initiations are estimated using Bayesian B-splines36. Coefficients
of the splines are calibrated by comparing numbers of current ART users in the model to metro-level data. These
monthly numbers were obtained from the District Health Information System (DHIS) for April 2012 to Sep-
tember 2018. Private sector use of ART was not available at the metro-level at the time of this analysis, and we
make the assumption that the ratio of public-to-private ART use is the same as at the provincial level to inflate
the public sector numbers. These derived numbers (up to September 2018) are in line with private sector data in
2019, and make up a small proportion of total ART use. As numbers of current ART users prior to April 2012
are not reliable at metropolitan district level, these numbers were approximated by applying the average ratio of
metro-to-province numbers (in the period after April 2012) to the provincial numbers before April 2012.
Estimating the third 90. The fraction of people on ART who are virally suppressed, as reported by ART
programmes, may be biased due to missing data for a substantial fraction of ART patients. For the national and
provincial models, a regression model was developed that estimates the ‘true’ viral suppression as a function of
time, the fraction of ART patients that was tested, and the province. National and provincial data from the ART
programme (DHIS) and the National Health Laboratory Service were used. For this study, we added metro-level
data to the regression model. More details on the regression model are provided e lsewhere38.
Analysis. In addition to the targets above, we calculate the ratio of adult males to females, and the depend-
ency ratio—defined as the ratio of dependents (children and adults aged > 65) to working age adults—in South
Africa and each metro. We also calculate the reduction in new HIV infections between 2010 and 2018 to meas-
ure progress towards the target of a 75% reduction by 2020 and 90% reduction by 203041.
The demographic profiles in cities are different to South Africa as a whole. In order to compare the metro-level
estimates to the national-level estimates, we account for the demographic differences by standardising estimates
to the age and sex distribution of the country as a whole. When estimating future levels of progress towards tar-
gets, we assume that all current interventions will be maintained, with future rates of intervention uptake equal
to the average over the last 5 years for which data are available. South Africa started prescribing dolutegravir as
a first-line regimen at the end of 2019, and we model the effect as an increase in viral suppression among those
who use this d rug42. In a sensitivity analysis, we investigate the impact of halving the rate of ART interruption/
drop-out from 2021 onwards.
Ethics. This mathematical modelling study used aggregated surveillance data, and approval from an institu-
tional review board was not necessary.
Results
The model estimates of HIV prevalence and ART enrolment are generally consistent with the data (Fig. 1). Pos-
terior distributions of the parameters that were varied in this calibration are shown in Table S7. In 2018, South
Africa had an estimated population size of 57.3 million people, with 38.0% of this population living in the five
metros in our study (Table 1). In all five metros, the adult male-to-female ratio was higher than in the country
as a whole and the ratios of dependents to working age adults were lower than in the country as a whole. HIV
prevalence in the reproductive age groups and overall was lower in Cape Town and Tshwane than in the country
as a whole, but higher in eThekwini and Ekurhuleni, and similar in Johannesburg. When adjusting estimates to
match age and sex distributions to those of the country, prevalence estimates were consistently lower than before
adjustment, reflecting the greater concentration of young adults in the metropolitan districts.
Incidence follow a similar pattern to prevalence when compared to the national estimate, with highest inci-
dence in Ekurhuleni and eThekwini. The greatest reduction in total HIV incidence between 2010 and 2018 was
estimated for eThekwini (57.2%, Table 1) and the lowest reduction in Cape Town (34.0%). In 2018, 92.0% of
PLHIV in eThekwini were diagnosed and therefore this metro reached the first 90% target (Table 2). The other
metros lagged slightly behind the national average of 90.5%, with Tshwane having the lowest fraction of diag-
nosed PLHIV, at 87.2%. Progress toward reaching the second 90% target in South Africa was low, with only 68.4%
of diagnosed PLHIV enrolled on ART. Cape Town, Ekurhuleni and Johannesburg lagged behind at only ~ 60%
of PLHIV enrolled on ART, and Tshwane was even lower at 56.2%. In Cape Town and eThekwini, just over 90%
of people enrolled on treatment were virally suppressed, with Tshwane slightly lower at 89%, Johannesburg at
84.3% and Ekurhuleni at 77.2%. eThekwini has made the best progress in terms of the fraction of its PLHIV
Scientific Reports | (2021) 11:5652 | https://doi.org/10.1038/s41598-021-85154-0 3
Vol.:(0123456789)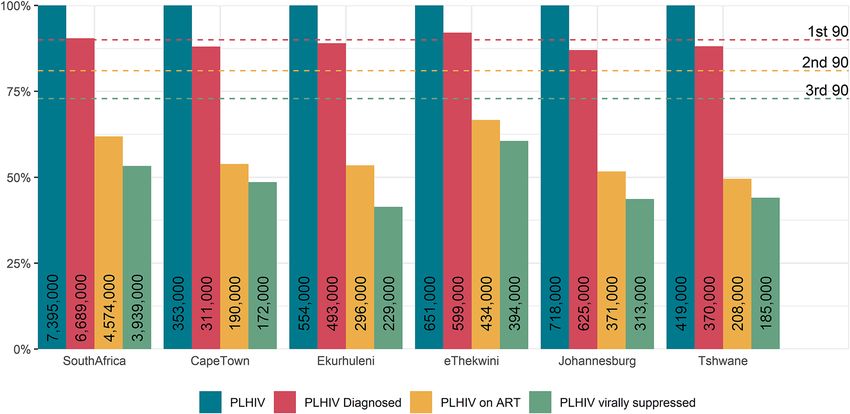
www.nature.com/scientificreports/

                                            Figure 1.  Model fits to HIV prevalence and ART enrolment data. In the left panel, dots with error bars
                                            represent survey data, and lines with shading represent the model average and 95% confidence interval. In
                                            the right panel, dots represent the reported number of clients enrolled on ART, and the red line the current
                                            enrolment in the model.

          Scientific Reports |   (2021) 11:5652 |                https://doi.org/10.1038/s41598-021-85154-0                                                4

Vol:.(1234567890)
www.nature.com/scientificreports/
South
Africa Cape Town Ekurhuleni eThekwini Johannesburg Tshwane
Standardised Standardised Standardised Standardised Standardised
Indicator Estimate Estimate Estimate Estimate Estimate Estimate Estimate Estimate Estimate Estimate Estimate
Total popu-
lation (in 57.3 4.32 3.91 3.86 5.58 4.1
millions)
Adult male
to female 0.92 0.94 1.05 0.94 0.98 0.99
ratio (15 +)
Ratio of
dependents
(children
and adults 0.52 0.46 0.47 0.45 0.43 0.43
aged > 65) to
working age
adults
Prevalence 12.9 14.2 13.1 16.8 15.9 12.9 10.2
8.2 (6.9–9.4) 7.5 (6.4–8.7) 11.3 (10–12.4) 9.3 (7.7–10.5)
(total) (%) (12.4–13.3) (12.9–15.4) (11.8–14.3) (15.2–18.5) (14.3–17.5) (11.5–14.1) (8.6–11.5)
Prevalence 18.9 11.8 20.4 19.2 23.8 23.5 18.1 16.4 14.3 13.5
11.2 (9.4–13)
(15–49) (%) (18.2–19.6) (10–13.7) (18.5–22.2) (17.3–20.9) (21.8–25.9) (21.4–25.7) (16.2–19.8) (14.7–18.1) (12.3–16.2) (11.5–15.4)
Incidence 0.44 0.35 0.33 0.51 0.5 (0.39– 0.5 0.49 0.45 0.41 0.42
0.39 (0.28–0.5)
(total) (%) (0.4–0.48) (0.24–0.46) (0.23–0.44) (0.4–0.62) 0.61) (0.4–0.63) (0.39–0.62) (0.36–0.54) (0.32–0.49) (0.3–0.53)
Incidence 0.76 0.59 0.59 0.84 0.87 0.84 0.85 0.71 0.7 (0.56– 0.67 0.67
(15–49) (%) (0.69–0.83) (0.4–0.79) (0.4–0.78) (0.66–1.03) (0.68–1.06) (0.67–1.05) (0.68–1.06) (0.56–0.85) 0.84) (0.47–0.84) (0.47–0.85)
Reduction
in total
48.7 36 (28.9– 49.7 46.2 55.7 57.2 50.2 48.2 38 (30.4– 37.6
incidence 34 (26.8–44.3)
(46.3–51.1) 45.9) (44.1–54.2) (40.3–51.3) (50.3–60.6) (51.6–62.1) (46.2–54.3) (43.7–52.5) 46.3) (29.4–46.1)
(2010–2018)
(%)
1st 90: %
of PLHIV 90.5 88 (86.8– 87.1 88.8 92.1 86.1 88.2
89 (88–89.9) 92 (91.4–92.7) 87 (86.1–88) 87.2 (86–88.4)
who are (90–90.9) 89.4) (85.9–88.4) (87.8–89.7) (91.3–92.8) (85.1–87.1) (86.8–89.5)
diagnosed
2nd 90: % of
diagnosed 68.4 61.4 61.1 60.2 60.9 72.5 72.9 59.5 56.4 56.2
59.6 (55.5–65)
PLHIV who (66.6–70.8) (54.1–70.9) (54.3–70.9) (56.3–65.2) (57.3–65.2) (67.7–75.5) (68.1–75.5) (55.3–65) (51.3–64.7) (51.3–64.7)
are on ART
3rd 90: % of
PLHIV on
86.2 90.3 77.5 91.0 84.5 89.0
ART who
(84.1–88.3) (89.0–91.6) (72.3–82.8) (90.0–92.1) (82.5–86.6) (87.8–90.2)
are virally
suppressed
ART cover- 61.9 54.1 53.5 53.6 54.2 66.8 51.8 51.6 49.7 49.2
67 (62.4–69.7)
age (%) (60.2–64) (47.2–63.2) (47.2–61.9) (49.7–58.5) (50.6–58.8) (62–69.8) (47.8–57.1) (47.8–56.1) (44.8–57.7) (44.6–56.6)
Table 1. Demographic and HIV estimates of South Africa and its five largest metropolitan districts in 2018.
South Africa Cape Town Ekurhuleni eThekwini Johannesburg Tshwane
Progress toward 90-90-90
By 2018 91-68-86 87-61-90 89-61-78 92-73-91 86-60-85 87-56-89
By 2020 93-73-91 89-66-93 91-68-85 94-75-94 89-72-90 89-61-93
Progress toward 95-95-95
By 2030 96-78-91 94-76-94 95-76-86 97-77-94 95-77-90 95-76-93
By 2030, if ART interruption rate is halved from
97-87-91 95-85-94 96-86-86 97-86-94 96-86-90 96-86-93
2021
Reduction in incidence from 2010
By 2018 48.7% 34.0% 46.2% 57.2% 48.2% 37.6%
By 2020 (target: 75%) 58.5% 42.8% 57.0% 64.6% 61.4% 48.1%
By 2030 (target: 90%) 71.9% 61.2% 71.3% 75.5% 76.4% 73.5%
By 2030, if ART interruption rate is halved from
78.6% 69.3% 77.4% 82.2% 82.4% 81.1%
2021
Table 2. Model estimates of progress toward UNAIDS targets. Confidence intervals for these point estimates
are shown in Table 1 and Supplementary Table S8.
Scientific Reports | (2021) 11:5652 | https://doi.org/10.1038/s41598-021-85154-0 5
Vol.:(0123456789)www.nature.com/scientificreports/
Figure 2. The HIV treatment cascade in South Africa and the five metropolitan districts in 2018.
virally suppressed, at 394,000 of 651,000 (60.5%, Fig. 2). Ekurhuleni was furthest from reaching the target, with
only 229,000 of its 554,000 (41.3%) PLHIV virally suppressed.
Our models estimate that none of the five metros will achieve all of the 90-90-90 targets by 2020 or the 95-95-
95 targets by 2030 (Table 2). The model predicts that Ekurhuleni will be the worst performing metro, with only
76% of diagnosed PLHIV enrolled on treatment and only 86% of ART clients virally suppressed by 2030. None
of the metros is likely to meet the target of reducing the number of new infections in 2010 by 75% in 2020 or
90% in 2030.
Reducing the rate of ART interruption by 50% by 2021 will substantially increase the fraction of diagnosed
PLHIV who are on ART in 2030, from around 75% in all five metros to around 85% (Table 2). This will also
substantially reduce new infections. The impact of halving the ART interruption rate on ART coverage (among
adults) and total incidence is shown in Fig. 3.
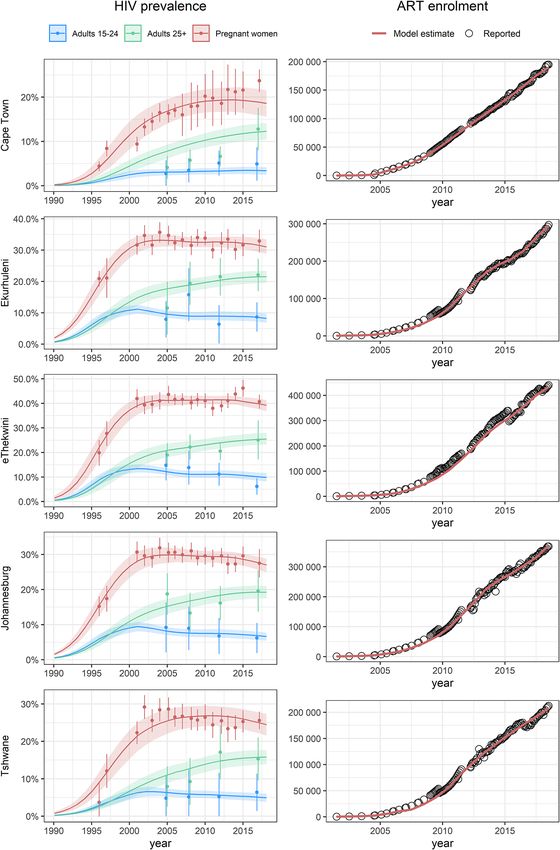
Thembisa estimates of HIV incidence and prevalence among 15–49 year olds, and adult ART coverage in 2017
are similar to the corresponding estimates from the Naomi model (Fig. 4). Only in Cape Town is the estimate of
ART coverage substantially lower and incidence substantially higher in our model than in Naomi.
Discussion
Around 38% of South Africa’s population and 36% of all people living with HIV live in the five metropolitan
districts of Cape Town, Ekurhuleni, eThekwini, Johannesburg and Tshwane. Although there are clear differences
across the metros, both in HIV prevalence and progress towards HIV targets, we do not see consistent differ-
ences when comparing these metros to the country as a whole, suggesting that urban–rural differences in HIV
epidemic drivers and HIV programmes are not as substantial as previously assumed. Despite having made the
best progress towards the UNAIDS targets (92-73-91) and showing the greatest reduction in incidence between
2010 and 2018 (57.2%), eThekwini still had a high incidence of 0.85% in the 15–49 year age group in 2018.
Ekurhuleni is making slow progress towards enrolling on and successfully treating PLWH with ART (89-61-77),
and this is reflected in the high incidence rate (0.87%) and low reduction in incidence between 2010 and 2018
(46.2%). The other two Gauteng metros are showing only slightly better progress than Ekurhuleni, at 86-60-84 in
Johannesburg and 87-56-89 in Tshwane. Although Cape Town has always had a lower HIV prevalence than the
other metros (Fig. 1) and had the lowest estimated incidence in 2018, the city had the lowest success in reducing
incidence between 2010 and 2018, with a reduction of only 34.0%. This is likely due to relatively low uptake of
MMC, lower than national levels of condom use and greater reversal of increases in condom use compared to
the other metros (Table S7).
Predictions from the model show that if rates of uptake of HIV interventions are maintained at 2018 levels,
none of the metros will meet all the 2020 or 2030 targets. By 2030, all the metros will have diagnosed near 95%
of PLHIV, and in Cape Town, eThekwini and Tshwane nearly 95% of those on ART will have achieved viral sup-
pression. The greatest challenge will be to enrol and retain on treatment those PLHIV who are diagnosed, with
predicted levels around 75% for all five metros in 2030. If we halve the rate of ART interruption from 2021, this
fraction is predicted to increase to around 85% in the five metros. Ensuring better retention of ART patients
will not only improve outcomes for PLHIV, but will also have a substantial impact on reducing new infections.
However, even under the optimistic assumption of a 50% reduction in the ART interruption rate, none of the
five metros is predicted to reduce the number of new infections in 2010 by 90% in 2030. It is critical that inter-
ventions such as same-day ART initiation, which is associated with better ART uptake after d iagnosis43,44, and
community drug dispensing and differentiated care, which are associated with better ART r etention45,46, are
strengthened and scaled up.
Scientific Reports | (2021) 11:5652 | https://doi.org/10.1038/s41598-021-85154-0 6
Vol:.(1234567890)www.nature.com/scientificreports/
Figure 3. ART coverage (among adults) and total incidence if levels of HIV prevention and care are maintained
(black lines) and if the estimated ART interruption rate is halved by 2021 (dashed red lines).
This is one of the first studies to use a dynamic transmission model to estimate progress towards the targets
of the Fast-Track Cities project. For South African cities, one previous published study used a model to estimate
progress in Johannesburg18. This study estimated that 73% of PLHIV in Johannesburg were diagnosed, 66% of
the diagnosed were receiving ART and 54% of those on ART achieved viral suppression in 2016. Our study’s cor-
responding estimates for Johannesburg in 2016 are 83-54-78. Differences may be due to the use of self-reported
knowledge of status data in Optima. Our model results are very similar to those of Naomi22, with the only notable
differences in estimates for Cape Town. Naomi incorporates household survey data on the proportion of HIV-
positive individuals with detectable antiretrovirals, which are not included in Thembisa, and this may account for
the generally higher estimates of ART coverage in Naomi. Since Cape Town’s ART coverage is higher in the Naomi
model than in our model, HIV incidence is lower. In addition, Naomi does not consider low levels of MMC and
reductions in condom use, which were more prominent in Cape Town than in the other metros in our analysis.
Ideally, routine case-based surveillance data should be used to measure progress towards targets. However,
only the Western Cape province of South Africa has implemented the use of unique patient identifiers in the
public health s ector47, and it is not possible to link patient records across health services in other provinces. Even
with well-functioning surveillance systems, models are still necessary to estimate the size of the undiagnosed
population and the HIV incidence r ate48. Our metro-level models have the advantage of building on models
that were calibrated to national and provincial data sources, and we could rely on parameters estimated at the
national/provincial level when simulating HIV dynamics in metros, where data are sparser.
However, this analysis has a number of limitations. Survey estimates that we used to calibrate our models
generally lacked precision, and metro-level age-specific ANC prevalence data were not available. For this reason,
metro-level age-specific sexual behaviour parameters were assumed to be the same as those of the province. We
assume that the HIV profile of immigrants to a metro is the same as that of current residents (after controlling
for age and sex), which may be unrealistic. We assume that the fraction of private sector ART users and private
sector HIV tests are the same at metro and provincial level, which may lead to slight underestimates in the
number of people on ART and number of HIV tests performed in the metros, if there is greater access to private
sector HIV testing and treatment in urban settings. This model does not take into account that residents of the
metro may access HIV medication and services outside the metro and vice versa, or that data for immigrants
treated outside of South Africa are not included in public sector health reporting. The model does not include
metro-specific data on HIV prevalence among female sex workers and men who have sex with men in calibration,
although these data are available for most of the metropolitan districts. In addition, the model does not consider
other key risk groups (like intravenous drug users and transgender women), which may be more common in
cities and which may contribute substantially to the HIV epidemic.
Scientific Reports | (2021) 11:5652 | https://doi.org/10.1038/s41598-021-85154-0 7
Vol.:(0123456789)www.nature.com/scientificreports/
Figure 4. A comparison of key indicators to the Naomi model in 2017.
Demographically, migration plays a major role in the population growth of metropolitan districts, but it is
probably the parameter that is most uncertain, given the very limited data on migration since the 2011 census.
The model does not take short-term fluctuations in population size (e.g. daily or weekly commuters) into account.
Fertility, non-HIV mortality and marriage/divorce rates, with the exception of eThekwini-specific fertility rates,
were assumed to be the same as those at the provincial level, which may bias our results. Our estimates do not
reflect any uncertainty in demographic parameters. We model the impact of dolutegravir as increased viral sup-
pression among people on ART, although evidence suggests that improved outcomes may be associated with
better ART retention due to fewer side e ffects49. Regardless of the mechanism, the net effect of switching to
dolutegravir is that viral suppression after ART initiation will be higher.
Scientific Reports | (2021) 11:5652 | https://doi.org/10.1038/s41598-021-85154-0 8
Vol:.(1234567890)www.nature.com/scientificreports/
Conclusion
Our results show that although the five metros are likely to reach the HIV diagnosis and viral suppression targets,
the greatest challenge will be to enrol and retain diagnosed PLHIV on ART. In addition, further innovations in
HIV prevention are necessary to meet the HIV incidence reduction targets.
Data availability
All data generated or analysed during this study are included in this published article (and its Supplementary
Information files).
Received: 20 September 2020; Accepted: 25 February 2021
References
1. Dwyer-Lindgren, L. et al. Mapping HIV prevalence in sub-Saharan Africa between 2000 and 2017. Nature 570, 189–193 (2019).
2. Meyer-Rath, G. et al. Targeting the right interventions to the right people and places. AIDS 32, 957–963 (2018).
3. McGillen, J. B., Anderson, S.-J., Dybul, M. R. & Hallett, T. B. Optimum resource allocation to reduce HIV incidence across sub-
Saharan Africa: a mathematical modelling study. Lancet HIV 3, e441–e448 (2016).
4. Anderson, S.-J. et al. Maximising the effect of combination HIV prevention through prioritisation of the people and places in
greatest need: a modelling study. Lancet 384, 249–256 (2014).
5. Orroth, K. K. et al. Understanding the differences between contrasting HIV epidemics in east and West Africa: results from a
simulation model of the Four Cities Study. Sex. Transm. Infect. 83, i5–i16 (2007).
6. Johnson, L. F., Dorrington, R. E. & Moolla, H. HIV epidemic drivers in South Africa: A model-based evaluation of factors account-
ing for inter-provincial differences in HIV prevalence and incidence trends. S. Afr. J. HIV Med. 18, 1–9 (2017).
7. Dyson, T. HIV/AIDS and urbanization. Popul. Dev. Rev. 29, 427–442 (2003).
8. Welz, T. et al. Continued very high prevalence of HIV infection in rural KwaZulu-Natal, South Africa: a population-based longi-
tudinal study. AIDS 21, 1467–1472 (2007).
9. Lurie, M. N. et al. The impact of migration on HIV-1 transmission in South Africa. Sex. Transm. Dis. 30, 149–156 (2003).
10. Abdool Karim, S. S. & Abdool Karim, Q. Changes in HIV seroprevalence in a rural black community in KwaZulu. S. Afr. Med. J.
82, 484 (1992).
11. Ginsburg, C. et al. Migration and settlement change in South Africa. S. Afr. J. Demogr. 17, 133–198 (2016).
12. de Sousa, J. D., Müller, V., Lemey, P. & Vandamme, A.-M. High GUD incidence in the early 20th century created a particularly
permissive time window for the origin and initial spread of epidemic HIV strains. PLoS ONE 5, e9936 (2010).
13. South, S. J., Trent, K. & Bose, S. India’s ‘missing women’ and men’s sexual risk behavior. Popul. Res. Policy Rev. 31, 777–795 (2012).
14. Vandepitte, J. et al. Estimates of the number of female sex workers in different regions of the world. Sex. Transm. Infect. 82, iii18–
iii25 (2006).
15. Maleke, K. et al. HIV risk and prevention among men who have sex with men in rural South Africa. Afr. J. AIDS Res. 16, 31–38
(2017).
16. UNAIDS. Cities on the Road to Success—Good Practices in the Fast-Track Cities Initiative to End AIDS. https://www.unaids.org/
en/resources/documents/2019/cities-on-the-road-to-success (2019).
17. Marsh, K. et al. Global, regional and country-level 90–90-90 estimates for 2018: assessing progress towards the 2020 target. AIDS
33, S213–S226 (2019).
18. Stuart, R. M. et al. The City of Johannesburg can end AIDS by 2030: modelling the impact of achieving the Fast-Track targets and
what it will take to get there. J. Int. AIDS Soc. 21, e25068 (2018).
19. Nosyk, B. et al. Ending the HIV epidemic in the USA: an economic modelling study in six cities. Lancet HIV 7, e491–e503 (2020).
20. Kerr, C. C. et al. Optima: a model for HIV epidemic analysis, program prioritization, and resource optimization. JAIDS J. Acquir.
Immune Defic. Syndr. 69, 365–376 (2015).
21. Stover, J. et al. Updates to the spectrum/AIM model for estimating key HIV indicators at national and subnational levels. AIDS
33, S227–S234 (2019).
22. Eaton, J., Johnson, L. F. & Meyer-Rath, G. The Naomi model: South Africa District HIV Estimates. http://www.hivdat a.org.za/ (2020).
23. Kok, P. & Collinson, M. Migration and Urbanization in South Africa. http://www.statssa.gov.za/publications/Report-03-04-02/
Report-03-04-02.pdf.
24. Statistic South Africa. General Household Survey 2018. statssa.gov.za/publications/P0318/P03182018.pdf (2019).
25. Cronje, H. S. et al. Prevalence of vaginitis, syphilis and HIV infection in women in the Orange Free State. S. Afr. Med. J. 84, 602–605
(1994).
26. Department of National Health and Population Development. NIV sentinel surveillance. Epidemiol. Comments 21, 230–231 (1994).
27. Coleman, R. L. & Wilkinson, D. Increasing HIV prevalence in a rural district of South Africa From 1992 through 1995. J. Acquir.
Immune Defic. Syndr. Hum. Retrovirol. 16, 50–53 (1997).
28. Human Sciences Research Council. South African National HIV Prevalence, Behavioural Risks and Mass Media Household Survey
2002. http://www.hsrcpress.ac.za (2002).
29. Reproductive Health Research Unit. HIV and Sexual Behaviour Among Young South Africans: A National Survey of 15–24 Year
Olds. https://pdfs.semanticscholar.org/9497/9bed2096ffff4634e76621d72da73f793588.pdf (2004).
30. Simbayi, L. et al. South African national HIV prevalence, incidence, behaviour and communication survey, 2017. Nelson Mandela
Foundation (2017).
31. Fraser-Hurt, N. et al. The HIV Epidemic in South Africa: What do We Know and how has it Changed? http://ecommons.hsrc.ac.za/
bitstream/handle/20.500.11910/3589/7038.pdf?sequence=1&isAllowed=y (2011).
32. Woldesenbet, S. et al. The 2017 National Antenatal Sentinel HIV Survey, South Africa. https://www.nicd.ac.za/wp-content/uploa
ds/2019/07/Antenatal_survey-report_24July19.pdf (2019).
33. Dorrington, R., Johnson, L. F., Bradshaw, D. & Daniel, T. The Demographic Impact of HIV/AIDS in South Africa National and
Provincial Indicators for 2006. https://www.commerce.uct.ac.za/Research_Units/CARE/RESEARCH/ReportsWorkingPapers.asp
(2006).
34. Hurt, N. F., MacLeod, W. & Kufa Chakezha, T. Fast-Tracking of the HIV Response: Do the Metros Lead the Way to Reaching
90-90-90 in South Africa? J. AIDS Clin. Res. 7, 1–8 (2016).
35. Gutreuter, S., Igumbor, E., Wabiri, N., Desai, M. & Durand, L. Improving estimates of district HIV prevalence and burden in South
Africa using small area estimation techniques. PLoS ONE 14, e0212445 (2019).
36. Johnson, L. F., Dorrington, R. E. & Moolla, H. Progress towards the 2020 targets for HIV diagnosis and antiretroviral treatment
in South Africa. South. Afr. J. HIV Med. 18, 1–9 (2017).
37. Massyn, N., Barron, P., Day, C., Ndlovu, N. & Padarath, A. District Health Barometer 2018/19. Health Systems Trust vol. 53 (2020).
38. Johnson, L. F. & Dorrington, R. E. Modelling the Impact of HIV in South Africa’s Provinces: 2019 Update. www.thembi sa.org (2019).
Scientific Reports | (2021) 11:5652 | https://doi.org/10.1038/s41598-021-85154-0 9
Vol.:(0123456789)www.nature.com/scientificreports/
39. Massyn, N. et al. District Health Barometer 2011/12. (2013).
40. Johnson, L. F., Rehle, T. M., Jooste, S. & Bekker, L.-G. Rates of HIV testing and diagnosis in South Africa: successes and challenges.
AIDS 29, 1401–1409 (2015).
41. UNAIDS. Fast-Track—Ending the AIDS Epidemic by 2030. https: //www.unaids .org/sites/ defaul t/files/ media_ asset/ 201409 25_Fast_
Track_Brochure.pdf (2014).
42. Kanters, S. et al. Comparative efficacy and safety of first-line antiretroviral therapy for the treatment of HIV infection: a systematic
review and network meta-analysis. Lancet HIV 3, e510–e520 (2016).
43. Labhardt, N. D. et al. Effect of offering same-day ART vs usual health facility referral during home-based HIV testing on linkage
to care and viral suppression among adults with HIV in Lesotho: the CASCADE randomized clinical trial. JAMA 319, 1103–1112
(2018).
44. Rosen, S. et al. Initiating antiretroviral therapy for HIV at a patient’s first clinic visit: the RapIT randomized controlled trial. PLoS
Med. 13, e1002015 (2016).
45. Fatti, G. et al. The effectiveness and cost-effectiveness of community-based support for adolescents receiving antiretroviral treat-
ment: an operational research study in South Africa. J. Int. AIDS Soc. 21(Suppl 1), e25041 (2018).
46. Luque-Fernandez, M. A. et al. Effectiveness of patient adherence groups as a model of care for stable patients on antiretroviral
therapy in Khayelitsha, Cape Town, South Africa. PLoS ONE 8, e56088 (2013).
47. Boulle, A. et al. Data centre profile: the provincial health data centre of the Western Cape Province, South Africa. Int. J. Popul.
Data Sci. 4, 1143 (2019).
48. Mahiane, S. G., Marsh, K., Glaubius, R. & Eaton, J. W. Estimating and projecting the number of new HIV diagnoses and incidence
in Spectrum’s case surveillance and vital registration tool. AIDS 33, S245–S253 (2019).
49. Venter, W. D. F. et al. Dolutegravir with emtricitabine and tenofovir alafenamide or tenofovir disoproxil fumarate versus efavirenz,
emtricitabine, and tenofovir disoproxil fumarate for initial treatment of HIV-1 infection (ADVANCE): week 96 results from a
randomised, phase 3, n. Lancet HIV 7, e666–e676 (2020).
Acknowledgements
The authors gratefully acknowledge the Centre for High Performance Computing (CHPC), South Africa, for
providing computational resources to this project.
Author contributions
C.v.S.: Applied the model, performed analysis, wrote first draft of the manuscript. R.E.D.: Estimated demographic
indicators. T.S.: assisted with data curation. C.V. and A.F.: initiated the project. L.F.J.: Developed the model. All
authors revised the manuscript and agreed on final version.
Competing interests
The authors declare no competing interests.
Additional information
Supplementary Information The online version contains supplementary material available at https://doi.
org/10.1038/s41598-021-85154-0.
Correspondence and requests for materials should be addressed to C.S.
Reprints and permissions information is available at www.nature.com/reprints.
Publisher’s note Springer Nature remains neutral with regard to jurisdictional claims in published maps and
institutional affiliations.
Open Access This article is licensed under a Creative Commons Attribution 4.0 International
License, which permits use, sharing, adaptation, distribution and reproduction in any medium or
format, as long as you give appropriate credit to the original author(s) and the source, provide a link to the
Creative Commons licence, and indicate if changes were made. The images or other third party material in this
article are included in the article’s Creative Commons licence, unless indicated otherwise in a credit line to the
material. If material is not included in the article’s Creative Commons licence and your intended use is not
permitted by statutory regulation or exceeds the permitted use, you will need to obtain permission directly from
the copyright holder. To view a copy of this licence, visit http://creativecommons.org/licenses/by/4.0/.
© The Author(s) 2021
Scientific Reports | (2021) 11:5652 | https://doi.org/10.1038/s41598-021-85154-0 10
Vol:.(1234567890)You can also read