Assessment of Meteorological Drought and Wet Conditions Using Two Drought Indices Across KwaZulu-Natal Province, South Africa - MDPI
←
→
Page content transcription
If your browser does not render page correctly, please read the page content below

atmosphere
Article
Assessment of Meteorological Drought and Wet
Conditions Using Two Drought Indices Across
KwaZulu-Natal Province, South Africa
Minenhle Siphesihle Ndlovu 1,2 and Molla Demlie 1, *
 1   School of Agricultural, Earth and Environmental Sciences, University of KwaZulu-Natal, Westville Campus,
     Private Bag 54001, Durban 4000, South Africa; ndlovusiphesihle70@gmail.com
 2   GCS Water and Environmental Consultants, 4a old Main Road, Judges Walk, Kloof,
     KwaZulu-Natal 3610, South Africa
 *   Correspondence: demliem@ukzn.ac.za

 Received: 7 April 2020; Accepted: 22 May 2020; Published: 12 June 2020

 Abstract: South Africa has been experiencing a series of droughts for the last few years, limiting
 the availability of water supply in reservoirs and impacting many sectors of the economy. These
 droughts have affected even the wetter eastern provinces including KwaZulu-Natal. This paper
 presents the results of analyses and assessment of meteorological drought across KwaZulu-Natal
 (KZN) Province of South Africa using two drought indices. The main objective of the study is to
 understand the changes in rainfall patterns for a period of 48 years (i.e., 1970 to 2017) and identify
 wet and dry years. The percent of normal precipitation index (PNPI) and rainfall anomaly index
 (RAI) were used to explore and categorize the wet and dry periods at 18 selected rainfall gauging
 stations across the province. Mann–Kendall statistics and Sen’s slope were employed on the indices
 to further understand the trend of drought conditions. The results revealed that 1992 and 2014/15
 were the most extremely dry years with 2015 being the driest year over the studied period induced
 by El Niño. The extremely wet periods were 1987, 1996, and 2000 which have been associated
 with cyclonic events. Droughts have become more frequent and intense, while wet conditions are
 less frequent. The drought condition was observed not to be peculiar to one region and to vary
 from year-to-year. These variations have been associated with global climate drivers including El
 Niño-southern oscillation (ENSO) and sea surface temperature (SST) conditions. The northern region
 around Magudu, Hlobane, Vryheid and Dundee were relatively the most affected during periods of
 extreme drought conditions. Comparative analysis showed that RAI is more robust than PNPI in
 understanding drought conditions. Thus, it can be applied effectively in Southern Africa in analyzing
 dry and wet conditions.

 Keywords: drought indices; ENSO; meteorological drought; rainfall anomaly index; KwaZulu-Natal;
 percent of normal precipitation index; South Africa

1. Introduction
     South Africa is a semi-arid country characterized by spatial and temporal variability of rainfall [1]
and is considered a water-stressed country. Its average annual rainfall is less than 500 mm/year, which
is below the world average of about 860 mm/year. In recent decades, the rainfall of the region has
become unpredictable and extremes in the form of droughts and floods are not uncommon. Drought
is the most complex natural hazard and is often defined as the temporary meteorological event that
stems from the shortage of precipitation over an extended period of time compared to a long term
average condition [2]. The Department of Water and sanitation [3,4] reported that the 2015 rainfall
across the country was below normal. These extreme conditions that caused severe summer drought

Atmosphere 2020, 11, 623; doi:10.3390/atmos11060623                          www.mdpi.com/journal/atmosphere
Atmosphere 2020, 11, 623                                                                            2 of 20

and rainfall variability in South Africa tend to occur due to regional processes such as El Niño and
sea surface temperature (SST) conditions. The El Niño-southern oscillation (ENSO) is known to
influence rainfall in most parts of the southern African regions with the negative phase being associated
with drought conditions and the positive phase associated with above average rainfall [5–8]. This is
characterized by low pressure anomalies coupled with cyclonic circulation [9]. Sea surface temperature
variations in the Indian Ocean influence the atmospheric dynamics and moisture supply over Southern
Africa [10–13]. According to [14] the Indian Ocean SST anomalies could shift atmospheric convection
and rainfall eastwards during El Niño events. Based on climate projections, [15] reported that the most
severe drought impacts are likely to occur in the western part of South Africa, where small towns
and subsistence farmers are more vulnerable. For instance, in 2017 the Western Cape Province of
South Africa experienced the worst water shortage in 113 years and was declared by the government
as a disaster region [16]. Drought generally affects wider areas and more people than any other
natural disaster [17–19] and has considerable impacts on the various sectors of the economy including
agriculture. The consequences of which depends on social vulnerability at the time in which the
drought occurs [20].
      Wilhite, D.A. et al. in [21,22] classified drought into four types, namely, meteorological,
hydrological, agricultural and socio-economic droughts. Meteorological drought occurs when
precipitation is less than normal and is characterized by changes in weather patterns. Increased
temperature, evapotranspiration and solar radiation, and decrease in humidity and cloudiness are the
first indicators of drought occurrence [2,19].
      Various approaches have been followed to study drought. One of these methods is using
drought indices (DI) as they explain the cumulative effects of a prolonged and abnormal moisture
deficiency [23,24]. Numerous indices have been developed for studying drought, while none has
inherent priority over others, some have better performance in specific conditions [20].
      The most extensively used drought indices for water resource management, monitoring, and
drought prediction include, but are not limited to Palmer drought severity index [25], surface water
supply index [26], standardized precipitation index (SPI) [27], percentage of normal precipitation index
(PNPI) [28], rainfall anomaly index (RAI) [29] and crop specific drought index [30]. The SPI is based
on the probability of rainfall for any time scale (yearly, seasonally, and monthly) and its calculation
is dependent on the distribution of rainfall over longer periods of time of more than 50 years [27].
The PNPI is the rainfall average calculated over at least a 30-year period [28]. The number of years
described above are recommendations on having enough data and thus are not requirements in the
calculations of drought indices. The RAI, developed by [29], is another index for studying drought
severity and is based on the calculated precipitation against random values [31] and have been applied
in various studies. The Mann–Kendall trend test and Sen’s slope have been used successfully in
analysis the statistical variation, distribution and frequency of drought indices [32,33]. The aim of this
paper is to characterize and understand the changes in rainfall patterns, frequency, severity, spatial
and temporal distribution of meteorological drought and wet conditions across the KZN province of
South Africa using PNPI and RAI drought indices. In light of the recurrent dry spells across Southern
Africa in general and South Africa in particular, analyses and assessment of meteorological drought is
critical in making informed decisions for better management of the ever-meager water resources and
to proactively develop future water supply and allocation strategies.

2. Description of the Study Area

2.1. Location and Physiography
     KZN province is located in eastern South Africa and shares borders with Eastern Cape, Free State
and Mpumalanga provinces as well as the kingdoms of Lesotho, Swaziland and the state of Mozambique
(Figure 1). According to Statistics South Africa [34], KZN has a population of about 10.3 million and
a surface area of about 93,350 km2 . The topography of the province varies from the interior to the
2.1. Location and Physiography
KZN province is located in eastern South Africa and shares borders with Eastern Cape, Free
State and Mpumalanga provinces as well as the kingdoms of Lesotho, Swaziland and the state of
Atmosphere 2020, 11, 623 3 of 20
Mozambique (Figure 1). According to Statistics South Africa [35], KZN has a population of about 10.3
million and a surface area of about 93,350 km2. The topography of the province varies from the
interior to the1).
coast (Figure coast
The(Figure
altitude1). The altitude
ranges from 3448ranges frommean
m above 3448 sea
m above mean along
level (amsl) sea level
the (amsl) along
Drakensberg
the Drakensberg
escarpment escarpment
in the west in the west
to low mountains to midlands,
in the low mountains
highly in the midlands,
dissected, highly
undulating hills dissected,
and drops
undulating
to sea level hills
at theand drops to sea level at the coast.
coast.
Figure
Figure 1.
1. Location
Location map
map of
of the
the study
study area
area along
along with
with digital
digital elevation
elevation model
model indicating
indicating variations
variations in
in
topography
topography (elevation
(elevation data
data from
from [36]).
[35]).
2.2. Climate
2.2. Climateand
andRegional
RegionalMoisture
Moisture Sources
Sources
KZN has
KZN has aa subtropical
subtropical climate,
climate, where
where dry
dry and
and cold
cold winter
winter occurs
occurs from
from April
April to to August
August andand hot
hot
and humid summer occurs from September to March which is the main
and humid summer occurs from September to March which is the main rainy season. In summer, rainy season. In summer,
mean temperatures
temperatures oftenoften rise
rise above
above 25 ◦ C and in winter, the mean temperature drops to an average
25 °C
mean and in winter, the mean temperature drops to an average
of about 20 ◦ C. Coastal areas around Richards Bay and
and Durban
Durban receive
receive mean
mean annual
annual precipitation
precipitation
of about 20 °C. Coastal areas around Richards Bay
(MAP) of
(MAP) of about
about 1193
1193 and
and 964
964mm/year,
mm/year, respectively.
respectively. TheThe midlands
midlands of of KZN
KZN around
around Pietermaritzburg
Pietermaritzburg
and the north-western part of the province, around Newcastle, receive
and the north-western part of the province, around Newcastle, receive a MAP of about 813 a MAP of about 813 mm/year
mm/year
and 847 mm/year, respectively. While the south-eastern coastal areas,
and 847 mm/year, respectively. While the south-eastern coastal areas, around Margate receive around Margate receive
1382
1382 mm/year.
mm/year. The wide Thevariability
wide variability of climatic
of climatic conditionsconditions in the province
in the province is a resultisofa the
result of variation
large the large
variation
in in physiographic
physiographic features.
features. The The province’s
province’s rainfall israinfall is controlled
controlled by the position
by the position of SouthofIndian
South Ocean
Indian
Ocean and
ENSO ENSO and
SST. SST.
The Thesource
main main source of moisture
of moisture to thetoregion
the region
is theisSouth-western
the South-western Indian Indian Ocean,
Ocean, the
the western
western tropical
tropical Indian
Indian Ocean
Ocean north
north of Madagascar
of Madagascar [36]
[37] andand eastofofMadagascar,
east Madagascar,the theAgulhas
Agulhasgyre
gyre
and local
and local forcing
forcing and
and feedback
feedback mechanisms
mechanisms [15].[15].
3. Methodology and Data
3.1. Precipitation Data
Rainfall data used for this study was sourced from the South African Weather Service and data
gaps were filled according to standard procedures of the normal ratio method [37,38]. Nineteen (19)
rainfall stations located across KZN province (Figure 2) were used for studying general precipitation
characteristics and analyzing trends in drought conditions for the period from 1970 to 2017. The mean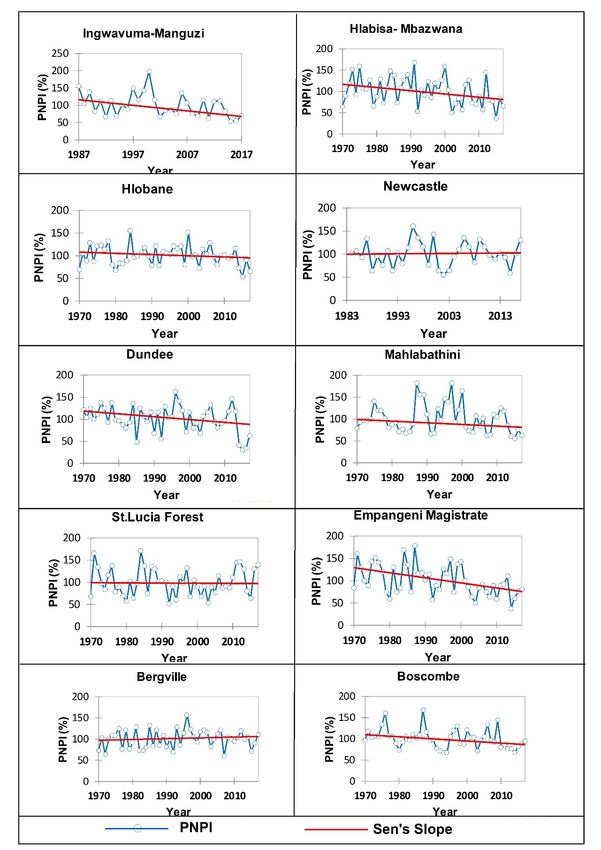
3. Methodology and Data

3.1. Precipitation Data
     Rainfall data used for this study was sourced from the South African Weather Service and data
gaps  were2020,
Atmosphere   filled  according to standard procedures of the normal ratio method [38,39]. Nineteen4 (19)
                 11, 623                                                                               of 20
rainfall stations located across KZN province (Figure 2) were used for studying general precipitation
characteristics and analyzing trends in drought conditions for the period from 1970 to 2017. The mean
annual rainfall
annual    rainfallinformation   for for
                      information    eacheach
                                          weather stationstation
                                               weather     and corresponding data record
                                                                 and corresponding       period
                                                                                      data      considered
                                                                                            record  period
in the study   are   summarized   in  Table 1.
considered in the study are summarized in Table 1.

             Figure
             Figure 2.
                    2. Spatial
                       Spatial distribution
                               distribution of
                                            of the
                                                the weather
                                                    weather stations
                                                            stations in
                                                                     in KZN
                                                                        KZN analyzed
                                                                            analyzed in
                                                                                     in this
                                                                                        this study.

                Table 1. Mean annual rainfall and record period used at each weather station.

                                           Location            Altitude        Record          Mean
               Station
                                                               (m amsl)        Period       Rainfall (mm)
                                     Lat              Long
        Ingwavuma-Manguzi         −26.9830        32.7329         69          1987–2017          827.9
         Hlabisa- Mbazwana        −27.5000        32.6000         55          1970–2017          839.1
               Hlobane            −27.7089        30.9914        1294         1970–2017          860.6
             Newcastle            −27.7322        29.9211        1241         1984–2017          846.7
               Dundee             −28.1619        30.2339        1256         1970–2017          720.8
            Mahlabathini          −28.2500        31.4500        757          1970–2017          788.3
           St.Lucia Forest        −28.3500        32.3800         44          1970–2017         1168.3
        Empangeni Magistrate      −28.7670        31.9170         74          1970–2017          997.5
              Bergville           −28.7319        29.3550        1145         1970–2017          775.1
              Boscombe            −29.0670        30.8170        1151         1970–2017          965.4
              Sani-Pass           −29.6000        29.3500        2063         1970–2017         1049.2
             Allerton Vet         −29.5736        30.3556        711          1970–2017          963.9
             Richmond             −29.8700        30.2700        864          1970–2017          947.8
               Durban             −29.8500        31.0000         76          1970–2017          964.2
            SummerFord            −30.0208        29.9994        1233         1970–2017          871.9
            Franklin Pol          −30.3175        29.4508        1532         1970–2017          711.6
            Glenora Farm          −30.5714        29.8458        872          1970–2017          824.7
               Margate            −30.8500        30.3330        127          1984–2017         1381.8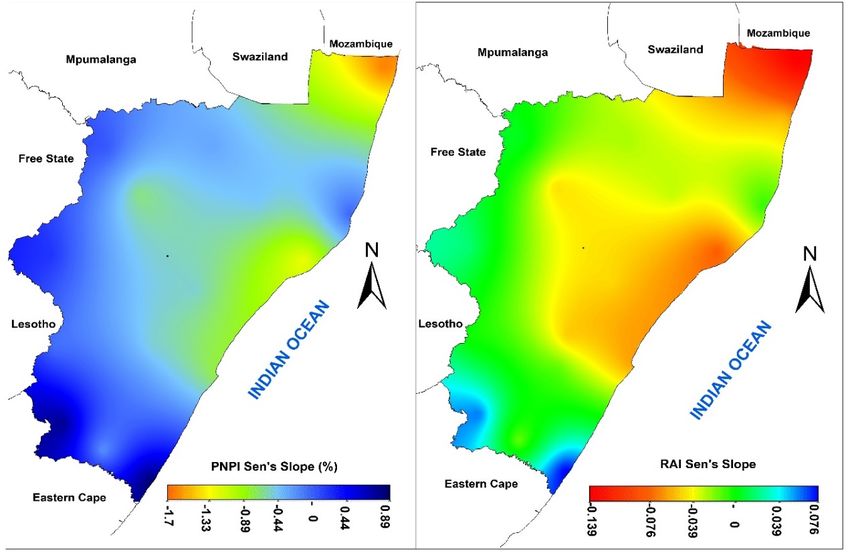
Sani-Pass                                        −29.6000     29.3500          2063           1970–2017           1049.2
                      Allerton Vet                                       −29.5736     30.3556           711           1970–2017           963.9
                       Richmond                                          −29.8700     30.2700           864           1970–2017           947.8
                         Durban                                          −29.8500     31.0000           76            1970–2017           964.2
                      SummerFord                                         −30.0208     29.9994          1233           1970–2017           871.9
                      Franklin Pol
Atmosphere 2020, 11, 623                                                 −30.3175     29.4508          1532           1970–2017           711.6       5 of 20
                     Glenora Farm                                        −30.5714     29.8458           872           1970–2017           824.7
                        Margate                                          −30.8500     30.3330           127           1984–2017           1381.8
     The plot of mean annual precipitation versus the altitude of the rainfall stations (Figure 3) does
            The plot of mean annual precipitation versus the altitude of the rainfall stations (Figure 3) does
not show any conspicuous trend.
       not show any conspicuous trend.

                                     1500

                                     1300
         Mean Annual Rainfall (mm)

                                     1100

                                      900

                                                                                                                                   R² = 0.15
                                      700

                                      500
                                            0        200      400       600    800     1000     1200     1400     1600      1800      2000     2200

                                                                                     Altitude (m amsl)

                                                Figure 3. Rainfall-Altitude relationships for the rainfall stations considered in this study.
                                     Figure 3. Rainfall-Altitude relationships for the rainfall stations considered in this study.
        3.2. Drought
3.2. Drought  IndicesIndices
                      Used Used
    A numberA number     of have
                of indices   indices have
                                  been usedbeen  used for and
                                            for detecting  detecting  and monitoring
                                                               monitoring              of meteorological,
                                                                            of meteorological, agricultural,
       agricultural, hydrological and socio-economic droughts. In this study, two drought indices, namely
hydrological and socio-economic droughts. In this study, two drought indices, namely the PNPI and
       the PNPI and RAI were used to study drought conditions across KZN province using long-term
RAI were used to study drought conditions across KZN province using long-term annual rainfall data.
         annual rainfall data.
Percentage of Normal
       Percentage     Precipitation
                  of Normal          Index
                            Precipitation   (PNI):
                                          Index (PNI):
     The percent of normal precipitation index (PNPI) was developed by [29] and is based on the
concept of dividing the actual precipitation by the normal precipitation. The PNPI index can be
computed for a variety of time scales including a single month, group of months representing a
particular season or annually. According to [39], this index yields the best results when used for a
single region or a single season and is given by Equation (1) [29,39]:

                                                                                           Pi
                                                                               PNPI =         × 100,                                                     (1)
                                                                                           P
where PNPI is the percentage of normal precipitation index, Pi is the actual precipitation for year i and
P is the normal precipitation calculated over a 48-year period (from 1970 to 2017). The PNPI categories
are grouped in terms of drought severity as indicated in Table 2.

                                                                    Table 2. Percent of normal categories [40].

                                                                 Category                                Index (%)
                                                                Normal                                         >80
                                                             Weak drought                                     70–80
                                                            Moderate drought                                  50–70
                                                             Severe drought                                   40–50
                                                            Extreme drought
Atmosphere 2020, 11, 623                                                                             6 of 20

years [41]. This method can be applied in monthly or annual time scales and is given by Equations (2)
and (3) [29]:                                "       #
                                               P−P
                                     RAI = 3            If P > P,                                 (2)
                                               m−P
                                               "       #
                                                 P−P
                                     RAI = −3            If P < P                                 (3)
                                                 X−P
where, P is the long-term mean annual precipitation of the given rainfall station calculated over the
whole data record period, P is the actual precipitation, m is the average of the ten highest yearly
precipitations in the historical record and X is the average of the ten lowest yearly precipitations in the
historical record. The drought index is then classified based on its severity as shown in Table 3.

                           Table 3. Classification of RAI drought severity (adapted from [29]).

                                     Category                                RAI
                                 Extremely wet                                ≥3.0
                                   Very Wet                                2.0 to 2.99
                                 Moderately wet                            1.0 to 1.99
                                  Slightly wet                            0.50 to 0.99
                                  Near Normal                            0.49 to −0.49
                                  Slightly dry                          −0.50 to −0.99
                                 Moderately dry                         −1.0 to −1.99
                                    Very dry                            −2.0 to −2.99
                                 Extremely dry                               ≤−3.00

      The spatial distributions of the drought indices across the studied province were mapped for each
year by Kriging interpolation method using Surfer 15.0 software. The advantages of Kriging is that
it accounts for directional influences and assumes that the distance between sample points reflect a
spatial correlation that can be used to explain variation in the surface. The major disadvantage of the
interpolation is the fact that it introduces some degree of uncertainty depending on the density of
the interpolated points. However, since the interpolation helps in visualization of the spatiotemporal
trend, it is preferable to the station-by-station description of the trend and magnitude of the changes in
the drought indices.

3.3. Statistical Analyses
     To understand the trends and the direction and magnitude of the change of the PNPI and RAI
indices, statistical analyses were undertaken using the Mann–Kendall trend test and Sen’s slope.

Mann–Kendall Test

      The Mann–Kendall test [41,42] is a non-parametric method commonly used for identifying and
analyzing trends in time series hydrological data [32,43–45]. The major advantage of the Mann–Kendall
test is that it is free from statistical distribution which is required in the parametric test. The null
hypothesis (H0 ) in Mann–Kendal tests states that there is no trend or serial correlation between the
analyzed population and the alternative hypothesis (H1 ) states existence of a trend assuming an
increasing or decreasing trend. Data values are evaluated as an ordered time series where each data
point is compared to all subsequent data values.
      In the Mann–Kendall statistic, S is defined as [41,42]:
                                           X        X
                                                n−1   n
                                       S=       i=1   j=i+1 sgn  x j − xi   ,                        (4)
Atmosphere 2020, 11, 623 7 of 20
where, sgn is the signum function. Application of the trend test is performed on a time series xi ranked
from i = 1, 2 . . . . . . . n − 1 and xj , is ranked from j = i + 1, 2 . . . . . . n. Each data point xi is used as a
reference point and is compared with the test of data points xj such that,
1 i f x j − xi > 0
sgn(x j − xi ) = 0 i f x j − xi = 0 , (5)
−1 i f x − x < 0
j i
where if n < 10, the value of S is compared directly to the theoretical value of S derived from Equation
(4). At certain probability levels, H0 is rejected in favor of H1 if the absolute value of S equals or
exceeds a specified value Sα/2 , where Sα/2 is the smallest S which has probability less than α/2 to
appear in the case of no trend. A positive value of S indicates an upward trend and negative value
indicates downward trend. The p-value for the Mann–Kendall test indicates the absence or presence
of significant trends. If the computed value of p > pα , the null hypothesis (H0 ) is rejected at α level
of significance in a two-tailed test. For n ≥ 10, Mann–Kendall statistics S is approximately normally
distributed with variance (Var(s)). The variance statistics is given by Equation (6) as:
P
n(n − 1)(2n + 5) + ti (ti − 1)(2ti + 5)
Var(S) = , (6)
18
where, ti is the number of ties present with i as extent. The presence of a statistically significant trend is
evaluated using the standardized Zc statistics Equation (7):
if S > 0
S−1
√
Var(S)
Zc = 0 if S = 0 (7)
S+1
if S < 0
√
Var(S)
where a positive value of Zc indicates an increasing trend and a negative value indicates a decreasing
trend. The standardized Mann–Kendall statistic Zc follows the standard normal distribution. To test
an increasing or decreasing trend of the drought indices, a two-tailed test at 5% level of significance
is used.
Sen’s Slope Estimator Test
True slope in time series data is estimated by Sen’s procedure [46]. According to [47], Sen’s
method is very robust against outliers. The magnitude of the trend is predicted by the Sen’s slope
estimator (Q).
X j − Xk
( Qi ) = f or i = 1, 2, . . . . . . . . . , N, (8)
j−k
where, Xj and Xk are data values at times j and k (j > k), respectively. The median of N values of Qi is
represented as Sen’s slope estimator. Qmed = Q (N+1)/2 if N is even. Positive value of Q indicates an
increasing trend and a negative value shows a decreasing trend in time series.
4. Results
4.1. Frequency and Spatial Distribution of Drought and Wet Conditions
The spatial distribution of the PNPI drought and wet conditions across the province from 1970 to
2017 is shown in Figure 4. There is a variation in the PNPI drought index from year to year throughout
the province where some of the years are drier and others are wetter. Severe to extreme droughts
were recorded in 2015 and 2016. However, the 2016 severe drought is observed in the central and
north-eastern region of the province. Moderate drought conditions were more prevalent in 1992, 2014
and 2017. Periods dominated by normal conditions are results of the occurrence of above normal
Atmosphere 2020, 11, 623                                                                            8 of 20

rainfall. The PNPI shows more years of weak drought to normal conditions for the entire length of
rainfall record. The wettest conditions (i.e., periods of normal conditions) were prevalent in 1971,
1976–1978, 1987–1989, 1995–2000 and 2006. A detailed inspection of the spatial distribution of the
PNPI revealed a spatial variation in rainfall across the province and that wet and dry conditions are
not peculiar to one region. However, it is important to note that the eastern and western parts of the
province  are
  Atmosphere   dominated
             2020,            by periods
                   11, x FOR PEER REVIEW of normal conditions and weak droughts as compared to moderate
                                                                                                10 of 23
and severe droughts.

                   Figure4.4.Spatiotemporal
                  Figure      Spatiotemporal distribution
                                             distribution of PNPI
                                                             PNPI index
                                                                   indexacross
                                                                         acrossthe
                                                                                theKZN
                                                                                    KZNprovince.
                                                                                        province.

     The spatiotemporal distribution of RAI is presented in Figure 5. The RAI indices show more years
with dry conditions as compared to wet conditions. The very dry to extremely dry conditions were
prevalent in 1979–1980, 1992, 2002–2003, 2014 and 2015. Slightly dry to moderately dry conditions are
widespread in 1970–1973, 1997, 1981, 1983, 1986, 1990–1991, 1993–1994, 2001, 2004, 2009–2011 and 2016.
Similar drought conditions were reported by [16] in the Free State and North West provinces using the
SPI and standardized precipitation evapotranspiration index (SPEI). Extremely wet to moderately wet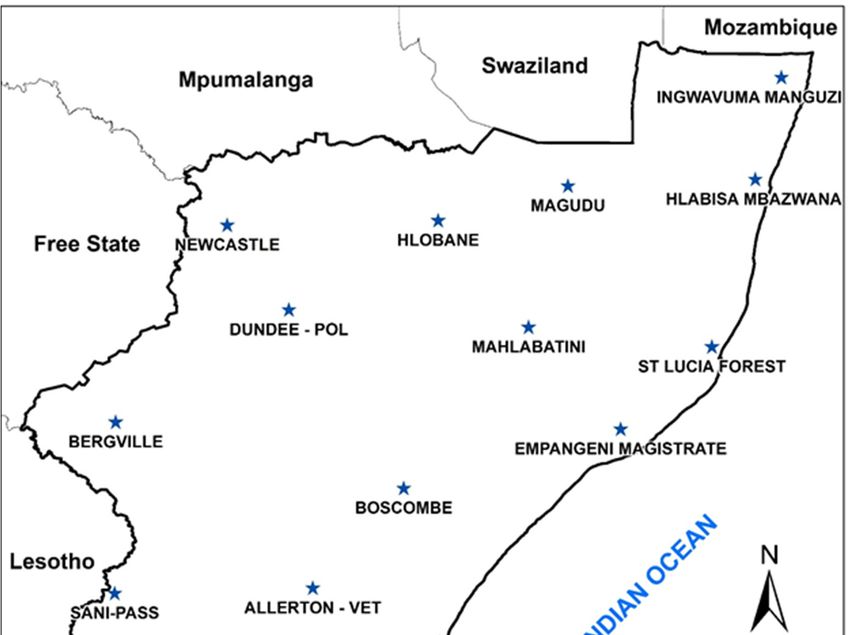
Atmosphere 2020, 11, 623                                                                               9 of 20

conditions were more prevalent in 1975–1976, 1978, 1987–1989, 1995–1997, 2000 and 2006. The driest
and the wettest years were recorded in 1992 and 2014, and 1987, respectively. [48,49] made similar
observations and indicated that 1992 and 1993 were the worst droughts in consecutive years and that
1987 was the wettest year attributed to cyclonic events. Through a visual inspection of the indices
plot, it has been observed that very dry and extremely dry conditions have a cycle of 3–5 years and
10–12 years, respectively. The spatial distribution shows that regions in the northern parts of the KZN
province recorded high magnitude of drought during a dry year. Similar observations were reported
by [50] where the droughts of the early 1980s, 1990s and 2000s had the strongest expression over the
eastern areas of South Africa. The drought indices do not indicate specific orographic effects on the
distribution of wet and dry conditions, which is in line with the absence of any clear orographic effect
inAtmosphere
    the rainfall–altitude    plot of
             2020, 11, x FOR PEER    Figure 3. A comparison of the two indices indicates that the PNPI
                                  REVIEW                                                             11 shows
                                                                                                        of 23
more wet conditions than the RAI.

                   Figure 5. Spatiotemporal distribution of RAI index across the KZN province.
                   Figure 5. Spatiotemporal distribution of RAI index across the KZN province.

 4.2. Statistical Trend Analysis of Drought Indices
      Statistical analyses of the PNPI and RAI indices using the Mann–Kendall trend test and Sen’s
 slope were undertaken at a 5% significance level and a 95% confidence interval in order to understand
 the change in the magnitude and intensity of drought indices for the entire record period i.e., 1970–
 2017. Table 4 shows summary results of the statistical analysis. Increasing and decreasing trends in
Atmosphere 2020, 11, 623                                                                                    10 of 20

4.2. Statistical Trend Analysis of Drought Indices
     Statistical analyses of the PNPI and RAI indices using the Mann–Kendall trend test and Sen’s
slope were undertaken at a 5% significance level and a 95% confidence interval in order to understand
the change in the magnitude and intensity of drought indices for the entire record period i.e., 1970–2017.
Table 4 shows summary results of the statistical analysis. Increasing and decreasing trends in both
indices were detected at 4 (22%) and 14 (77%) of the rainfall gauging stations, respectively. The
increasing trend in indices indicates an increase in wet conditions and a decreasing trend indicates a
decrease in wet conditions (increase in drought severity). It was observed that significant trends exist
within the data or indices and the null hypothesis (H0 ) has been rejected in favor of the alternative
hypothesis (H1 ). The results of S value for the Mann–Kendal test are in agreement with the results of
Sen’s slope for both RAI and PNPI. The stations that revealed increasing trends in wet conditions in the
indices are located in the southern region (Margate and Franklin Pol stations) and in the north-western
region (Newcastle and Bergville stations) of the province. The Ingwavuma-Manguzi station revealed
the most decreasing trend whereas, Sani-Pass station revealed the least declining trend for both PNPI
and RAI indices, in which case altitude appears to be important to proximity to the moisture source.

      Table 4. Summary results of statistical analysis of drought indices (note the p-Values of stations that
      show statistically significant results are indicated in bold).

                                    Altitude                                             Sen’s Slope
          Rainfall Station                           S-Value        p-Value
                                    (m amsl)                                         RAI            PNPI
     Ingwavuma-Manguzi                 69             −131           0.026          −0.137         −1.617
     Hlabisa- Mbazwana                 55             −256           0.023          −0.056         −0.787
     Hlobane                          1294            −130           0.253          −0.028         −0.271
     Newcastle                        1241             17            0.814           0.005         0.056
     Dundee                           1256            −212           0.061          −0.046         −0.613
     Mahlabathini                     757             −156           0.169          −0.032         −0.409
     St.Lucia Forest                   44              0             0.993        −9.8 × 10⁻⁵      −0.001
     Empangeni Magistrate              74             −336           0.003          −0.079         −1.135
     Bergville                        1145             78            0.496           0.021          0.194
     Boscombe                         1151            −286           0.011          −0.048         −0.484
     Sani-Pass                        2063            −20            0.867          −0.003         −0.038
     Allerton Vet                      711            −221           0.049          −0.051         −0.467
     Richmond                          864            −71            0.528          −0.017         −0.233
     Durban                            76             −288            0.01           −0.06         −0.708
     SummerFord                       1233            −20            0.867          −0.005         −0.046
     Franklin Pol                     1532            304            0.007           0.058          0.765
     Glenora Farm                      872            −134           0.239           −0.02         −0.193
     Margate                          127             123             0.07           0.078          0.879

     The time series plots of PNPI and RAI indices along with Sen’s slopes are presented in Appendix A,
respectively. The time series plots show variation in the drought indices from year-to-year throughout
the record period. This in turn suggests that rainfall varied from year-to-year. The negative values
of RAI represent the dry years, with different intensity. Tables 5 and 6 show descriptive statistics of
the PNPI and RAI indices for the analyzed rainfall stations, respectively. Both indices show that 50%,
16% and 11% of rainfall stations have minimum values in 2015, 2014 and 1992, respectively. Whereas
the maximum values are observed in 39%, 22% and 11% of the rainfall stations in 1987, 1996 and
2000, respectively. This is in agreement with the spatiotemporal changes presented in Section 4.1.
Figure 6 shows the spatial distribution of Sen’s slope for PNPI and RAI across the province for the
entire record period. It shows that the north-eastern region is characterized by the most significant
decline in drought indices followed by eastern and central regions of the province. The western region
of the province shows the least declining trend. The south-western and south-eastern regions revealed
a positive slope indicating a decrease in drought occurrence and severity.
Atmosphere 2020, 11, 623 11 of 20
Table 5. Descriptive statistics of PNP index (%).
Rainfall Station Minimum Maximum Mean σ
Ingwavuma-Manguzi 52.94 (2015) 197.17 (2000) 100.0 33.8
Hlabisa- Mbazwana 37.29 (2015) 167.58 (1991) 100.0 32.2
Hlobane 53.57 (2015) 154.88 (1994) 100.0 21.7
Newcastle 54.99 (2002) 159.63 (1996) 100.0 26.4
Dundee 30.10 (2015) 161.67 (1996) 100.0 29.6
Mahlabathini 54.29 (2015) 181.81 (1987) 100.0 32.4
St.Lucia Forest 50.35 (1992) 170.15 (1984) 100.0 30.0
Empangeni Magistrate 37.70 (2014) 177.74 (1987) 100.0 33.6
Bergville 59.34 (2007) 157.23 (1996) 100.0 20.8
Boscombe 66.38 (2014) 167.39 (1987) 100.0 22.7
Sani-Pass 44.25 (2015) 144.54 (1987) 83.1 17.9
Allerton Vet 64.27 (2016) 159.05 (1987) 100.0 20.8
Richmond 49.43 (2015) 165.42 (1996) 99.5 24.4
Durban 48.21 (2014) 147.65 (1999) 100.0 26.1
SummerFord 53.25 (2015) 173.92 (1987) 100.0 21.6
Franklin Pol 28.81 (1974) 162.61 (1987) 100.6 29.1
Glenora Farm 55.16 (2015) 149.80 (2000) 100.0 20.5
Margate 39.74 (1992) 179.75 (2012) 100.0 30.2
Table 6. Descriptive statistics of RA index.
Rainfall Station Minimum Maximum Mean σ
Ingwavuma-Manguzi −4.09 (2015) 7.75 (2000) −0.10 2.79
Hlabisa- Mbazwana −4.55 (2015) 4.45 (1991) −0.09 2.22
Hlobane −4.88 (2015) 5.51 (1994) −0.04 2.23
Newcastle −4.24 (2002) 5.74 (1996) 0.02 2.52
Dundee −4.69 (2015) 5.08 (1996) 0.18 2.18
Mahlabathini −3.81 (2015) 4.86 (1987) −0.31 2.22
St.Lucia Forest −3.91 (1992) 4.81 (1984) −0.12 2.19
Empangeni Magistrate −4.64 (2014) 4.67 (1987) −0.20 2.22
Bergville −4.24 (2007) 6.30 (1996) 0.05 2.23
Boscombe −3.66 (2014) 5.92 (1987) −0.18 2.18
Sani-Pass −4.47 (2015) 14.10 (1987) −0.88 2.87
Allerton Vet −4.03 (2016) 5.71 (1987) −0.13 2.16
Richmond −5.06 (2015) 6.44 (1996) −0.02 2.40
Durban −4.14 (2014) 4.21 (1999) 0.09 2.19
SummerFord −5.68 (2015) 6.99 (1987) −0.22 2.27
Franklin Pol −4.84 (1974) 5.21 (1987) 0.21 2.18
Glenora Farm −5.09 (2015) 5.06 (2000) −0.09 2.19
Margate −5.42 (1992) 6.68 (2012) −0.08 2.62Atmosphere 2020, 11, x FOR PEER REVIEW 14 of 23
Atmosphere 2020, 11, 623 12 of 20
(a)
Figure 6. Spatial distribution (b) period from 1970 to 2017.
of Sen’s slope for (a) PNPI and (b) RAI for the
5. Discussion
Figure 6. Spatial distribution of Sen’s slope for (a) PNPI and (b) RAI for the period from 1970 to 2017.
The spatial and temporal variation of rainfall in the province is evident as rainfall decreases from
5. Discussion areas inland. However, rainfall increases again from the central areas towards the western
the coastal
part of the province along the Drakensberg mountain range due to what appears to be an orographic
The spatial and temporal variation of rainfall in the province is evident as rainfall decreases from
effect at least for the Sani-Pass rainfall station. The north-eastern areas generally receive high rainfall,
the coastal areas inland. However, rainfall increases again from the central areas towards the western
while the northern areas around Hlobane and Dundee receive a low annual rainfall of between 720 mm
part of the province along the Drakensberg mountain range due to what appears to be an orographic
and 860 mm. In the region along the eastern and south-eastern coast of the province, rainfall increases
effect at least for the Sani-Pass rainfall station. The north-eastern areas generally receive high rainfall,
towards the south with Margate receiving the highest annual rainfall of 1380 mm.
while the northern areas around Hlobane and Dundee receive a low annual rainfall of between 720
Severe (very dry) to extreme droughts were mainly observed in 1992–1993 and 2015–2016. Whereas,
mm and 860 mm. In the region along the eastern and south-eastern coast of the province, rainfall
wet to extremely wet years were 1987, 1996 and 2000. It has been observed that drought frequency
increases towards the south with Margate receiving the highest annual rainfall of 1380 mm.
has increased over the record period. According to [48], in 1992–1993 summer periods, the rainfall
Severe (very dry) to extreme droughts were mainly observed in 1992–1993 and 2015–2016.
over south-east Africa and KZN was below average as a result of an offshore water vapor flux, low
Whereas, wet to extremely wet years were 1987, 1996 and 2000. It has been observed that drought
precipitable water and surface divergence. Severe (very dry) and extremely dry conditions have a
frequency has increased over the record period. According to [49], in 1992–1993 summer periods, the
cycle of 3−5 and 10−12 years, respectively.
rainfall over south-east Africa and KZN was below average as a result of an offshore water vapor
Statistical analysis of drought indices revealed significant increasing and decreasing trends in
flux, low precipitable water and surface divergence. Severe (very dry) and extremely dry conditions
both indices in 22% and 78% of the rainfall stations, respectively. This trend shows that 78% of
have a cycle of 3−5 and 10−12 years, respectively.
the stations have recorded an increase in drought severity (i.e., decrease in wet conditions). The
Statistical analysis of drought indices revealed significant increasing and decreasing trends in
Ingwavuma-Manguzi rainfall station shows the highest decreasing trend (−0.137 and −1.617 for RAI
both indices in 22% and 78% of the rainfall stations, respectively. This trend shows that 78% of the
and PNPI, respectively) indicating an increase in drought severity. Some stations that show increasing
stations have recorded an increase in drought severity (i.e., decrease in wet conditions). The
trends of the indices indicate an increase in wet conditions. The results of the Mann–Kendal trend
Ingwavuma-Manguzi rainfall station shows the highest decreasing trend (−0.137 and −1.617 for RAI
test are in agreement with the results of Sen’s slope for both RAI and PNPI. The descriptive statistics
and PNPI, respectively) indicating an increase in drought severity. Some stations that show
show that minimum values were recorded at 50%, 16% and 11% of stations in 2015, 2014 and 1992,
increasing trends of the indices indicate an increase in wet conditions. The results of the Mann–
respectively. Whereas maximum values are observed in 39%, 22% and 11% of the rainfall stations
Kendal trend test are in agreement with the results of Sen’s slope for both RAI and PNPI. The
in 1987, 1996 and 2000, respectively. The overall spatial analysis of the drought indices showed that
descriptive statistics show that minimum values were recorded at 50%, 16% and 11% of stations in
drought conditions are not peculiar to one region of the province and vary from year to year. This
2015, 2014 and 1992, respectively. Whereas maximum values are observed in 39%, 22% and 11% of
variation has been linked to ENSO and SST as the main drivers of interannual rainfall variability [9,13].
the rainfall stations in 1987, 1996 and 2000, respectively. The overall spatial analysis of the drought
Studies [11,51] have shown that abnormally warm SST in the Indian Ocean are associated with intense
indices showed that drought conditions are not peculiar to one region of the province and vary fromAtmosphere 2020, 11, 623 13 of 20
or reduced precipitation. In Southern Africa, drought periods are associated with El Niño events [52]
and during drought periods the northern region of the province is mostly affected by severe drought
conditions. The extremely wet conditions observed in the north-eastern region in 1984 and 2000 were
associated with tropical cyclone Domoina [53,54] and tropical cyclone Eline [55], respectively. This
is consistent with the tracks of tropical cyclones which mainly affect the north-eastern part of KZN,
Mozambique and Swaziland [53,55]. There are no conspicuous orographic effects observed on the
drought indices as both high and low altitude regions have experienced similar extreme drought
conditions in the same year.
During the 2014–2015 hydrological year, the dam storage levels across the province were reduced
to less than 50% due to the severe drought. Six of the large dams in the province, namely Albert Falls,
Geodertrouw, Hazelmere, Klipfontein, Hluhluwe and Midmar were critically low during 2014–2016 [35]
prompting water use restriction across the province. For instance, the Hazelmere dam storage level
was less than 26% and the Hluhluwe dam was at 22% due to reduction of water inflow from 280 to
90 m3 /hour, prompting a further increase of water use restrictions from 15% to 50%.
Comparative analyses of the two indices indicate that PNPI shows more years of normal conditions
whereas RAI shows more years of dry conditions. Additionally, RAI gives more details on dry and wet
conditions than the PNPI. This is because of the fact that PNPI does not account for wet to extremely
wet years since it considers all values greater than 80% as normal conditions. Thus, RAI can be
effectively used in Southern Africa to map meteorological drought conditions.
6. Conclusions
Analyses of meteorological drought and wet condition across the KZN province has been
successfully undertaken by applying PNPI and RAI drought indices on annual rainfall data that spans
from 1970 to 2017. The results show that both drought frequency and severity have increased in recent
years. The most extreme dry periods were in 1992–1993 and 2015–2016. The extreme wet years were
1984 and 2000 which are related to tropical cyclones. The number of extreme dry years are much
higher than the number of wet years over the studied period. The drought indices show that severe
(very dry) drought have a cycle of 3–5 years whereas extreme drought conditions have a 10–12 year
cycle. However, this study shows that extreme drought conditions have become more frequent in
recent decades. The identified extreme drought and wet conditions are mainly the result of changes
taking place in the moisture source region caused by regional to global drivers such as ENSO and SST.
Although both indices identified and characterized drought and wet conditions, comparative analyses
of the results of PNPI and RAI generating dry conditions indicate that the RAI identified extreme and
severe drought conditions more clearly and robustly than PNPI.
The identified drought conditions have, obviously, brought about a decrease in rainfall across the
province, significantly impacting the water resources and its availability for domestic, agricultural and
other socio-economic activities. The increasing frequency and severity of the dry spells means that
both surface and groundwater resources in the province have been constantly declining over the past
decade. Therefore, a proactive science-based policy involving all stakeholders is essential for drought
management and building long-term resilience.
Author Contributions: Conceptualization, M.S.N. and, M.D.; methodology, M.S.N. and M.D.; validation,
M.S.N. and M.D.; formal analysis, M.S.N. and M.D.; investigation, M.S.N. and M.D.; data curation, M.S.N.;
writing—original draft preparation, M.S.N. and M.D.; writing—review and editing, M.D.; visualization, M.S.N.;
supervision, M.D.; project administration, M.D. All authors have read and agree to the published version of
the manuscript.
Funding: This research received no external funding.
Acknowledgments: The South African Weather Service is acknowledged for supplying the rainfall data used in
this study.
Conflicts of Interest: Authors declare no conflict of interest.Atmosphere 2020, 11, x FOR PEER REVIEW 17 of 23
Atmosphere 2020, 11, 623 14 of 20
Appendices
Appendix A Appendix
Appendix A. Time series plots of PNPI drought indices and Sen’s Slope for the various rainfall
Appendix A.1
stations
Figure A1. Cont.Atmosphere 2020,2020,
Atmosphere 11, x11,
FOR623PEER REVIEW 18 of15
23of 20
Figure A1. Time Series Plots of PNPI Drought indices and Sen’s Slope for the Various Rainfall Stations.Atmosphere
Atmosphere2020,
2020,11,
11,x623
FOR PEER REVIEW 19
16ofof23
20
Appendix A.2
Appendix B. Time series plots of RAI drought indices and Sen’s Slopes for various rainfall stations
Figure A2. Cont.Atmosphere 2020,
Atmosphere 2020, 11,
11, 623
x FOR PEER REVIEW 20 of 20
17 of 23
Figure A2. Time Series Plots of RAI Drought indices and Sen’s Slopes for Various Rainfall Stations.
References
References
1. Department of Water Affairs and Forestry. National Groundwater Strategy; Department of Water Affairs
and Forestry: Pretoria, South Africa, 2010.
1. Department of Water Affairs and Forestry. National Groundwater Strategy; Department of Water Affairs and
2. World Meteorological Organization (WMO). International Meteorological Vocabulary, 2nd ed.; World
Forestry: Pretoria, South Africa, 2010.
Meteorological Organization: Geneva, Switzerland, 1992.
2. World Meteorological Organization (WMO). International Meteorological Vocabulary, 2nd ed.; World
3. Department of Water and Sanitation. Drought Status Report: November 2015; Department of Water and
Meteorological Organization: Geneva, Switzerland, 1992.
Sanitation: Pretoria, South Africa, 2015.
4. Hove, L.; Kambanje, C. Lessons from the El Nino–induced 2015/16 drought in the Southern Africa
region. Curr. Dir. Water Scarcity Res. 2019, 33–54, doi:10.1016/b978-0-12-814820-4.000031.Atmosphere 2020, 11, 623 18 of 20
3. Department of Water and Sanitation. Drought Status Report: November 2015; Department of Water and
Sanitation: Pretoria, South Africa, 2015.
4. Hove, L.; Kambanje, C. Lessons from the El Nino–induced 2015/16 drought in the Southern Africa region.
Curr. Dir. Water Scarcity Res. 2019, 33–54. [CrossRef]
5. Tyson, P.D.; Preston-Whyte, R.A. The Weather and Climate of Southern Africa, 2nd ed.; Oxford University Press
Southern Africa: Cape Town, South Africa, 2000; pp. 228–236.
6. Nicholson, S.E.; Leposo, D.; Grist, J. The relationship between El Niño and drought over Botswana. J. Clim.
2001, 14, 323–335. [CrossRef]
7. Rouault, M.; Richard, Y. Intensity and spatial extension of drought in South Africa at different time scales.
Water Sa 2003, 29, 489–500. [CrossRef]
8. Ratnam, J.V.; Behera, S.K.; Masumoto, Y.; Yamagata, T. Remote effects of El Niño and Modoki events on the
Austral Summer Precipitation of Southern Africa. J. Climatol. 2014, 27, 3802–3815. [CrossRef]
9. Dieppois, B.; Rouault, M.; New, M. The impact of ENSO on Southern African rainfall in CMIP5 ocean
atmosphere coupled climate models. Clim. Dyn. 2015, 45, 2425–2442. [CrossRef]
10. Walker, N.D.; Lindesay, J.A. Preliminary observations of oceanic influences on the February–March 1988
floods in central SouthAfrica. S. Afr. J. Sci. 1989, 85, 164–169.
11. Reason, C.J.C.; Mulenga, H. Relationships between South African rainfall and SST anomalies in the south
west Indian Ocean. Int. J. Climatol. 1999, 19, 1651–1673. [CrossRef]
12. Camberlin, P.; Diop, M. Inter-relationships between groundnut yield in Senegal, interannual rainfall variability
and sea-surface temperatures. Theor. Appl. Climatol. 1999, 63, 163–181. [CrossRef]
13. Fauchereau, N.; Trzaska, S.; Richard, Y.; Roucou, P.; Camberlin, P. Sea-surface temperature co-variability
in the Southern Atlantic and Indian Oceans and its connections with the atmospheric circulation in the
Southern Hemisphere. Int. J. Climatol. 2003, 23, 663–677. [CrossRef]
14. Nicholson, S.E.; Kim, J. The relationship of the El Niño–Southern Oscillation to African rainfall. Int. J.
Climatol. 1997, 17, 117–135. [CrossRef]
15. Hewitson, B.C.; Tenant, W.; Walawege, R. Atmospheric moisture transport and sources for South Africa; WRC
Report, No. 1024/1/04; 2004; WRC: Pretoria, South Africa.
16. Botai, C.M.; Botai, J.O.; Dlamini, L.C.; Zwane, N.S.; Phaduli, E. Characteristics of Droughts in South Africa:
A Case Study of Free State and North West Provinces. Water 2017, 8, 439. [CrossRef]
17. Keyantash, J.; Dracup, J.A. The Quantification of Drought: An Evaluation of Drought Indices. Bull. Am.
Meteorol. Soc. 2000, 83, 1167–1180. [CrossRef]
18. Morid, S.; Smakhtin, V.; Moghaddasi, M. Comparison of seven meteorological indices for drought monitoring
in Iran. Int. J. Climatol. 2006, 26, 971–985. [CrossRef]
19. Salehnia, N.; Alizadeh, A.; Sanaeinejad, H.; Bannayan, M.; Zarrin, A.; Hoogenboom, G. Estimation of
meteorological drought indices based on AgMERRA precipitation data and station-observed precipitation
data. J. Arid Land 2017, 9, 797–809. [CrossRef]
20. Afzalia, A.; Keshtkarb, H.; Pakzada, S.; Moazamia, N.; Azizabadi Farahania, E.A.; Golpaygania, A.;
Khosrojerdia, E.; Yousefia, Z.; Taghi Naghiloua, M. Spatio-Temporal Analysis of Drought Severity Using
Drought Indices and Deterministic and Geostatistical Methods (Case Study: Zayandehroud River Basin).
Deserts 2016, 21, 165–172.
21. Wilhite, D.A.; Glantz, M. Understanding the drought Phenomenon: The Role of Definitions. Water Int. 1985,
10, 111–112. [CrossRef]
22. Wilhite, D. Drought: A Global Assessment; Routledge: New York, NY, USA, 2000; p. 752.
23. World Meteorological Organization. Drought Monitoring and Early Warning: Concepts, Progress and Future
Challenges; WMO-No. 1006; World Meteorological Organization: Geneva, Switzerland, 2006.
24. Asefjah, B.F.; Fanian, Z.; Feizi, A.; Abolhasani, H.; Paktinat, M.; Naghilou, A.; Molaei Atani, M.; Asadollahi, M.;
Babakhani, A.; Kouroshnia, F.; et al. Drought monitoring by using several meteorological drought indices
(Case study: Salt Lake Basin of Iran). Desert 2014, 19, 155–165.
25. Palmer, W.C. Meteorological Drought; Research Paper, No. 45; U.S. Weather Bureau: Washington, DC,
USA, 1965.Atmosphere 2020, 11, 623 19 of 20
26. Shafer, B.A.; Dezman, L.E. Development of a Surface Water Supply Index (SWSI) to assess the severity of
drought conditions in snowpack runoff areas. In Proceedings of the Western Snow Conference, Colorado
State University, Fort Collins, CO, USA, 19–23 April 1982; pp. 164–175.
27. McKee, T.B.; Doesken, N.J.; Kleist, J. The relationship of drought frequency and duration to time steps.
Preprints. In In Proceedings of the 8th Conference on Applied Climatology, Anaheim, CA, USA, 22 January
1993; pp. 179–184.
28. Willeke, G.; Hosking, J.R.M.; Wallis, J.R.; Guttman, N.B. The National Drought Atlas; Institute for Water
Resources Report 94-NDS-4; U.S. Army Corps of Engineers: San Francisco, CA, USA, 1994.
29. Van Rooy, M.P. A rainfall anomaly index independent of time and space. Notos 1965, 14, 43–48.
30. Meyer, S.J.; Hubbard, K.G.; Wilhite, D.A. A crop-specific drought index for corn. Model development and
validation. Agron. J. 1993, 85, 388–395. [CrossRef]
31. Barua, S.; Ng, A.W.M.; Perera, B.J.C. Comparative Evaluation of Drought Indexes: A Case Study on the Yarra
River Catchment in Australia. J. Water Resour. Plan. Manag. 2011, 137, 215–226. [CrossRef]
32. Sneyer, R. On the Statistical Analysis of Series of Observations; Technical Note, no. 143, WMO No. 415; World
Meteorological Organization: Geneva, Switzerland, 1990.
33. Subash, N.; Gangwar, B. Statistical analysis of Indian rainfall and rice productivity anomalies over the last
decades. Int. J. Climatol. 2013, 34, 2378–2392. [CrossRef]
34. StatsSA. Mid-Year Population Estimates: Statistics South Africa. P0302; Statistics South Africa: Pretoria,
South Africa, 2016; 17p.
35. Department of Water and Sanitation. Digital Elevation Model; Department of Water and Sanitation: Durban,
South Africa, 2016.
36. Cook, C.; Reason, C.J.C.; Hewitson, B.C. West and dry spells within particularly wet and dry summers in the
South African summer rainfall region. Clim. Res. 2004, 26, 17–31. [CrossRef]
37. Fetter, C.W. Applied Hydrogeology, 4th ed.; Prentice-Hall, Inc.: Upper Sadlle River, NJ, USA, 2001; 589p.
38. Singh, V.P. Elementary Hydrology; Prentice Hall of India: New Delhi, India, 1994; 973p.
39. Ostad-Ali-Askari, K.; Eslamian, S.; Singh, V.P.; Dalezios, N.R.; Ghane, M.; Yihdego, Y.; Motouq, M. A review
of drought index. Int. J Constr. Res. Civ. Eng. 2017, 3, 48–66.
40. Javan, K.; Azzizadeh, M.R.; Yousefi, S. An Investigation and Assessment of meteorological drought in Lake
Urma Basin using drought indices and probabilistic methods. Nat. Environ. Chang. 2016, 2, 153–164.
41. Mann, H.B. Non-parametric test against trend. Econometrica 1945, 13, 245–259. [CrossRef]
42. Kendall, M.G. Rank Correlation Methods; Charles Griffin: London, UK, 1975.
43. Wilks, D.S. Hypothesis Testing. In Statistical Methods in the Atmospheric Sciences; Academic Press: New York,
NY, USA, 1995; pp. 160–176.
44. Yue, S.; Pilon, P.; Phinney, B.; Cavadias, G. The influence of autocorrelation on the ability to detect trend in
hydrological series. Hydrol. Process. 2002, 16, 1807–1829. [CrossRef]
45. Luo, Y.; Liu, S.; Fu, S.; Liu, J.; Wang, G.; Zhou, G. Trends of precipitation in Beijiang River Basin, Guangdong
province, China. Hydrol. Process. 2008, 22, 2377–2386. [CrossRef]
46. Sen, P.K. Estimates of the regression coefficient based on Kendall’s tau. J. Am. Stat. Assoc. 1968, 63, 1379–1389.
[CrossRef]
47. Hirsch, R.M.; Slack, J.R.; Smith, R.A. Techniques of trend analysis for monthly water quality data. Water
Resour. Res. 1982, 18, 107–121. [CrossRef]
48. Dube, L.T.; Jury, M.R. Meteorological structure of the 1992/93 drought over eastern South Africa from
ECMWF and satellite OLR analyses. S. Afr. Geogr. J. 2002, 84, 170–181. [CrossRef]
49. Terry, A.K. The impact of the 2015-16 El Nino drought on the irrigated home gardens of the Komati
downstream development project, Swaziland. S. Afr. Geogr. J. 2019. [CrossRef]
50. Malherbe, J.; Dieppois, B.; Maluleke, P.; Van Staden, M.; Pillay, D.L. South African droughts and decadal
variability. Nat. Hazards 2016, 80, 657–681. [CrossRef]
51. Reason, C.J.C. Sensitivity of the southern African circulation to dipole sea-surface-temperature patterns in
the south Indian Ocean. Int. J. Climatol. 2002, 22, 377–393. [CrossRef]
52. Lakhraj-Govender, R.; Grab, S.W. Assessing the impact of El Niño-Southern Oscillation on South African
temperatures during austral summer. Int. J. Climatol. 2018. [CrossRef]
53. Jury, M.R.; Pathack, B.; Wang, B.; Powell, M.; Raholitao, N. A destructive Tropical cyclone season in the SW
Indian Ocean: January–February 1984. S. Afr. Geogr. J. 1993, 75, 53–59. [CrossRef]Atmosphere 2020, 11, 623 20 of 20
54. Matondo, J.I.; Msibi, K.M. Estimation of the impact of climate change on hydrology and water resources in
Swaziland. Water Int. 2001, 26, 425–434. [CrossRef]
55. Reason, C.J.C.; Keibel, A. Tropical cyclone Eline and its usual penetration and impacts over the South African
mainland. Am. Meteorol. Soc. 2004, 19, 789–805.
© 2020 by the authors. Licensee MDPI, Basel, Switzerland. This article is an open access
article distributed under the terms and conditions of the Creative Commons Attribution
(CC BY) license (http://creativecommons.org/licenses/by/4.0/).You can also read