ROTORUA WASTEWATER TREATMENT PLANT - Rotorua Wastewater Treatment Plant Te Ngae Road, Rotorua
←
→
Page content transcription
If your browser does not render page correctly, please read the page content below
ROTORUA
WASTEWATER
TREATMENT PLANT

     Rotorua Wastewater Treatment Plant
            Te Ngae Road, Rotorua
              Tel: (07) 3478575
              Fax: (07) 3479373

                     1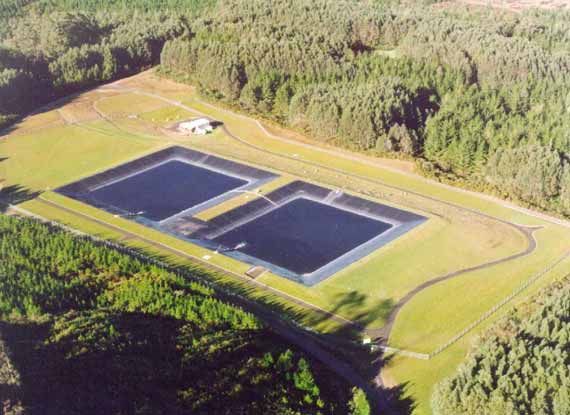
Contents
WATER - TE WAIORA (THE WATERS OF LIFE)................................................................................ 6
ROTORUA LAKES REGION........................................................................................................................ 6
LOCATION ..................................................................................................................................................... 7
  Our community and the water cycle ..................................................................................................... 8
FRESHWATER TO WASTEWATER ......................................................................................................... 8
  Sources of wastewater in Rotorua........................................................................................................ 8
  Why do we treat wastewater?............................................................................................................... 9
  How does the wastewater get to the Treatment Plant? ................................................................. 9
  The wastewater treatment service area ............................................................................................. 9
HISTORY OF ROTORUA’S WASTEWATER TREATMENT SYSTEM ........................................... 10
ROTORUA WASTEWATER TREATMENT PROCESSES .................................................................... 11
 Preliminary treatment ............................................................................................................................. 11
 Primary treatment ................................................................................................................................... 11
 Secondary treatment ............................................................................................................................. 12
 Sludge processing.................................................................................................................................... 13
 Composting ................................................................................................................................................ 14
 Land treatment of final effluent ........................................................................................................ 15
ENVIRONMENTAL LABORATORY AND MONITORING ................................................................ 17
CURRENT PERFORMANCE OF THE WWTP AND LAND TREATMENT SYSTEM ...................... 17
THE FUTURE................................................................................................................................................ 19
 Reticulation of lakeside settlements.................................................................................................. 19
PERSONNEL .................................................................................................................................................20
WWTP TECHNICAL DATA (2006)......................................................................................................... 21
 General....................................................................................................................................................... 21
 Plant dimensions....................................................................................................................................... 21
 Sludge-biosolids....................................................................................................................................... 21
 Forest irrigation ...................................................................................................................................... 21
 Financial data ........................................................................................................................................... 21
SCHEMATIC DIAGRAM OF WASTEWATER TREATMENT PLANT PROCESSES.....................22

                                                                                2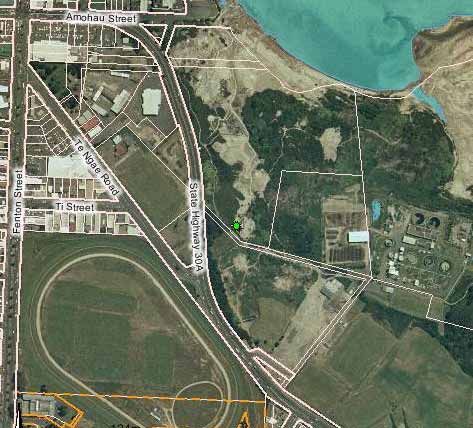
3
4
5
WATER - TE WAIORA (THE WATERS OF LIFE)

                 He tapu to te wai, he oranga to te wai, he waiariki
                 Water is sacred, water is life, indeed it is from God

We are one of many species living on earth and all of us rely on water for life. Water and
water bodies are gifts with a life force referred to as ‘mauri’ by tangata whenua. We all have
a responsibility to work together for the benefit of all, to safeguard water from pollution,
degradation or damage, and to take full responsibility for our actions.

Water has been on earth for millions of years, flowing in a cycle from one form or place to
another. From surface water to vapour, rain, groundwater passing through the earth to
restore the mauri, through wetlands, streams, rivers and lakes to the sea. All the water on
the surface of the earth can be evaporated once again, part of ‘Natures Water Cycle’.

                           ROTORUA LAKES REGION
The Rotorua Lakes Region is located in the central North Island of New Zealand on a
landscape sculptured by volcanic activity and the action of water. The Rotorua catchment is a
caldera, a volcanic basin. Streams, rivers and groundwater via springs, transport nutrients
and particulates into Lake Rotorua. After a long residence time, lake-water flows through the
Ohau Channel to the adjacent Lake Rotoiti, and eventually down the Kaituna River to the sea.

On the shores of Lake                                 Rotorua Lakes
Rotorua is the city of
Rotorua. It has a resident
population of around 68000
and being one of 14 lakes in
this natural, diverse and
beautiful environment, it is
visited by many tourists.

Water is an important
resource for everybody in
the region.

Let us treat this gift of
water with respect, and
safeguard the numerous
natural water bodies in our
environment from further
pollution, degradation and
damage.

                                              6
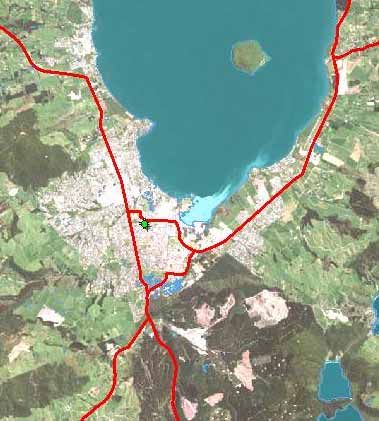
LOCATION
                    Tauranga                            Rotorua Wastewater
 Hamilton
                         Whakatane
                                                         Treatment Plant

                               City Centre

                                                           Lake Rotorua

Landfill    Taupo

                                          Arawa Park
                                          Race Course

                                      7
Our community and the water cycle
Water is taken from the surrounding environment for our use (Rotorua Water Supply), and
as a city we have impervious structures that intercept rainwater. But the water we use and
intercept is returned within the catchment, to Lake Rotorua.
• After we use the freshwater supplied to our houses, the wastewater flows downs drains
and toilets in your house and through sewers (the sewerage system) to the Rotorua
Wastewater Treatment Plant.
• After our community intercepts rainwater (houses, roads and driveways etc), stormwater
flows down stormwater drains (these are the ones out on your roads in the gutters) and
through Rotorua’s Stormwater System to Lake Rotorua.
Are we using this precious resource wisely and are we doing all we can to prevent further
pollution and degradation of the lake? The Rotorua community has a Treatment Plant that
uses natural biological processes to treat the wastewater and then the liquid waste (effluent)
is sprayed onto land in Whakarewarwea Forest, within the Rotorua Catchment, so it can pass
through the soil to be cleansed and revitalised before it renters the lake.
FRESHWATER TO WASTEWATER
We depend on freshwater everyday for drinking, washing, farming and industry etc. The
Rotorua District Council, on our behalf, and with local consent, removes freshwater from the
natural environment around us, and supplies it to us for our use. We change it when we use it
by adding human waste, chemicals etc. The once potable freshwater becomes wastewater.
Sources of wastewater in Rotorua
The majority of wastewater in Rotorua is domestic and a small amount industrial. Stormwater
does not enter the sewerage system.
Domestic wastewater
Domestic wastewater comes from household activities such as bathing, dishwashing, clothes
washing, food preparation, and toilet wastes. Because domestic wastewater includes human
body wastes and organic material, it can be offensive and potentially dangerous in that it may
contain organisms responsible for such diseases as typhoid, dysentery, and infectious
hepatitis.
Industrial wastewater
Industrial wastewater comes from industries that use water for meat processing,
electroplating, and dairy, just to name a few. Industrial wastewater can be offensive and
dangerous, and it can also contain substances capable of causing expensive damage to sewers,
pumps and the Treatment Plant. Furthermore, poisons in industrial wastes can affect the
microorganisms responsible for the breakdown of wastewater in the treatment process.
8Why do we treat wastewater?
Wastewater has an extremely large number of water borne bacteria and pathogens. Many of
these can be responsible for life threatening diseases while others are completely harmless.
Wastewater is also nutrient-rich. It contains high levels of nitrogen (N) and phosphorus (P),
with N being mainly in the form of ammonia. It is these nutrients that have caused
deterioration of lake water quality. While the Wastewater Treatment Plant is no longer a
large source of the nutrient load to Lake Rotorua, the Treatment Plant uses natural biological
processes to remove as much N and P as possible. Then the final treated effluent is sprayed
onto the forest and the water passes through the soil before it enters the lake. The
composting facility uses natural materials and processes to produce a rich compost, and
nutrients can be returned to the land. Water can be cleaned naturally, but this takes time
and usually involves lower loads. The Wastewater Treatment Plant accelerates natural
processes.
Wastewater is almost entirely water, > 99.9%. It is only the other 0.1% that is
offensive and polluting. This 0.1% consists of both inorganic and organic material.
How does the wastewater get to the Treatment Plant?
When you flush your toilet the sewage flows through pipes in your house and on your section.
Once it passes you property boundary, it becomes the Council’s responsibility.
The sewage flows underground through pipes called sewers, the sewerage system or the
reticulation network. It flows down though gravity mains to various pump stations, which
pump water up through rising mains (pipes that travel ‘up-hill’). This reticulation process is
continually repeated until the wastewater reaches the Treatment Plant.
The wastewater treatment service area
The Rotorua Wastewater Treatment Plant has a connected population of approximately
57,000 people. An average of 19,000m3 or 19,000,000 litres of wastewater is treated per
day. By 2005 the Treatment Plant will have the capability of dealing with a population of
70,000 and a daily average wastewater intake of 27,000m3 per day.
The Rotorua Wastewater Reticulation Network (sewerage) covers approximately 3150 ha,
from the airport through the suburban areas including Ngongotaha and the Atiamuri Landfill.
The section on ‘future plans’ shows the areas that are planned to be reticulated in the near
future.
19,000 m3 (19,000,000 litres) is conveyed to the Wastewater Treatment Plant each
day through approximately 500 km of pipe, 7000 manholes and 53 pump stations.
9HISTORY OF ROTORUA’S WASTEWATER TREATMENT
SYSTEM
1891 The first sewers were laid in the town of Rotorua. Treatment was by septic tank, and
outfall was via sandfilters to Puarenga stream, which flows into Lake Rotorua.
1926 The sewerage system was replaced with larger sized pipes, and remained in use until
1969. Sewage travelled down to an original pumping station in Hinemaru Street,
where it was pumped to septic tanks near the site of the current Treatment Plant.
1935 Ohinemutu and Whakarewarewa were reticulated due to an outbreak of cholera, with
a separate septic tank built for Whakarewarewa. From 1935-1969 the suburbs of
Rotorua were also reticulated, including extensions of the sewerage system to Ford
Block and Western Heights.
1969 The population of Rotorua was 28,000 and the sewerage system served only 8000.
Loan proposal for $1,939,000 to extend the sewerage system and construct a
Treatment Plant to service 60,000, in 3 stages.
1973 Stage 1: an activated sludge Treatment Plant to service 20,000 people was
completed. It included facilities to screen and shred incoming sewage, grit
separation, primary sedimentation, aeration in the presence of sludge, secondary
sedimentation, sludge digestion and sludge disposal (?).
1975 Stage 2:
1973-1980 Ngongotaha and Eastern suburbs were reticulated.
1978 Stage 3: additional primary and secondary sedimentation tanks to service 60,000.
1979 Chemical phosphorus stripping was added to remove 70% of the phosphate.
1984 Proposal to discharge treated effluent to Kaituna river rejected.
1991 A major upgrade included the Bardenpho (biological treatment) followed by spray
irrigation to Whakarewarewa Forest.
1993 Composting began.
2005 A new laboratory.
2006 Bardenpho extended and commenced methanol dosing.
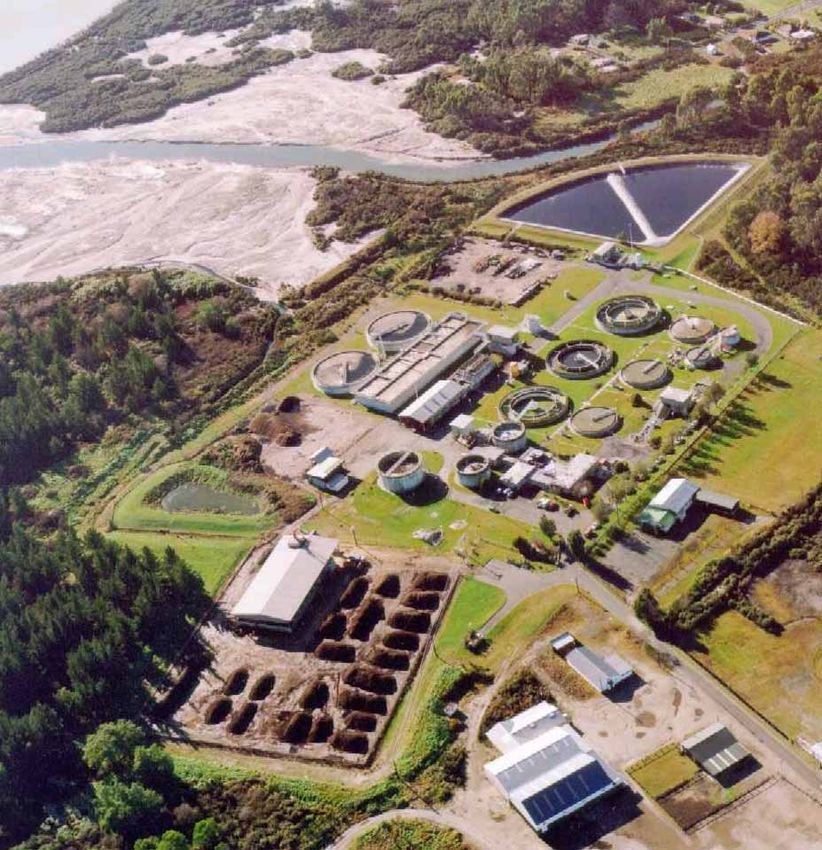
10ROTORUA WASTEWATER TREATMENT PROCESSES
Our Wastewater Treatment Plant provides preliminary, primary, and secondary treatment of
wastewater. Following these stages, the final effluent is spray-irrigated in Whakarewarewa
Forest, and sludge is processed and composted at the Treatment Plant.
The various stages of treatment are designed to effectively remove nutrients, bacterial
content, and solids. Typical composition of raw domestic wastewater and the composition of
Rotorua’s wastewater before and after treatment are appended. During treatment we
recycle as much of the waste products as possible while safely disposing the treated waste at
the end of the treatment process.
Preliminary treatment
Screening
Sewage passes through step screens consisting of metal bars with narrow gaps of 3mm to
remove objects such as plastics, rags, and even the odd set of false teeth or tennis ball!
These materials are disposed of at the landfill about once a week.
Grit removal
Grit removal is achieved with the use of two vortex pista grit traps. Particles such as sand
are removed and are either transported to the compost plant to be added to the compost mix
or disposed of at the landfill. It is important that grit is removed at this point as the
particles have the potential to damage the mechanical equipment should they continue
through the treatment process.
Primary treatment
Sedimentation
The preliminary treated wastewater is pumped to three sedimentation tanks for physical
separation to remove as many of the suspended solids as possible. The heavier suspended
solids settle to the bottom of the tank forming primary sludge, which is scraped to the
centre, removed, and pumped through a thickening and fermentation stage. Floatable
suspended solids, greases and fats, are skimmed from the surface and removed. The effluent
is pumped to the secondary treatment stage.
Concentration and fermentation
Primary sludge is concentrated in the thickener tank. A proportion of the sludge is pumped
to a fermenter tank to produce VFAs (volatile fatty acids) that are important in secondary
treatment. The sludge containing the VFAs then returned to the thickener tank.
Concentrated sludge settles to the bottom and is pumped to a storage tank to await
dewatering, while the effluent containing the VFAs is pumped to secondary treatment.
11Secondary treatment
Biological treatment
In a modified ‘Bardenpho’ process (developed by Dr James Barnard in South Africa),
microorganisms are suspended in the wastewater (‘activated sludge’), and through a
combination of aerobic, anoxic and anaerobic processes, convert remaining organic carbon
into stable inoffensive biological solids and remove phosphorus (P) and nitrogen (N). P is
absorbed by the microorganisms and removed, while N is converted to nitrogen gas.
The biological processes occur in 5 stages:
1. Fermentation (anaerobic – no oxygen)
VFAs are introduced as additional food for Control
Clarifier 5
the P-removing microorganisms. With a lot 4
room
5
of food and low dissolved-oxygen levels,
these microorganisms are stressed and 1
release the P from their cells. This 1 3
DAF’s
conditions them to uptake large quantities
2
of P later in the presence of oxygen.
2. 1st Anoxic Stage (no oxygen but Clarifier
nitrates present) 2
Nitrates are reduced (de-nitrification) and
Belt
Ngas is released into the atmosphere. At this press
stage 2/3 of nitrogen is removed from the room
3 3
wastewater. Microorganisms adsorb P onto
the surface of their cells. Biological Treatment
3. Aeration (aerobic – oxygen present) (Bardenpho)
Carbon dioxide is produced. Ammonia is converted to nitrates (nitrification). Some (4/5) of
the nitrogenous compounds are recycled back to the 1st anoxic stage for further de-
nitrification. Microorganisms absorb more phosphorus than was previously released, which
now remains within their cells.
4. 2nd Anoxic Stage (no oxygen but nitrates present)
Further de-nitrification.
5. Reaeration (oxygen present)
Super aeration provides sufficient oxygen for the time the microorganisms spend in the
clarifier. Excess microorganisms (10%) are continuously removed as WAS (Waste Activated
Sludge) in the DAF units, removing P and maintaining a constant population in the Bardenpho.
Final clarifiers
The activated sludge (containing the microorganisms) is settled out in clarifiers and returned
to the Bardenpho as RAS (Returned Activated Sludge). The treated final effluent flows to
two storage ponds (retention lagoons) before being pumped to the forest for land treatment.
12Sludge processing
WAS separation and thickening
The WAS (waste activated sludge) is removed from the secondary treatment stage using
DAF (dissolved air flotation) units. It is important to keep the WAS aerobic so the P is
retained and removed. Very fine bubbles of air are injected into one end of the DAF unit just
below the WAS inlet. As the fine bubbles rise to the surface, they attach themselves to the
solids in the WAS in much the same way as rising bubbles in a glass of lemonade stick to the
side of the glass. The WAS solids are lifted to the surface where they are scrapped off and
flow to a holding tank. The remaining effluent flows underneath the layer of sludge and is
pumped back to the Bardenpho. This process will thicken the sludge to 4-5% solids, which can
be dewatered using filter belt presses.
Dewatering
Sludge from primary treatment (primary sludge, 3-4% solids) and secondary treatment
(WAS, 2-4% solids) is dewatered using filter belt presses to reduce sludge weight and make
it easier to handle. Polyelectrolite, an organic chemical flocculent, is added to the sludge to
assist in dewatering. The sludge flows onto moving belt presses, and goes though three
stages:
• Conditioning Stage. The sludge flows onto the belt where scrapers spread and turn the
sludge. This allows the water to flow from the belt in the next stage.
• Gravity Stage. The water trickles through the fine holes in the belt.
• Compression Stage. The sludge is squeezed between two belts forcing the water through
small holes in the belt.
The water or filtrate produced in this stage is pumped back into the Bardenpho. The 9000t
of sewage sludge produced each year (16-20% solids) is scrapped off the belt and conveyed
to bins to be disposed of in landfill or to be composted.
Sludge use Compost production
Most of the sludge produced was composted in 10000
1998 and 1999. An increasing caution around the
use of sewage-derived compost caused the market 8000
to decline and recently only 10-15%% of the sludge
Compost produced (t)
produced is composted. 6000
4000
While most of the sludge is currently disposed of
in landfill, the Ministry for the Environment has a 2000
target for 95% of sewage-sludge to be beneficially
used. Other options are being investigated (see the 0
section on Towards a Greener Future”). 1998 1999 2000 2001 2002 2003 2004
13Composting Composting operation High quality, safe compost (Gardener’s Gold) is produced using guidelines produced buy NZWWA and MfE in August 2003 for stabilisation, sampling and analysis for pathogens, and contaminant limits. Sewage-sludge is mixed with untreated woodwaste and greenwaste from local operations, about 1/3 of each, and composted in aerated bins for around 3 weeks (a minimum of 15 days above 55OC) to reduce pathogens. The compost is then windrowed and turned weekly to eradicate ‘hot spots’, and for at least 2 weeks is kept above 40OC (average ≥ 45°C) to reduce volatile solids so flies and rodents (which carry disease) are not attracted and the potential for offensive odours is reduced. Before being available for use, it is stockpiled until 90 days have passed since it was first mixed, and tested to ensure that pathogenic bacteria limits are: E.coli < 100 MPN/g; Campylobacter < 1/25g; Salmonella < 1/25g; Enteric viruses < 1PFU/4g; & Helminth ova
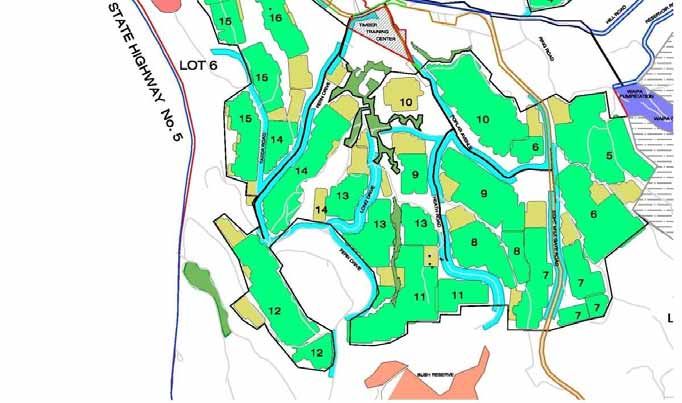
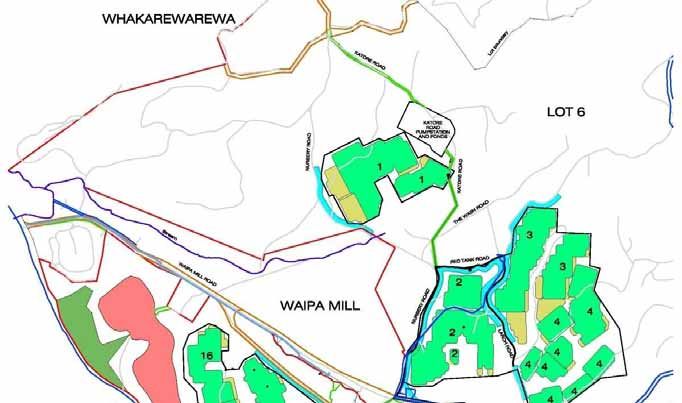
Land treatment of final effluent
To further reduce the nutrient (N and P) content before entering groundwater and streams,
and eventually Lake Rotorua, the treated final effluent is spray irrigated onto about 380 ha
in Whakarewarewa Forest. This is the largest effluent spray irrigation system in the
Southern Hemisphere.

System and operation
The treated final effluent is pumped from the Treatment Plant lagoons, to Whakarewarewa
Forest via a 3.3km long pipeline (66cm diameter), rising 120m vertically. The effluent is
mostly pumped overnight when electricity is cheaper. Holding ponds in the forest have two
days retention time (40,000m3) and balance continuous treatment at the plant with
intermittent spray irrigation. Pumps distribute the effluent through 24km of underground
pipes, then a 120km network of over-ground pipes in 16 blocks, and irrigate for approximately
2 hours (9mm) per day amongst the trees. Of the 16 blocks, 14 are used at any one time, and
the above ground pipework is easy to remove and reinstate when trees are felled.

Buffer zones
Spray areas have a 15m-wide vegetated buffer zone bordering forestry roads and public
walking tracks to reduce spray drift and to provide a visual and physical barrier to the
irrigation areas.

                               Effluent holding ponds in forest

                                              15
Map of Land Treatment Irrigation System
16ENVIRONMENTAL LABORATORY AND MONITORING
Monitoring and analysis by staff in an IANZ accredited laboratory ensures the system is
functioning effectively and warns if there are problems. Samples of effluent at various
stages, compost, groundwater and stream water are collected and analysed using a
combination of flow-proportional and grab samples, on-line and continuous analysers to
determine constituents. The laboratory is also responsible for monitoring Rotorua’s water
supplies and trade-waste, testing potable water supplies in and around Rotorua, and providing
analytical services for consultants and other organisations.
CURRENT PERFORMANCE OF THE WWTP
AND LAND TREATMENT SYSTEM
Sewage and WWTP effluent characteristics*
Raw sewage Primary effluent Final effluent
COD (g/m3) 470 280 44
3
BOD5 (g/m ) 195 125 5
3
Suspended solids (g/m ) 250 104 16
** 3
Total-N (g/m ) 47 6
3
Organic (g/m ) 15 12 2.3
3
Inorganic as NH4 (g/m ) 31 31 0.3
3
Inorganic as NOx (g/m ) 0 3.5
3
TKN (g/m ) 47 43 2.5
3
Total P (g/m ) 8 7 4
DRP (g/m3) 6 6 3
pH 7.6 7.6 7.6
Alkalinity 207 207 83
E. coli (/100ml) 9051
*
Mean for the year 1/10/05 – 30/9/06
**
Sum of TKN + NOx
Load of BOD, solids and nutrients in sewage, final effluent and Waipa Stream*
Raw sewage* Final effluent Waipa Stream
(to the forest) (sewage-derived)
kg/d t/a kg/d t/a kg/d t/a
BOD5 3700 1400 95 35
SS 4800 1750 311 115
N 900 330 104 38 81 30
P 160 59 68 25 1.2 0.4
*
Mean for the year 1/10/05 – 30/9/06
17N renovation through the Land Treatment System over time
120.0 Total-N sprayed to forest (IN)
Tonnes nitrogen (N) per annum
Soluble-N in Waipa stream (OUT)
100.0
EBOP Resource Consent Limit
80.0
60.0
40.0
20.0
0.0
1993 1994 1995 1996 1997 1998 1999 2000 2001 2002 2003 2004 2005 2006
P renovation through the Land Treatment System over time
40 Total-P sprayed to forest (IN)
Tonnes phosphorun(P) per annum
Soluble-P in Waipa stream (OUT)
35
EBOP Resource Consent Limit
30
25
20
15
10
5
0
1993 1994 1995 1996 1997 1998 1999 2000 2001 2002 2003 2004 2005 2006
The Land Treatment System
N-load to Lake Rotorua from
retains almost all of the P sewage and streams (Rutherford 2003)
applied. It now appears to now be
in equilibrium for nitrogen, with a
load around 30 tonnes of sewage-
derived soluble-N entering the
lake each year.
This is substantially lower than
the increasing amount of
nitrogen entering the lake via
streams as a result of 50-years
of intensive land-use within the
catchment.
18THE FUTURE
Any improvement in the amount of nutrients removed from our wastewater in an
environmentally sound way, is a move towards preventing further pollution and degradation of
the groundwater, streams and lakes in our environment.
We are working towards reducing the load of sewage-derived nutrients to the lake by:
1. Reticulating lakeside settlements;
2. Improvements at the Treatment Plant to reduce nutrients in the effluent;
3. Optimising renovation by the Land Treatment System.
Given the decline in the market for compost, we are also looking into other options to
beneficially use the sludge, rather than dumping it in the landfill.
Reticulation of lakeside settlements
Homes that are not connected to the sewerage system generally have septic tanks and these
have been found to leach nutrients to the groundwater. Environment Bay of Plenty has new
specifications for systems in some situations. The performance of Advanced On-Site
Treatment Systems is being assessed at the WWTP to determine if they meet the
specifications set by Regional Councils. This is a joint project between RDC, the Bay of Plenty
and Waikato Regional Councils and suppliers. Results are available to the public.
The planned sewerage systems (reticulation) for lakeside communities will also help prevent
nutrients reaching the lake. The wastewater from these communities will either come to the
main Treatment Plant, or to smaller satellite Treatment Plants.
The installation of sewerage networks, pump stations and Treatment Plants is planned for:
2005 Morea / Okawa Bay (complete)
2006 Brunswick
2006 Rotokawa
2008 Okere Falls and Otaramarae
2008 Gisborne Point and Hinehopu
2010 Hamurana
? Okareka and Tarawera
19PERSONNEL
A small, dedicated team of fourteen staff (excluding Council engineers) at the Treatment
Plant and 5 laboratory staff with specialist skills are based on-site and ensure that the
operation runs smoothly and performs to standard.
Utilities Plant Manager oversees the operation, administration, finances and maintenance.
Engineers design and direct any construction and modifications, and study factors that might
hinder treatment to ensure the process operates effectively.
Process Technicians oversee maintenance, are responsible for the control of the treatment
processes to maximise Treatment Plant effectiveness. They frequently communicate with
laboratory staff to assess test results to make decisions on process changes.
Plant Operators / Attendants ensure that all treatment process systems are maintained and
that no failures occur due to blockages, pump seizures, algae growth, and grease build-up etc.
This involves cleaning tanks, screens, valves, water lines, servicing pumps and generators.
Service and Goods Administrator purchases goods such as tools, safety equipment, uniforms,
stationery and office equipment, administers accounts and invoices, compiles timesheets, and
performs general reception duties.
Process/Data Analyst processes plant data and laboratory results for reporting for
Councillors, Resource Consents, State of the Environement, national databases etc, hosts
school groups and tours, and is involved in plant optimisation.
Cleaner is responsible for the administration building cleanliness. Relieves Service and Goods
Administrator’s reception duties. Provides a laundry service and cafeteria provisions.
Laboratory and Scientific Services Manager is responsible for managing the laboratory,
environmental impact investigations and reporting, research studies, wastewater treatment
investigations, and provides scientific advice to the council.
Laboratory Supervisor is responsible for the day-to-day running of the laboratory, the
laboratory information management systems, equipment calibration, workload, report
generation, method investigation and troubleshooting, maintaining laboratory equipment and
chemicals, and general office administration.
Laboratory Technicians collect and analyse samples at the Treatment Plant, in the forest
and for potable water monitoring.
All staff work five days per week, with some staff carrying out minimum duties on weekends
and public holidays.
20WWTP TECHNICAL DATA (2006)
General
Population connected 57,000
Population capacity with 2005 extension 75,000
Number of sewage pump stations 52
Length of pipework for reticulation 490 km
Average daily flow 19,000 m3
Peak daily wet weather flow 42,000 m3
Flow rate 100 – 450 L/s
Hydraulic residence time (mean) 24 hours
Sludge age (mean) 9-10 days
Treatment Plant land area 8 ha
Total replacement value (including pipes) $132 million
Plant dimensions
Primary tanks each (3) 1000 m3
Sludge thickener 260 m3
VFA fermenter 260 m3
Secondary treatment (Bardenpho) 7500 m3
Secondary clarifiers each (2) 3600 m3
Sludge-biosolids
Total sludge production 9000 t/a
Daily sludge production 25 t/day
DAF % solids 2.7 %
FBP (primary) % solids 25 %
FBP (WAS) % solids 15 %
FBP (mixed) % solids 16-20 %
Fraction landfilled / composted 1998 10 / 90 %
Fraction landfilled / composted 2005 90 / 10 %
Forest irrigation
Holding ponds (2) total volume 40,000 m3
Area available 380 ha
Area irrigated 240 ha
Wetland area 50 ha (scattered areas)
Buffer width 15 m
Irrigation frequency 2 hr/day
Application rate 5 mm/hr
Short term site permeability 100 mm/hr
Financial data
Capital value Operating Operating
($) ($/a) ($ per person/a)
Pump Stations (ex pipes) $5,000,000 $462,000 $8.11
Treatment Plant $30,000,000 $2,138,000 $37.51
Composting Plant $1,200,000 $93,000 $1.63
Land Treatment $15,000,000 $651,000 $11.42
21SCHEMATIC DIAGRAM OF ROTORUA WASTEWATER TREATMENT PLANT PROCESSES
22You can also read