Excellence Water Quality - Metropolitan Water District of Southern California
←
→
Page content transcription
If your browser does not render page correctly, please read the page content below
ANNUAL DRINKING WATER
             QUALITY REPORT
             Covering the reporting period
             of January - December 2018

Water Quality
Excellence
20
19
     Metropolitan’s water quality
     is equal to or better than
     what is required to safeguard
     public health.

             THE METROPOLITAN WATER DISTRICT
             OF SOUTHERN CALIFORNIA
Metropolitan is a regional wholesaler that provides water for 26 member
             public agencies to deliver—either directly or through their sub-agencies—
             to nearly 19 million people living in Los Angeles, Orange, Riverside,
             San Bernardino, San Diego and Ventura counties. The district imports
             water from the Colorado River and Northern California to supplement
             local supplies, and helps its members develop increased water conservation,
             recycling, storage and other resource-management programs.

             Colorado River water is conveyed via Metropolitan’s 242-mile Colorado
             River Aqueduct from Lake Havasu on the California-Arizona border, to
             Lake Mathews near Riverside. Water supplies from Northern California
             are released from Lake Oroville and drawn from the crossroads of the
             Sacramento and San Joaquin rivers. They are transported in the State
             Water Project’s 444-mile California Aqueduct and serve urban and
             agricultural customers in the San Francisco Bay Area, as well as Central
             and Southern California.

Frequent sampling helps protect water quality at
Diamond Valley Lake, Metropolitan’s largest reservoir.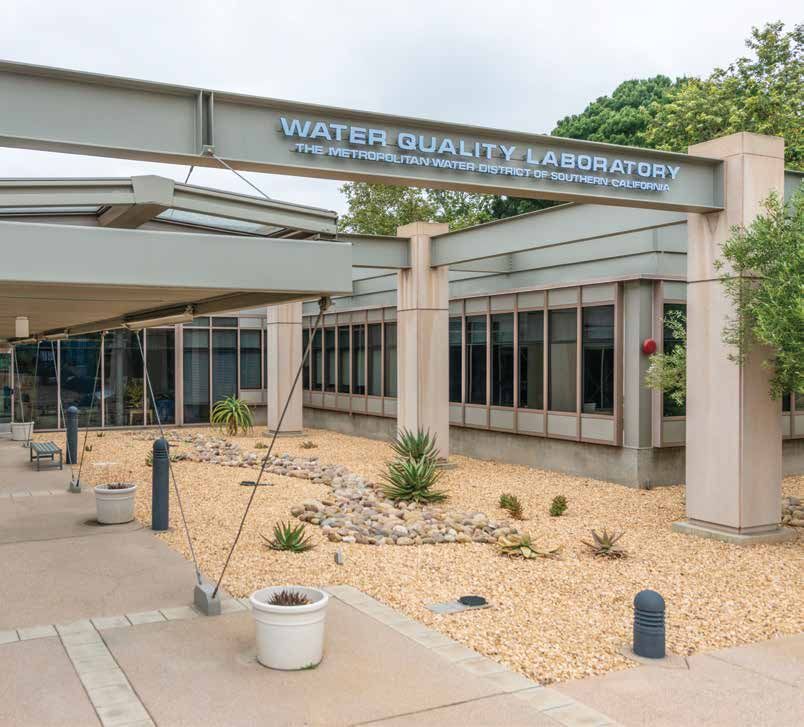
A LETTER FROM
THE GENERAL MANAGER
On behalf of the Metropolitan Water District of Southern California, I am
pleased to present this Annual Drinking Water Quality Report, which provides
a summary of water quality and monitoring data for 2018.
To help ensure the delivery of a safe and reliable water supply to the nearly
19 million people in its service area, Metropolitan tests its water for almost
400 constituents and performs nearly 250,000 water quality tests annually
on samples gathered throughout its vast distribution system. Analyses of
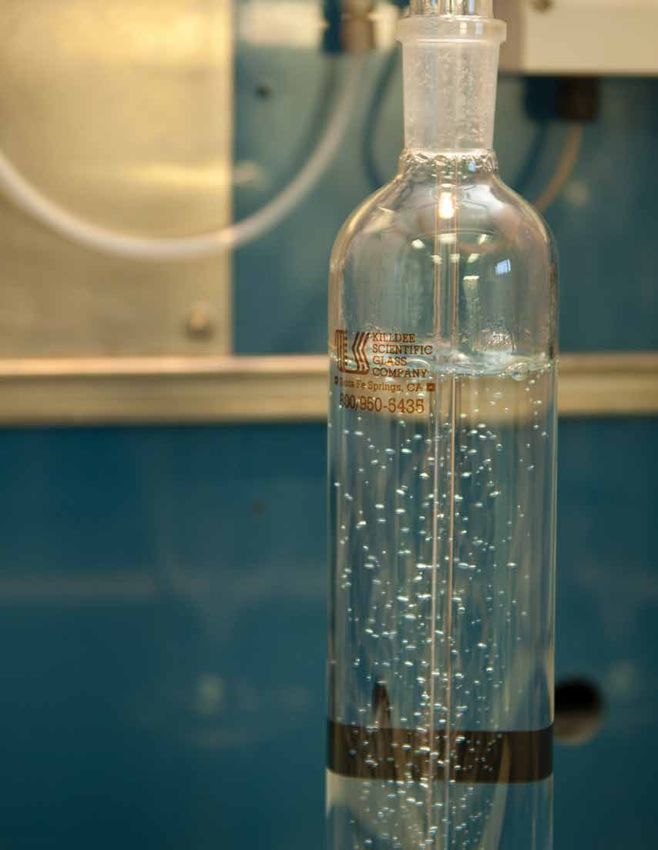
these samples are undertaken at Metropolitan’s Water Quality Laboratory.
Metropolitan has been a national leader in providing safe drinking water
that meets increasingly stringent standards. Cyanotoxins (produced by
cyanobacteria) were an emerging nationwide issue. Although tests confirmed
elevated levels of cyanotoxins at Diamond Valley Lake in 2018, the quality
of Metropolitan’s drinking-water supply remained unaffected. Metropolitan’s
Water Quality Laboratory in La Verne and smaller laboratories at the five
water treatment plants received high marks in a comprehensive audit
conducted under the state’s Environmental Laboratory Accreditation Program.
Metropolitan also worked on a testing and monitoring plan for the Regional
Recycled Water Advanced Purification Center, a demonstration facility that
will take cleaned wastewater from the Sanitation Districts of Los Angeles
County’s Joint Water Pollution Control Plant in Carson and apply a rigorous
purification process to ensure the water is safe to reuse in the future.
A core feature of this report is a detailed table that begins on page 10, which
illustrates monitoring results. Additionally, a Readers’ Guide is included to
help explain the data reported. To learn about other water quality and supply
issues, visit Metropolitan’s website at mwdh2o.com and go to the “About
Your Water” section. You may also contact Dr. Mic Stewart, Metropolitan’s
manager of water quality, at (213)217-5696 or mstewart@mwdh2o.com.
I trust you will find this report to be informative.
Sincerely,
Jeffrey Kightlinger
GENERAL MANAGER
1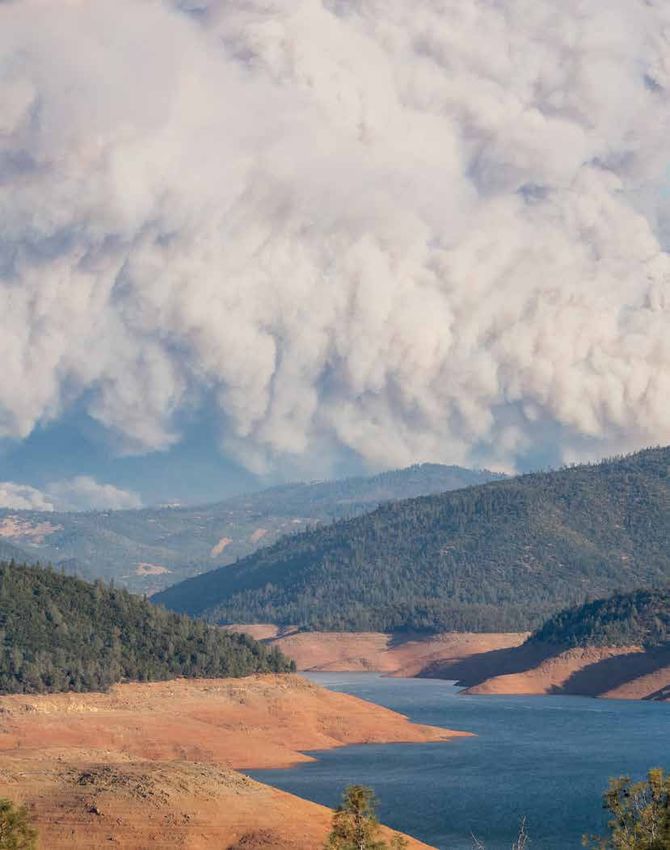
DRINKING WATER
                                                      AND YOUR
                                                      HEALTH
                                                      The sources of drinking water (both tap
                                                      water and bottled water) include rivers,
                                                      lakes, streams, ponds, reservoirs, springs
                                                      and wells. As water travels over the
                                                      surface of the land or through the ground,
                                                      it dissolves naturally occurring minerals
                                                      and, in some cases, radioactive material,
                                                      and can pick up substances resulting
                                                      from the presence of animals or from
                                                      human activity.

                                                      Drinking water, including bottled water,
                                                      may reasonably be expected to contain at
                                                      least small amounts of some contaminants.
                                                      The presence of contaminants does
                                                      not necessarily indicate that the water
                                                      poses a health risk. More information
                                                      about contaminants and potential health
                                                      effects can be obtained by visiting the
                                                      U.S. Environmental Protection Agency’s
                                                      website at www.epa.gov/safewater.

Sedimentation basins, like the one shown here at
Joseph Jensen Water Treatment Plant, are a key part
of the water treatment process.
B            F-                NO 3 -                                  Mg
                                                                                                                    Color
                                                               Boron       Fluoride            Nitrate                               Magnesium

                                                                                                                   Total
                                                                             Ca                                  Dissolved               K
                                                                                              Turbidity
                                                                           Calcium                                Solids             Potassium
                                                                                                                   (TDS)

CONTAMINANTS                                                                                     Na                SO 42-
                                                                                                                                     Threshold
                                                                                                                                       Odor
THAT MAY BE PRESENT                                                                            Sodium              Sulfate            Number
                                                                                                                                       (TON)
Water agencies are required to use the following
language to discuss the source of contaminants that
may reasonably be expected to be found in drinking
water, including tap water and bottled water.

Contaminants that may be present in source water include:

MICROBIAL CONTAMINANTS, such as viruses and bacteria,                  ORGANIC CHEMICAL CONTAMINANTS, including synthetic and
that may come from wastewater treatment plants, septic                 volatile organic chemicals, that are byproducts of industrial
systems, agricultural livestock operations and wildlife                processes and petroleum production, and can also come
                                                                       from gas stations, urban stormwater runoff, agricultural
                                                                       applications and septic systems
INORGANIC CONTAMINANTS, such as salts and metals, that
can be naturally occurring or result from urban stormwater
runoff, industrial or domestic wastewater discharges, oil and
gas production, mining or farming

                                                                       While not a source of Metropolitan supply, the Los Angeles River
                                                                       can generate significant stormwater runoff during wet winters.

       Salt (total dissolved solids): A perennial challenge.           RADIOACTIVE CONTAMINANTS that can be naturally occurring
                                                                       or be the result of oil and gas production and mining activities

PESTICIDES AND HERBICIDES that may come from a variety
of sources such as agriculture, urban stormwater runoff                To ensure that tap water is safe to drink, the U.S. Environmental
and residential uses                                                   Protection Agency and the State Water Resources Control Board,
                                                                       Division of Drinking Water, prescribe regulations that limit the
                                                                       amount of certain contaminants in water provided by public
                                                                       water systems. California Department of Public Health and
                                                                       U.S. Food and Drug Administration regulations also establish
                                                                       limits for contaminants in bottled water that provide the same
                                                                       protection for public health.

           Farm operations can be a source of both
            pesticides and organic contaminants.

                                                                                                                                            3
PROTECTING
WATER QUALITY
AT THE SOURCE
Source water protection is an important issue for all of California.
Large water utilities are required by the Division of Drinking Water
to conduct an initial source water assessment, which is then updated
through watershed sanitary surveys every five years. Watershed sanitary
surveys examine possible sources of drinking water contamination and
recommend actions to better protect these source waters. The most
recent surveys for Metropolitan’s source waters are the Colorado River
Watershed Sanitary Survey – 2015 Update, and the State Water Project
Watershed Sanitary Survey – 2016 Update.

Source waters used by Metropolitan — the Colorado River and State
Water Project — each have different water quality challenges. Both
are exposed to stormwater runoff, recreational activities, wastewater
discharges, wildlife, fires and other watershed-related factors that could
affect water quality. Treatment to remove specific contaminants can be
more expensive than measures to protect water at the source, which is
why Metropolitan and other water agencies invest resources to support
improved watershed protection programs.
In order to protect water quality, boaters and anglers enjoying the
                                                world-class fishery at Metropolitan’s Diamond Valley Lake are
                                                strictly prohibited from making body contact with the water.

                                               HEALTH ADVISORY FOR
                                               PEOPLE WITH WEAKENED
                                               IMMUNE SYSTEMS
                                               Although Metropolitan treats water to meet drinking water
                                               standards, some people may be more vulnerable to contaminants
                                               in drinking water than the general population. Immuno-compromised
                                               persons, including those with cancer undergoing chemotherapy,
                                               persons who have undergone organ transplants or have HIV/AIDS
                                               or other immune system disorders, some elderly, and infants can
                                               be particularly at risk from infections. These individuals should
                                               seek advice about drinking water from their health care providers.
                                               USEPA/Centers for Disease Control and Prevention guidelines on
                                               appropriate means to lessen the risk of infection by Cryptosporidium
                                               and other microbial contaminants are
                                               available at the USEPA Ground Water
                                               and Drinking Water website at
                                               www.epa.gov/safewater.

                                             Fluorescence microscopy to detect and
Wildfires, such as the Camp Fire seen near   identify microorganisms is one of the
Lake Oroville in November 2018, can pose     many Water Quality Lab functions.
challenges for watersheds.

                                                                                                                      5
READERS’ GUIDE TO THE
    WATER QUALITY TABLE                                                Highly-trained staff
                                                                       members taste and
    The cornerstone of the water quality report
    is a table that lists the results of year-round                    smell samples at the
    monitoring for nearly 400 constituents. Only the                   Water Quality Laboratory
    constituents that are found in the water monitored                 in La Verne as part of
    by Metropolitan above the state detection limit
                                                                       Metropolitan’s Flavor
    for reporting are listed in the table.
                                                                       Profile Analysis.
    Metropolitan met all primary drinking water
    standards in 2018.

    By reading the table on Page 10 from left to right, you will
    learn the level of a constituent found in Metropolitan’s
    water and how that compares with the allowable state and
    federal limits. You will also see the measured range and
    average of the constituent and where it likely originated.
    The questions and answers on this and the following page,
    lettered A through I, will explain the important elements
    of the table.

    A. What are the sources of water Metropolitan delivers?
         Metropolitan imports water from Northern California
         through the Sacramento-San Joaquin Delta via the State
         Water Project, and from the Colorado River through its
         Colorado River Aqueduct. The table shows the percentage
         of the total water delivered by Metropolitan that is from
         the State Water Project. The remainder is from the          B. What is in my drinking water?
         Colorado River.                                                  Your water may contain different types of chemicals
                                                                          (organic and inorganic), microscopic organisms (e.g.,
                                                                          bacteria, algae, protozoa, and viruses) and radioactive
                                                                          materials (radionuclides), many of which are naturally
                                                                          occurring. Health agencies require monitoring for these
                                                                          constituents because at certain levels they could result
                                                                          in short- and long-term health risks. The column marked
                                                                          “Parameter” lists the constituents found in the water
                                                                          from Metropolitan’s treatment plants.

                                                                     C.   How are constituents reported?
                                                                          “Units” describe how a constituent is reported. Usually
    This autosampler can
    confirm the presence                                                  constituent levels are measured in extremely tiny
    of certain taste-and-odor                                             quantities such as parts per million, parts per billion
    constituents detected                                                 and, in some cases, parts per trillion. Even small
    by Metropolitan’s
    Flavor Profile Panel.

6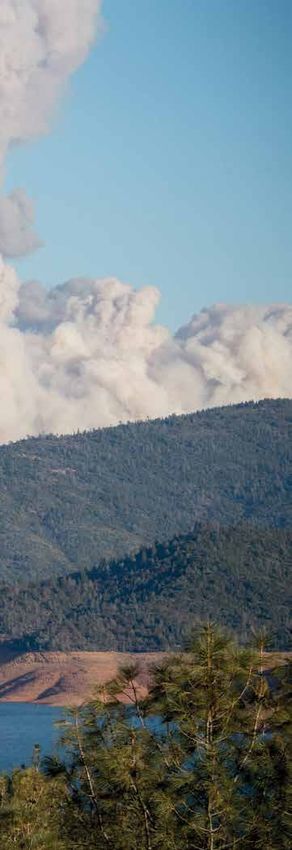
The MRDL is the level of a disinfectant added for water
                                                                     treatment that may not be exceeded at the consumer’s
                                                                     tap. While disinfectants are necessary to kill harmful
                                                                     microbes, drinking water regulations protect against
                                                                     too much disinfectant being added. Another constituent,
                                                                     turbidity, has a requirement that 95 percent of the
                                                                     measurements taken must be below a certain number.
                                                                     Turbidity is a measure of the cloudiness of the water.
                                                                     Metropolitan monitors turbidity because it is a good
                                                                     indicator of the effectiveness of our filtration system.

                                                                E.   Why are some of the constituents listed in the
                                                                     section labeled “Primary Standards” and others
                                                                     in the “Secondary Standards” section?
                                                                     Primary standards are developed for the purpose
                                                                     of protecting the public from possible health risks
                                                                     associated with exposure to health-compromising
                                                                     constituents. In general, no health hazard is reasonably
                                                                     expected to occur when levels of a constituent are
                                                                     below a primary MCL.

                                                                     Constituents that are grouped under the secondary
                                                                     standards section can affect the aesthetics (e.g.,
                                                                     appearance, taste and smell) of water. These
                                                                     substances are not reasonably expected to have
                                                                     any potential health-related impacts unless they
                                                                     also have a primary standard. Some constituents
                                                                     (e.g., aluminum) have two different MCLs, one to
                                                                     protect against health-related impacts, and another
   concentrations of certain constituents can be a health            to protect against non-health-related impacts.
   concern. That is why regulatory standards are set at
   extremely low levels for certain constituents.               F.   What are Public Health Goals (PHGs) and
                                                                     Maximum Contaminant Level Goals (MCLGs)?
D. What are the maximum allowed levels for constituents              PHGs and MCLGs are targets or goals set by regulatory
   in drinking water?
                                                                     agencies for the water industry. They define a constituent
   Regulatory agencies have maximum contaminant levels               level in the water that does not pose any known or
   (MCLs) for constituents so that drinking water is safe and        expected risk to health. Often, it is not possible to remove
   looks, tastes and smells good. A few constituents have            or reduce constituents to the level of PHGs and MCLGs
   the letters “TT” (treatment technique) in the MCL column          because it is technologically impossible or the cost for
   because they do not have a numerical MCL. Instead, they           treatment is so expensive that it would make tap water
   have certain treatment requirements that have to be               unaffordable. That is why PHGs and MCLGs are considered
   met to reduce their levels in drinking water. One of the          goals to work toward, and not realistic standards that
   constituents, total chlorine residual, has an MRDL                can be enforced. Similar goals exist for Maximum
   (maximum residual disinfectant level) instead of                  Residual Disinfectant Level Goals (see MRDLG, page 11,
   an MCL.                                                           Abbreviations and Definitions).

                                                                                                                                    7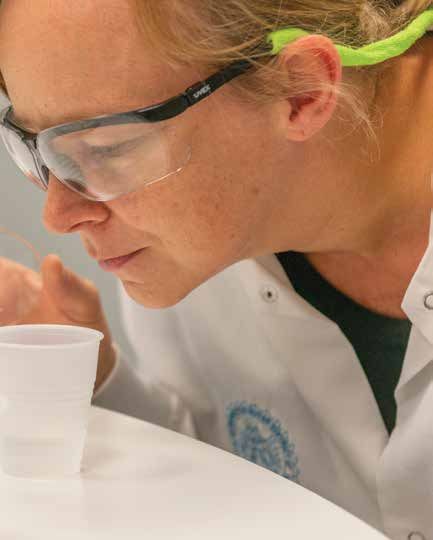
G. How do I know how much of a constituent is in my                         of the plants are listed. Typically, the F.E. Weymouth
       water and if it is at a level that is safe?                              Water Treatment Plant serves parts of Los Angeles
       With a few exceptions, regulatory requirements are                       County, the San Gabriel Valley and areas of Orange
       considered satisfied if the average amount of a                          County. The Robert B. Diemer Water Treatment Plant
       constituent found in tap water over the course of a                      also provides treated water to areas of Orange County
       year is no greater than the MCL. Some constituents                       and coastal Los Angeles. The Joseph Jensen Water
       do have special rules, described in the footnotes to                     Treatment Plant supplements local water supplies in
       the water quality table. These constituents do not                       the San Fernando Valley, Ventura County and central
       have a numerical MCL, but instead a required treatment                   Los Angeles. The Robert A. Skinner Water Treatment
       technique that when satisfied is listed in the column                    Plant serves western Riverside County, Moreno Valley
       for the treatment plant effluent and distribution                        and San Diego County. Finally, the Henry J. Mills Water
       system (Column “H” of the table). The highest and                        Treatment Plant also serves western Riverside County
       lowest levels measured over a year are shown in the                      and Moreno Valley.
       range. Requirements for safety, appearance, taste and
       smell are based on the average levels recorded and                  I.   How do constituents get into the water supply?
       not the range.                                                           The most likely source for each constituent is listed
                                                                                in the last column of the table. Some constituents
       Water agencies have specific procedures to follow if                     are natural and come from the environment, others
       a constituent is found at levels higher than the MCL                     come from cities and farms, and some result from
       and considered a potential threat to public health.                      the water disinfection process itself. Some chemicals
       Information is shared immediately with the regulatory                    have found their way into California’s water supplies,
       agencies. The regulatory agencies will determine when                    making water treatment more difficult. Certain industrial
       and how this information is shared with the public.                      processes — like dry cleaning, fireworks and rocket
                                                                                fuel manufacturing — have left constituents in the
    H. What are the areas served by each of Metropolitan’s                      environment, as has the use of certain fertilizers and
       treatment plants and its distribution system?                            pesticides. Many of these chemicals have since been
       Metropolitan operates five water treatment plants, and                   banned from use.
       the monitoring results for the supplies delivered by each

                                                                                                                               N

                                                                                                                           NOT TO SCALE

                                                                   SANTA
                                                                    ANA

        Metropolitan’s Service Area

8
METROPOLITAN’S
WATER TREATMENT
PLANTS
Metropolitan’s five water treatment
plants serve a six-county area with
a combined capacity of more than
2 billion gallons per day.
CASTAIC LAKE
(DWR)
INO COUNTY
5
COUNTY
RD
LOS ANGELES
Joseph Jensen . Granada Hills
SAN BER NA
JOSEPH JENSEN
WATER TREATMENT
PLANT SILVERWOOD LAKE
(DWR)
210
5
405
MORRIS
170 RESERVOIR
101
15
EAGLE ROCK 210 F.E. Weymouth . La Verne
LIVE OAK
CONTROL CENTER
RESERVOIR
5
101 605 ETIWANDA
110 RESERVOIR
MWD F.E. WEYMOUTH
10
UNION STATION WATER TREATMENT 10
SAN BERNARDINO
10
HEADQUARTERS PLANT 57 SAN BERNARDINO COUNTY
10
60 60
GARVEY RIVERSIDE COUNTY
SANTA
Henry J. Mills . Riverside
RESERVOIR
MONICA 71
710
405
5
ORANGE COUNTY
RESERVOIR HENRY J. MILLS 60
15 WATER TREATMENT
ROBERT B. DIEMER
PLANT
WATER TREATMENT
LAKE PERRIS
91 PLANT 91
605 91
LAKE MATHEWS
710 405 55
LONG BEACH
110
22
SANTIAGO
PALOS VERDES RESERVOIR
RESERVOIR
405 DIAMOND
5 VALLEY LAKE
Robert B. Diemer . Yorba Linda
55
SAN JOAQUIN EL TORO
RESERVOIR RESERVOIR
TY
Y
UN
NT
LAKE SKINNER
OU
CO
EC
GE
ROBERT A. SKINNER
ID
AN
RS
WATER TREATMENT
OR
VE
PACIFIC OCEAN PLANT
RI
Robert A. Skinner . Winchester 215
RIVERSIDE COUNTY
SAN CLEMENTE
SAN DIEGO COUNTY
92018 WATER QUALITY TABLE
B C D F G H I
State
(Federal) Range Diemer Jensen Mills Skinner Weymouth
Parameter Units MCL PHG Average Plant Plant Plant Plant Plant Major Sources in Drinking Water
Percent State Range 0–96 0–84 0–100
A Water Project
% NA NA
Average 34
100 100
34 36
NA
E PRIMARY STANDARDS - Mandatory Health-Related Standards
CLARITY
Combined Filter NTU Highest 0.07 0.06 0.08 0.08 0.06
TT NA Soil runoff
Effluent (CFE) Turbiditya % % ≤ 0.3 100 100 100 100 100
MICROBIOLOGICAL b
% Positive Distribution Systemwide: 0-0.3
5.0 Range
Total Coliform Bacteria c Monthly MCLG = 0 Naturally present in the environment
(TT) Average
Samples Distribution Systemwide: 0.1
Heterotrophic Plate Range ND–1 ND–1 ND–1
CFU/mL TT NA ND ND Naturally present in the environment
Count (HPC) Bacteriad Median ND ND ND
Range ND–1
Giardia e cysts/200 L TT MCLG = 0 ND ND ND ND Human and animal fecal waste
Average ND
INORGANIC CHEMICALS
Range ND–310 ND–75 ND–120 ND–100 ND–220 Residue from water treatment
Aluminum ppb 1,000 600
Highest RAA 124 ND 58 51 105 process; natural deposits erosion
Range Oil and metal refineries discharge;
Barium ppb 1,000 2,000 117 ND ND ND 118
Average natural deposits erosion
0.6–0.9 0.4–0.8 0.6–0.9 0.6–0.9 0.6–0.9
Range
Distribution Systemwide: 0.4-0.9
Fluoride f ppm 2.0 1 Water additive for dental health
0.7 0.7 0.7 0.7 0.7
Average
Distribution Systemwide: 0.7
Range Runoff and leaching from fertilizer
Nitrate (as Nitrogen) ppm 10 10 ND 0.5 0.6 ND ND
Average use; sewage; natural deposits erosion
RADIONUCLIDES g
Gross Alpha Particle Range ND–3 ND–4
pCi/L 15 MCLG = 0 ND ND ND Erosion of natural deposits
Activity Average ND ND
Gross Beta Particle Range ND–5 Decay of natural and
pCi/L 50 MCLG = 0 ND ND ND ND
Activity Average ND man-made deposits
Range ND–1 ND–3
Uranium pCi/L 20 0.43 ND ND ND Erosion of natural deposits
Average ND ND
DISINFECTION BYPRODUCTS, DISINFECTANT RESIDUALS, AND DISINFECTION BYPRODUCT PRECURSORS h
20–25 11–28 16–32 15–35 21–30
Total Trihalomethanes Range
Distribution Systemwide: 11-35 Byproduct of drinking
(TTHM) (Plant Core ppb 80 NA
Locations and 23 23 25 24 34 water chlorination
Distribution System ) Highest LRAA
Distribution Systemwide: 38
ND–7.2 1.5–5.0 3.4–21 1.2–18 1.8–9.5
Sum of Five Haloacetic Range
Acids (HAA5) (Plant Distribution Systemwide: ND-21 Byproduct of drinking
ppb 60 NA
Core Locations and water chlorination
5.8 6.0 9.4 8.6 16
Distribution System) Highest LRAA
Distribution Systemwide: 17
Range ND–4.7 ND–6.4 ND–10 ND–5.9 ND–10
Bromate i Byproduct of drinking
ppb 10 0.1
water ozonation
Highest RAA 2.0 5.2 3.7 3.7 5.0
Range Distribution Systemwide: 1.4-2.9 Drinking water disinfectant added
Total Chlorine Residual ppm MRDL=4.0 MRDLG=4.0
Highest RAA Distribution Systemwide: 2.4 for treatment
Various natural and man-made
Total Organic Carbon Range 2.1–2.7 2.0–2.6 1.6–3.2 2.0–2.7 2.1–2.8 sources; TOC is a precursor for
(TOC) ppm TT NA
Highest RAA 2.4 2.6 2.3 2.4 2.4 the formation of disinfection
byproducts
10B C D F G H I
State
(Federal) Range Diemer Jensen Mills Skinner Weymouth
Parameter Units MCL PHG Average Plant Plant Plant Plant Plant Major Sources in Drinking Water
E SECONDARY STANDARDS - Aesthetic Standards
Range ND–310 ND–75 ND–120 ND–100 ND–220 Residue from water treatment
Aluminum j ppb 200 600
Highest RAA 124 ND 58 51 105 process; natural deposits erosion
Range 92–95 54–57 79–91 90–93 96–97 Runoff/leaching from natural
Chloride ppm 500 NA
Average 94 56 85 92 96 deposits; seawater influence
Color Range ND–1 ND–1 ND–1 ND–1
Color 15 NA 1 Naturally-occurring organic materials
Units Average ND ND ND ND
Range
Manganese ppb 50 NL = 500 ND ND ND 22 ND Leaching from natural deposits
Average
Range 1–4 1–4
Odor Threshold k TON 3 NA 2 3 3 Naturally-occurring organic materials
Average 2 2
Range 852–961 428–444 514–518 841–851 897–1,010 Substances that form ions in water;
Specific Conductance µS/cm 1,600 NA
Average 906 436 516 846 954 seawater influence
Range 178–220 43–46 34–46 168–175 190–236 Runoff/leaching from natural
Sulfate ppm 500 NA
Average 199 44 40 172 213 deposits; industrial wastes
Total Dissolved Solids Range 523–607 239–244 272–283 510–526 553–639 Runoff/leaching from natural
ppm 1,000 NA
(TDS) l Average 565 242 278 518 596 deposits; seawater influence
Abbreviations and Definitions
Average Result based on arithmetic mean NTU Nephelometric Turbidity Units
CFE Combined Filter Effluent pCi/L picoCuries per liter
CFU Colony-Forming Units PHG Public Health Goal - The level of a contaminant in drinking water below which there
is no known or expected risk to health. PHGs are set by the California Environmental
HAA5 Sum of five haloacetic acids
Protection Agency.
HPC Heterotrophic Plate Count
ppb parts per billion or micrograms per liter (µg/L)
LRAA Locational Running Annual Average; highest LRAA is the highest of all Locational
ppm parts per million or milligrams per liter (mg/L)
Running Annual Averages calculated as average of all the samples collected within
a 12-month period. RAA Running Annual Average; highest RAA is the highest of all Running Annual Averages
calculated as average of all the samples collected within a 12-month period.
MCL Maximum Contaminant Level - The highest level of a contaminant that is allowed
in drinking water. Primary MCLs are set as close to the PHGs (or MCLGs) as is
economically and technologically feasible. Secondary MCLs are set to protect the Range Results based on minimum and maximum values; range and average values are the
odor, taste, and appearance of drinking water. same for samples collected once or twice annually.
MCLG Maximum Contaminant Level Goal - The level of a contaminant in drinking water SWRCB State Water Resources Control Board
below which there is no known or expected risk to health. MCLGs are set by the TON Threshold Odor Number
U.S. Environmental Protection Agency (USEPA).
TT Treatment Technique - A required process intended to reduce the level of a
MRDL Maximum Residual Disinfectant Level - The highest level of a disinfectant allowed contaminant in drinking water.
in drinking water. There is convincing evidence that addition of a disinfectant is
necessary for control of microbial contaminants. TTHM Total Trihalomethanes
MRDLG Maximum Residual Disinfectant Level Goal - The level of a drinking water µS/cm microSiemen per centimeter; or micromho per centimeter (µmho/cm)
disinfectant below which there is no known or expected risk to health. MRDLGs do Primary Standards (Primary Drinking Water Standards) - MCLs and MRDLs for contaminants
not reflect the benefits of the use of disinfectants to control microbial contaminants. that affect health along with their monitoring and reporting requirements, and
NA Not Applicable water treatment requirements.
ND Not Detected Secondary Standards - Requirements that ensure the appearance, taste and smell of drinking
water are acceptable.
NL Notification Level - Health-based advisory levels established by the state Division
of Drinking Water for chemicals in drinking water that lack MCLs. When chemicals
are found at concentrations greater than their notification levels, certain requirements
and recommendations apply.
Footnotes
(a) Metropolitan monitors turbidity at the CFE locations using continuous and grab samples. (g) Data are from samples collected in 2017. Metropolitan’s required triennial monitoring
Turbidity, a measure of cloudiness of the water, is an indicator of treatment performance. (2020–2022) will be performed in 2020.
Turbidity was in compliance with the TT primary drinking water standard and the secondary
(h) Compliance with the state and federal MCLs is based on RAA or LRAA, as appropriate.
drinking water standard of less than 5 NTU.
Plant core locations for TTHM and HAA5 are service connections specific to each of
(b) Per the state’s Surface Water Treatment Rule, treatment techniques that remove or the treatment plant effluents.
inactivate Giardia cysts will also remove HPC bacteria, Legionella, and viruses. Legionella
(i) Compliance with the state and federal bromate MCL is based on RAA. No MCL exceedance
and virus monitoring is not required.
occurred in the Mills or Weymouth treatment plant effluents.
(c) Compliance is based on at least 480 samples per month from treatment plant effluents
(j) Compliance with the state MCL for aluminum is based on RAA. No secondary standard
and the distribution system.
MCL exceedance occurred in the Diemer or Weymouth treatment plant effluents.
(d) All distribution system samples had detectable total chlorine residuals, so no HPC was
(k) Compliance with odor threshold secondary MCL is based on RAA. Treatment plants
required. Metropolitan monitors HPCs to ensure treatment process efficacy.
begin quarterly monitoring if annual monitoring results are above 3.
(e) A single Giardia cyst was detected in one sample from the filter effluent at the Skinner
(l) Metropolitan’s TDS compliance data are based on flow-weighted monthly composite
water treatment plant, prior to the treated water reservoir and addition of final disinfectant.
samples reported twice per year (April and October). The 12-month statistical summary
The monitoring method detects all cysts, regardless of whether they are alive or dead.
of flow-weighted data is reported in the “Other Detected Constituents That May be
The plant met all operational and regulatory requirements throughout the year, including
of Interest to Consumers.”
at the time of this single sampling event, and there was no regulatory violation.
(f) Metropolitan was in compliance with all provisions of the state’s fluoridation
system requirements. 11OTHER DETECTED CONSTITUENTS
THAT MAY BE OF INTEREST TO CONSUMERS
TREATMENT PLANT EFFLUENTS AND DISTRIBUTION SYSTEM
Range Diemer Jensen Mills Skinner Weymouth
Parameter Units NL Average Plant Plant Plant Plant Plant Major Sources in Drinking Water
Runoff/leaching of natural deposits;
Range 99–114 68–76 66–74 104–109 107–117 carbonate, bicarbonate, hydroxide,
Alkalinity (as CaCO3) ppm NA
Average 106 72 70 106 112 and occasionally borate, silicate,
and phosphate
Range 130 140 160 120 130 Runoff/leaching from natural deposits;
Boron ppb 1,000
Average industrial wastes
Range 52–65 19–21 16–20 54–58 57–69
Calcium ppm NA Runoff/leaching from natural deposits
Average 58 20 18 56 63
Calcium Carbonate
Range 1.6–9.2 1.0–1.9 0.4–1.5 0.8–11 0.9–9.1 Elemental balance in water; affected
Precipitation Potential ppm NA
Average 5.3 1.4 1.1 6.0 5.2 by temperature, other factors
(CCPP) (as CaCO3) a
Range Byproduct of drinking water
Chlorate ppb 800 30 29 ND 43 32
Average chlorination; industrial processes
Corrosivity as Range 12.2–12.4 11.9–12.1 12.3–12.4 12.2–12.5 Elemental balance in water; affected
— NA 12.0
Aggressiveness Index b Average 12.3 12.0 12.4 12.4 by temperature, other factors
Corrosivity Range 0.47–0.51 0.26–0.28 0.15–0.31 0.54–0.59 0.43–0.57 Elemental balance in water; affected
— NA
as Saturation Index c Average 0.49 0.27 0.23 0.56 0.50 by temperature, other factors
Runoff/leaching from natural deposits;
Range 219–262 84–94 86–98 218–238 233–274 sum of polyvalent cations, generally
Hardness (as CaCO3) ppm NA
Average 240 89 92 228 254 magnesium and calcium present in
the water
Range 21–25 9.5–9.9 11–12 21–22 23–26
Magnesium ppm NA Runoff/leaching from natural deposits
Average 23 9.7 12 22 24
N-Nitrosodimethylamine 10 Range ND ND ND 4.1 2.2 Byproduct of drinking water
ppt
(NDMA) PHG=3 Range Distribution Systemwide: ND-3.2 chloramination; industrial processes
pH Range 8.4–8.5 8.4–8.5 8.1–8.2 8.1–8.2
pH NA 8.1 NA
Units Average 8.5 8.5 8.2 8.1
Range 4.0–4.8 2.4–2.5 2.8–2.9 4.0–4.5 4.4–5.0 Salt present in the water;
Potassium ppm NA
Average 4.4 2.4 2.8 4.2 4.7 naturally occurring
Range 86–98 45–46 62–63 85–92 94–103 Salt present in the water;
Sodium ppm NA
Average 92 46 62 88 98 naturally occurring
Sum of Five Haloacetic Range 2.4–4.1 2.6–3.9 4.3–5.9 4.9–8.9 1.9–5.5 Byproduct of drinking water
ppb MCL = 60
Acids (HAA5) d Average 3.1 3.2 4.9 6.9 3.6 chlorination
Total Dissolved Solids Range 325–647 236–254 228–302 323–627 283–650 Runoff/leaching from natural
ppm MCL = 1,000
(TDS) e Average 516 243 272 504 514 deposits
Total Trihalomethanes Range 15–24 7.7–46 15–61 13–41 12–58 Byproduct of drinking water
ppb MCL = 80
(TTHM) d Average 19 15 25 21 23 chlorination
Abbreviations and Definitions Footnotes
(please refer to the main table for other abbreviations and definitions) (a) Positive CCPP = non-corrosive; tendency to precipitate and/or deposit scale on pipes. Negative
CCPP = corrosive; tendency to dissolve calcium carbonate. Reference: Standard Methods (SM2330)
AI Aggresiveness Index
CaCO3 Calcium Carbonate (b) AI ≥ 12.0 = Non-aggressive water; AI 10.0–11.9 = Moderately aggressive water; AI ≤ 10.0 = Highly
aggressive water. Reference: ANSI/AWWA Standard C400-93 (R98)
CCPP Calcium Carbonate Precipitation Potential
(c) Positive SI = non-corrosive; tendency to precipitate and/or deposit scale on pipes. Negative
NL Notification Level - The level at which notification
SI = corrosive; tendency to dissolve calcium carbonate. Reference: Standard Methods (SM2330)
of the public water system to SWRCB is required.
(d) HAA5 and TTHM noncompliance samples collected at treatment plant effluents.
ppt parts per trillion or nanograms per liter (ng/L)
(e) Statistical summary represents 12 months of flow-weighted data and values may be different
SI Saturation Index
than the TDS reported to meet compliance with secondary drinking water regulations.
12Metropolitan’s Water Quality Laboratory in La Verne has a national reputation for excellence.
ADDITIONAL STATE WATER RESOURCES CONTROL BOARD
DIVISION OF DRINKING WATER
CONSUMER INFORMATION
www.epa.gov/ccr
INFORMATION 1001 I Street
Sacramento, CA 95814 INFORMATION ON HOW DRINKING
(916) 449-5577 WATER STANDARDS ARE ESTABLISHED
Additional information about www.waterboards.ca.gov/drinking_water/certlic/ https://www.epa.gov/
drinking water safety and drinkingwater/Chemicalcontaminants.html dwstandardsregulations
standards can be found at: U.S. ENVIRONMENTAL PROTECTION AGENCY
OFFICE OF GROUND WATER AND DRINKING WATER
1200 Pennsylvania Avenue, NW
Mail Code 4606M
Washington, DC 20460-0003
https://www.epa.gov/ground-water-and-drinking-waterANNUAL DRINKING WATER
QUALITY REPORT
Covering the reporting period of
January - December 2018
This report is very important to read or
have translated. The sentences below
reflect the diversity of Metropolitan’s
Japanese
service area and read, “This report
contains important information about
your drinking water. Translate it, or speak
with someone who understands it.”
Khmer
Korean
Arabic
Polish
Chinese Sprawozdanie zawiera ważne informacje na temat jakości wody w Twojej
miejscowści. Poproś kogoś o przellurnaczenie go lub porozmawiaj z osobą
która je dobrze rozumie.
French Russian
Cé rapport contient des information importantes concernant votre eau
potable. Veuillez traduire, ou parlez avec quelqu’ un qui peut le comprendre.
German
Dieser Bericht enthält wichtige Informationen über die Wasserqualität Spanish
in Ihrer Umgebung. Der Bericht sollte entweder offiziell übersetzt Este informe contiene información importante acerca de su agua potable.
werden, oder sprechen Sie mit Freunden oder Bekannten, die gute Tradúzcalo o hable con alguien que lo entienda.
Englishchkenntnisse besitzen.
Tagalog
Greek Ang ulat na ito ay naglalaman ng mahahalagang impormasyon tungkol sa
pag-inom ng tubig. Mangyaring ipasalin ito, o kumausap sa isang taong
nakakaintindi nito.
Hindi Vietnamese
Metropolitan’s Board of Directors typically meets on the June 2019 . 3,000
second Tuesday of each month at the district’s downtown
Los Angeles headquarters building at 700 N. Alameda Street,
Los Angeles, adjacent to historic Union Station. More
information is available at www.mwdh2o.com.
Printed by MWD Imaging ServicesYou can also read