Lyttelton Port Company Channel Deepening Project Environmental Monitoring - Harbourwatch
←
→
Page content transcription
If your browser does not render page correctly, please read the page content below
Lyttelton Port Company
                                            Channel Deepening Project
                                             Environmental Monitoring

                                         Water Quality Environmental Monitoring
                                               Services – Monthly Report
                                                           December 2018

Phone: 61 7 4972 7530   |   Unit 3, 165 Auckland St   |   PO Box 1267, Gladstone QLD 4680   |
                                www.visionenvironment.com.au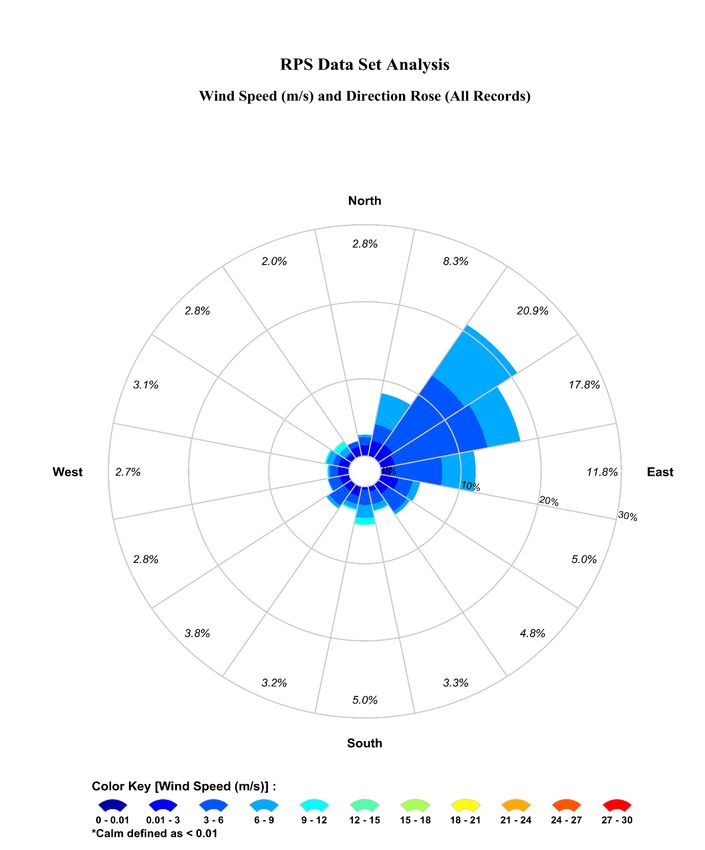
Lyttelton Port Company Water Quality Monitoring Monthly Report December 2018

REPORT CONTRIBUTORS

Role                      Team member
Project Management        Leonie Andersen
Fieldwork                 James Frazerhurst, Inshore Marine Support
Reporting & Review        Leonie Andersen, Felicity Melville, James Sadler

DOCUMENT CONTROL

Document draft                                Originated by             Edit and review            Date
Draft for Client review                           JS, FM                        LA              09/01/2019
Final report to Client                              LA                         FM               10/01/2019

CITATION
This report should be cited as:
Vision Environment (2019). Lyttelton Port Company Channel Deepening Project Water Quality
Environmental Monitoring - Monthly Report – December 2018. Vision Environment, Gladstone, QLD,
Australia.

DISCLAIMER
Every care is taken to ensure the accuracy of the data and interpretation provided. Vision
Environment makes no representation or warranties about the accuracy, reliability, completeness or
suitability for any particular purpose, and disclaims all responsibility and all liability for all expenses,
losses, damages which may be incurred as a result of this product being inaccurate.

FILE REFERENCE
10012019_FINAL LPC Water Quality Environmental Monitoring December 2018_VE

                                                  Page i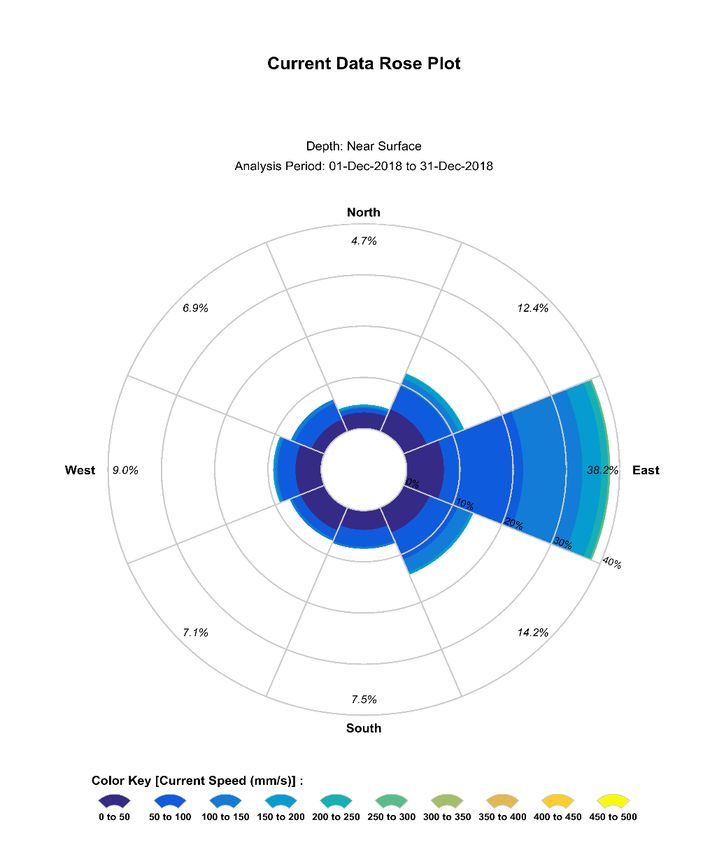
Lyttelton Port Company Water Quality Monitoring Monthly Report December 2018

Summary
Since September 2016, Vision Environment (VE) has been undertaking water quality
monitoring for the Environmental Monitoring and Management Plan (EMMP) associated with
the Lyttelton Port Company (LPC) Channel Deepening Project (CDP) (Envisor, 2018).
Baseline datasets were acquired from three spoil ground sites (SG1, SG2 and SG3), seven
offshore sites (OS1 to OS7) and five inshore sites (UH1 to UH3, CH1 and CH2) to assess
potential impacts of the dredging project.
Construction works as part of the ‘Lyttelton Harbour wastewater scheme’ which commenced
in July 2018, were completed on 14 December 2018. Dredging operations for the CDP,
which commenced on 29 August 2018 were also completed on 29 November 2018, taking
the monitoring into a post dredge phase. Continuing with the dredge phase monitoring report
format, the monthly report includes comparisons of turbidity data collected during the initial
baseline monitoring period from 1 November 2016 to 31 October 2017 (Fox, 2018).
Monitoring results collected during December 2018 are presented within this report. This
includes KZ filtered data, which although not applicable to the post dredge phase, was
compared to compliance trigger values during dredging operations.
Climatic Conditions: Rainfall at Cashin Quay during December 2018 totalled 38.2 mm,
lower than precipitation levels (58 mm) experienced the previous month. Climatic conditions
in December were considered fairly mild compared to conditions in November, where
stronger wind speeds and a large flow from the Waimakariri River resulted in significant
changes in a number of physiochemical parameters at all sites. Mean inshore wind speeds
ranged from 4.8 to 10.9 knots with highest wind speeds in the first week of December. Peak
wave heights of 2.0 m also occurred on 1 December. Air temperatures continued the
seasonal warming trend, with a monthly average of 16°C, approximately 3°C higher than in
November.
Currents: ADCP units at sites SG1 and SG3 remained offline during December 2018 and
are scheduled for maintenance in early 2019. Current data received from the Watchkeeper
buoy at SG2a is included within this report.
Coinciding with highest monthly wave heights and wind speeds in the first week of
December, maximum near-surface current velocity reached 342 mm/s at the near surface on
4 December and 286 mm/s near the seabed on 1 December. As typically observed the
monthly mean current speed was higher at the near-seabed than at the surface with
velocities overall lower than those observed during the more challenging sea states of
November. Consistent with previous directional data acquired from SG1 and SG3, currents
at SG2a displayed a strong dominance of flow along a west to east axis.
Turbidity: Consistent with previous results, turbidity was higher at the inshore monitoring
sites of the central and upper harbour, than at nearshore and offshore monitoring locations.
Mean turbidity values for December in addition to percentile statistics were lower than they
were during the previous months and lower than those recorded during the baseline
monitoring period, reflecting calmer sea states. Flocculation of fine sediments which
occurred in mid-November at inshore sites after freshwater inundation from the Waimakariri
River, is likely to have removed the fine sediments that were previously available for
resuspension resulting in lower inshore turbidity.

                                           Page ii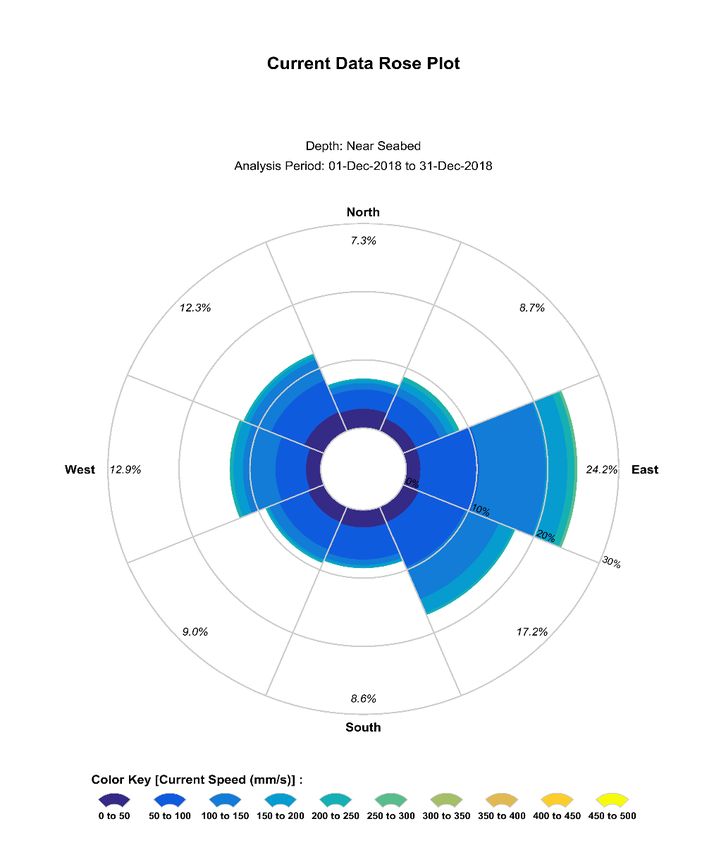
Lyttelton Port Company Water Quality Monitoring Monthly Report December 2018

Continuing previous monthly trends, turbidity at site CH2 located in the southern harbour
tended to be overall lower than other inshore sites. Site UH2 which had previously also
displayed overall lower values until mid-November, continued to trend with other inshore
sites during December. Turbidity at offshore and spoil ground sites remained fairly stable
after the first week in December, responding to increased wind and wave events as typically
observed. Benthic turbidity units trended similarly to one another but were more volatile than
their surface cohorts.
Other Physicochemical Parameters: Monthly mean surface water temperatures around
Lyttelton Harbour continued the warming trend observed during the previous months.
Reversing the spatial relationship between sites during austral winter, the warmest
temperatures continued to be recorded in the shallow waters of the upper and central
harbour. Brief periods of cooling were observed during the main rainfall period in mid
December. Additionally, declines in water temperatures in both surface and benthic units
were observed from 7 December in response to cooler overnight minimums, particularly at
the more southern offshore sites. Benthic temperatures which were once again up to several
degrees cooler than those of the surface, took longer to recover from the cooling period than
did their surface counterparts.
Consistent with previous reports, pH during December did not display any particular spatial
or temporal patterns across the monitoring network. Conductivity in December was much
more stable compared to the volatility recorded in November as a result of freshwater
inundation from the Waimakariri River. Declines in conductivity occurred on three occasions
in December at the most northern offshore sites, which appeared not entirely related to the
limited flow events from the Waimakariri River. Conductivity in December was overall lower
than the previous month as a result of the lasting effect of the previous months freshwater
intrusion. Benthic conductivity was overall higher and more stable than that at the surface
as typically observed.
Dissolved oxygen (DO) concentrations were far more stable and slightly more elevated in
December than in the previous month. DO trended with temperature also declining in
response to the cooler overnight ambient temperatures on 7 December. Similar to
temperature, DO at benthic sites took longer to recover from this event than DO at the
surface. Increased cloud cover and lower air temperatures is likely to have resulted in
reductions in photosynthesis and thus oxygen generation. Similarly, DO peaked particularly
during periods of higher air temperatures during daylight hours later in the month.
Water Sample Analysis and Depth Profiling: Discrete water sampling was conducted in
conjunction with vertical profiling of the water column on 12 December. Similar to the profiles
typically obtained during the monitoring program, the inner harbour monitoring sites
indicated a well-mixed water column. This is in contrast from November where gradients
occurred with depth for some parameters. Benthic waters at these sites were characterised
by slight increases in turbidity near the seabed. Slightly fresher surface waters were
observed at site CH2 that may represent a residual signal from Waimakariri outflow
intrusions into the harbour reported during November.
Outside of Lyttelton Harbour, vertical profiling of the nearshore and offshore sites indicated
warmer, fresher surface waters overlying the cooler, more saline benthic environment. Both
regions displayed lower pH and DO conditions near the benthos, which may be a
representation of respiration associated with microbial degradation of sinking organic matter.
As commonly observed throughout the monitoring program, turbidity at most of these

                                           Page iii
Lyttelton Port Company Water Quality Monitoring Monthly Report December 2018
monitoring sites also increased towards the seabed. However, due to the greater water
depth than within the harbour, such increases in benthic turbidity did not have a notable
influence on the calculations of vertical light attenuation.
Turbidity and total suspended solids (TSS) measurements for surface waters were again
elevated at inshore sites compared to the offshore areas, resulting in the shallowest
estimations of the euphotic depth as typically recorded during the monitoring program.
However, turbidity and TSS overall was at some of the lowest recorded for the project. As a
result, euphotic depth at the spoil ground was high; estimated to be at 42.6 m at SG3. No
exceedances of WQG were observed for sub-surface turbidity during the December
sampling.
Total phosphorous and dissolved reactive phosphorous concentrations were higher inshore
and decreased with increasing distance offshore as commonly found. Concentrations of total
nitrogen and total kjeldahl nitrogen remained below detection limits at all sampling sites.
Nitrogen oxides were also below LOR and total ammonia at low levels at all sites.
Concentrations of chlorophyll a, an indicator of phytoplankton biomass, were low at all sites
and below WQG across the harbour indicating a reduction from the previous month.
In contrast to previous months, total aluminium concentrations which typically exceed
designated WQG at most sites, were only above the WQG at inshore sites in addition to the
OS1 and OS2 at the harbour entrance. Dissolved aluminium followed a similar trend
indicating that some of aluminium present was not associated with particulate matter and
thus deemed biologically available. Regardless, none of the dissolved concentrations were
above WQG, as were the remaining metals with designated WQG. This included dissolved
copper which commonly exceeds WQG at a handful of sites.
While no WQG are available for iron, concentrations were low and similar to those in
November which were a large decrease from the elevated concentrations recorded during
September and October 2018. The reduction in both total aluminium and iron in November
and December may be a result of the settling of suspended sediment particles due to the
flocculation process associated with fresh water inundation in November. Similar to patterns
observed during previous months and the baseline monitoring phase, manganese, vanadium
and molybdenum concentrations were detected within the inshore and nearshore
environments.
All organic compounds measured biannually in and around Lyttelton Harbour were once
again below laboratory limits of reporting.
Benthic Photosynthetically Active Radiation (BPAR): Levels of ambient sunlight during
December, in terms of the monthly mean and the range, were lower than that experienced in
November, despite longer day lengths.
Elevated surface turbidity was observed at both sites during the first week of the month, and
this particulate matter limited benthic light availability at the time. However, once surface
turbidity declined, elevated BPAR intensities were recorded particularly between 11 and 17
December, before rainfall events increased cloud cover. Monthly mean BPAR was greater at
OS2; despite the slightly deeper water depth. Spatial variations in benthic light intensity
between sites was high, as was variability between BPAR and ambient solar radiation
measured in Christchurch. These differences highlight the complexities of BPAR through the
integrated effects of the overlying water column.
Page ivLyttelton Port Company Water Quality Monitoring Monthly Report December 2018
Sedimentation: During the first week of December, bed level at the harbour entrance was
variable, most likely due to elevated offshore wave heights that were recorded during this
time. Following a reduction in waves and offshore wind speeds, bed level stabilised to
around 10 December and then indicated a period of steady rate sediment deposition for the
remainder of the month. During December, there was a net deposition of 23 mm of sediment
onto the seafloor at OS2.
Unfortunately, equipment malfunction prevented the acquisition of altimeter data during the
first 10 days of December, when bed level at the harbour mouth exhibited notable variability.
However, in a similar manner to OS2, bed level at UH3 displayed a steady increase from 10
to 23 December. As easterly inshore wind speeds increased during the final week of
December, the upper harbour experienced a period of sediment erosion. This removal of
sediment from the seafloor resulted in a reduced net bed level change of +12 mm.
Page vLyttelton Port Company Water Quality Monitoring Monthly Report December 2018
Table of Contents
1 INTRODUCTION ........................................................................................................... 1
2 METHODOLOGY........................................................................................................... 1
2.1 Approach ................................................................................................................ 1
2.1.1 Monitoring Locations and Equipment ............................................................... 1
2.1.2 Water Quality Guidelines ................................................................................. 4
3 RESULTS & DISCUSSION ............................................................................................ 4
3.1 Metocean Conditions .............................................................................................. 4
3.1.1 Wind and precipitation ..................................................................................... 4
3.1.2 Currents ........................................................................................................... 6
3.2 Continuous Physicochemistry Loggers ................................................................... 8
3.2.1 Turbidity ........................................................................................................... 8
3.2.2 Temperature .................................................................................................. 16
3.2.3 pH .................................................................................................................. 20
3.2.4 Conductivity ................................................................................................... 23
3.2.1 Dissolved oxygen ........................................................................................... 26
3.3 Physicochemistry Depth Profiling & TSS............................................................... 28
3.4 Continuous BPAR Loggers ................................................................................... 36
3.5 Continuous Sedimentation Loggers ...................................................................... 37
3.6 Water Samples ..................................................................................................... 40
3.6.1 Nutrients ........................................................................................................ 40
3.6.2 Total and Dissolved Metals ............................................................................ 40
3.6.3 Organics ........................................................................................................ 48
4 REFERENCES ............................................................................................................ 57
5 APPENDIX................................................................................................................... 58
Page viLyttelton Port Company Water Quality Monitoring Monthly Report December 2018
List of Tables
Table 1 Summary of monitoring sites and deployment equipment for the LPC Channel Deepening
Project. .................................................................................................................................................... 3
Table 2 Parameter statistics for ADCP at SG2a (WatchKeeper buoy) during December 2018. ........... 6
Table 3 Mean turbidity and statistics at inshore water quality logger sites during December 2018 and
Baseline period (1 November 2016 to 31 October 2017). ...................................................................... 9
Table 4 Mean turbidity and statistics at spoil ground water quality logger sites during December 2018
and Baseline period (1 November 2016 to 31 October 2017). ............................................................... 9
Table 5 Mean turbidity and statistics at offshore water quality logger sites during December 2018 and
Baseline period (1 November 2016 to 31 October 2017). .................................................................... 10
Table 6 Mean temperature at inshore, spoil ground and offshore water quality sites during December
2018. ..................................................................................................................................................... 17
Table 7 Mean pH at inshore, spoil ground and offshore water quality sites during December 2018. .. 20
Table 8 Mean conductivity at inshore, spoil ground and offshore water quality sites during December
2018. ..................................................................................................................................................... 23
Table 9 Mean dissolved oxygen at inshore, spoil ground and offshore water quality sites during
December 2018. .................................................................................................................................... 26
Table 10 Discrete physicochemical statistics from depth-profiling of the water column at inshore sites
during the December 2018 sampling event. ......................................................................................... 30
Table 11 Discrete physicochemical statistics from depth-profiling of the water column at offshore sites
during the December 2018 sampling event. ......................................................................................... 31
Table 12 Discrete physicochemical statistics from depth-profiling of the water column at offshore and
spoil ground sites during the December 2018 sampling event. ............................................................ 32
Table 13 Total Daily PAR (TDP) statistics during December 2018. ..................................................... 36
Table 14 Net Bed Level Change statistics from data collected from altimeters deployed at OS2 and
UH3 during December 2018. ................................................................................................................ 38
Table 15 Concentrations of nutrients and chlorophyll a at monitoring sites during December 2018. .. 41
Table 16 Total and dissolved metal concentrations at inshore monitoring sites during December 2018.
.............................................................................................................................................................. 43
Table 17 Total and dissolved metal concentrations at offshore monitoring sites during December
2018. ..................................................................................................................................................... 44
Table 18 Total and dissolved metal concentrations at spoil ground monitoring sites during December
2018. ..................................................................................................................................................... 45
Table 19 Organic compound concentrations at monitoring sites during December 2018. .................. 49
Table 20 Mean KZ filtered turbidity and statistics at inshore water quality logger sites during
December 2018 and baseline period 1 November 2016 to 31 October 2017 ...................................... 65
Table 21 Mean KZ filtered turbidity and statistics at spoil ground water quality logger sites during
December 2018 and baseline period 1 November 2016 to 31 October 2017. ..................................... 65
Table 22 Mean KZ filtered turbidity and statistics at offshore water quality logger sites during
December 2018 and baseline period 1 November 2016 to 31 October 2017. ..................................... 66
Table 23 Summary of Vision Environment quality control data for December 2018 water sampling. . 67
Page viiLyttelton Port Company Water Quality Monitoring Monthly Report December 2018
List of Figures
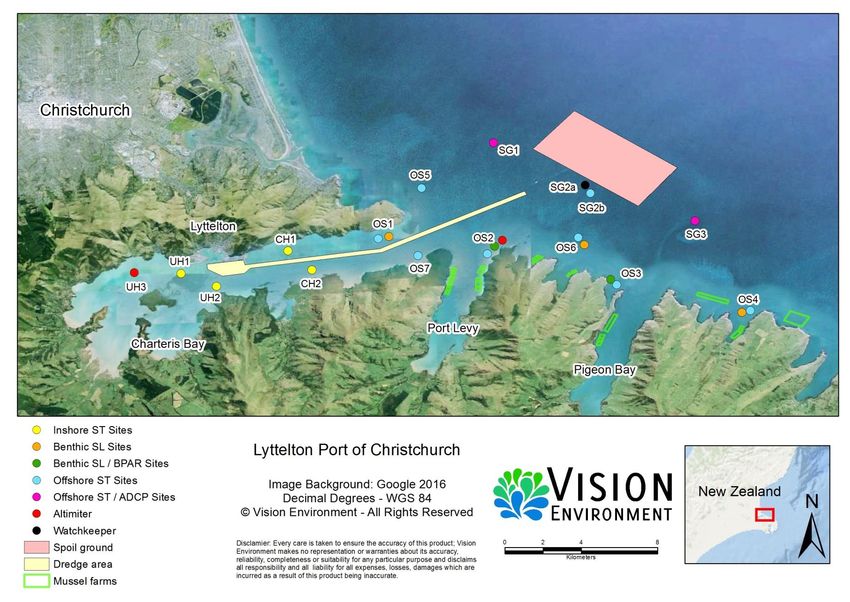
Figure 1 Monitoring locations for the LPC Channel Deepening Project, displaying sites within each
location. ................................................................................................................................................... 2
Figure 2 Inshore metocean conditions, including daily averaged wind speed and direction, rainfall
measured at Cashin Quay, and Waimakariri River flow at the Old Harbour Bridge station, during
December 2018. ...................................................................................................................................... 5
Figure 3 Offshore metocean conditions, including wind speed and direction, significant wave height
and daily averaged wave direction as measured by the WatchKeeper Buoy at site SG2a, and
Waimakariri River flow at the Old Harbour Bridge station, during December 2018................................ 5
Figure 4 WatchKeeper near-surface and near-seabed current speed and direction during December
2018. ....................................................................................................................................................... 7
Figure 5 24 hour rolling average turbidity and metocean data for inshore, nearshore, offshore and
benthic monitoring stations. .................................................................................................................. 11
Figure 6 Surface turbidity and inshore daily averaged winds at inshore sites (UH1, UH2, CH1 and
CH2) during December 2018. ............................................................................................................... 12
Figure 7 Surface and benthic turbidity and daily averaged winds at offshore sites (OS1 and OS2)
during December 2018.......................................................................................................................... 13
Figure 8 Surface and benthic turbidity and daily averaged winds at offshore sites (OS3 and OS4)
during December 2018.......................................................................................................................... 14
Figure 9 Surface turbidity and daily averaged winds at offshore sites (OS5, OS6 and OS7) during
December 2018. .................................................................................................................................... 15
Figure 10 Surface turbidity at spoil ground sites (SG1, SG2b and SG3) during December 2018. ...... 16
Figure 11 Surface temperature at inshore (UH1, UH2, CH1 and CH2) and spoil ground (SG1, SG2b
and SG3) water quality sites and rainfall during December 2018......................................................... 18
Figure 12 Surface temperature (OS1 to OS7) and benthic temperature (OS1 to OS4 and OS6) at
offshore water quality sites during December 2018. ............................................................................. 19
Figure 13 Surface pH at inshore (UH1, UH2, CH1 and CH2) and spoil ground (SG1, SG2b and SG3)
water quality sites during December 2018. ........................................................................................... 21
Figure 14 Surface pH (OS1 to OS7) and benthic pH (OS1 to OS4) at offshore water quality sites
during December 2018.......................................................................................................................... 22
Figure 15 Surface conductivity at inshore (UH1, UH2, CH1 and CH2) and spoil ground (SG1, SG2b
and SG3) water quality sites during December 2018. .......................................................................... 24
Figure 16 Surface conductivity (OS1 to OS7) and benthic conductivity (OS1 to OS4 and OS6) at
offshore water quality sites during December 2018. ............................................................................. 25
Figure 17 Surface DO at inshore (UH1, UH2, CH1 and CH2) and spoil ground (SG1, SG2b and SG3)
water quality sites during December 2018. ........................................................................................... 27
Figure 18 Surface DO (OS1 to OS7) and benthic DO (OS1 to OS 4 and OS6) at offshore water
quality sites during December 2018. ..................................................................................................... 28
Figure 19 Depth-profiled physicochemical parameters at sites UH1, UH2, UH3, CH1 and CH2 on 12
December 2018. .................................................................................................................................... 33
Figure 20 Depth-profiled physicochemical parameters at sites OS1, OS2, OS3, OS4 and OS7 on 12
December 2018. .................................................................................................................................... 34
Figure 21 Depth-profiled physicochemical parameters at sites SG1, SG2, SG3, OS5 and OS6 on 15
December 2018. .................................................................................................................................... 35
Figure 22 Total daily BPAR at OS2 and OS3 during December 2018 compared to ambient PAR and
corresponding surface turbidity. ............................................................................................................ 37
Figure 23 Mean instantaneous and daily averaged bed level change at OS2 and UH3 during
December 2018 compared to ambient surface turbidity (24 hour rolling average) wind speed and
direction. ................................................................................................................................................ 39
Figure 24 Nutrient and chlorophyll a concentrations at monitoring sites during December 2018. ...... 42
Page viiiLyttelton Port Company Water Quality Monitoring Monthly Report December 2018
Figure 25 Total aluminium, total iron, and total and dissolved manganese concentrations at
monitoring sites during December 2018. .............................................................................................. 46
Figure 26 Total and dissolved molybdenum and vanadium concentrations at monitoring sites during
December 2018. .................................................................................................................................... 47
Figure 27 WatchKeeper wind speed (m/s) and direction rose (%) during December 2018. ............... 58
Figure 28 SG2a current speed, direction and shear bed stress 1 to 16 December 2018. .................. 59
Figure 29 SG2a current speed, direction and shear bed stress 17 to 31 December 2018. ................ 60
Figure 30 Surface KZ filtered turbidity and inshore daily averaged winds at inshore sites (UH1, UH2,
CH1 and CH2) during December 2018. ................................................................................................ 61
Figure 31 Surface KZ filtered turbidity and daily averaged winds at offshore sites (OS1 to OS4) during
December 2018. .................................................................................................................................... 62
Figure 32 Surface KZ filtered turbidity and daily averaged winds at offshore sites (OS5 to OS7) during
December 2018. .................................................................................................................................... 63
Figure 33 Surface KZ filtered turbidity and daily averaged winds at the spoil ground sites (SG1 to
SG3) during December 2018. ............................................................................................................... 64
Page ixLyttelton Port Company Water Quality Monitoring Monthly Report December 2018
Acronyms
ADCP Acoustic Doppler Current Profiler
BPAR Benthic Photosynthetically Active Radiation
BSL Benthic self-logging sonde
CDP Channel Deepening Project
DO Dissolved oxygen
ECan Environment Canterbury
EMMP Environmental Monitoring and Management Plan
Kd Light attenuation coefficient
KZ filter Kolmogorov-Zurbenko filter
LOR Limits of Reporting
LPC Lyttelton Port Company
LYT Lyttelton Port of Christchurch
NTU Nephelometric Turbidity Units
PAR Photosynthetically Active Radiation
QA/QC Quality Assurance/Quality Control
SL Self-Logger
ST Subsurface telemetry
ST/ADCP Subsurface telemetry/Acoustic Doppler Current Profiler
TAG Technical Advisory Group
TDP Total daily PAR
TKN Total Kjeldahl Nitrogen
TSS Total Suspended Solids
VBCC Vision Base Christchurch
VE Vision Environment
WK WatchKeeper telemetered weather station
WQG Water Quality Guidelines
Page xLyttelton Port Company Water Quality Monitoring Monthly Report December 2018
1 INTRODUCTION
Lyttelton Port Company (LPC) is undertaking a Channel Deepening Project (CDP) to extend
the existing navigational channel to allow larger vessels access to the Lyttelton Port of
Christchurch (LYT), the South Island’s largest port. Utilising background information
provided by LPC and advice from the Technical Advisory Group (TAG) in relation to ambient
conditions, locations of sensitive habitats and dredge impact hydrodynamic modelling
scenarios, a water quality monitoring design was proposed for the initial 12 month baseline
monitoring phase. Baseline water quality monitoring and data collection undertaken by
Vision Environment (VE) commenced in September 2016, progressing into dredge
operations monitoring from 29 August to completion of the works on 29 November 2018.
Monitoring is now continuing into a post dredge phase. The interpreted environmental data
provided by VE supports the process of the Environmental Monitoring and Management
Plan (EMMP) for the LPC CDP (Envisor, 2018) and will assist to ascertain the potential
impacts of the project.
2 METHODOLOGY
2.1 Approach
An overview of the methodology for baseline and operations phase of water quality
monitoring is provided in this section. A more detailed description of the importance of the
measured parameters and the specific methodology for the CDP data collection and
processing protocols, can be found in the Channel Deepening Project Water Quality
Environmental Monitoring Methodology (Vision Environment, 2017).
2.1.1 Monitoring Locations and Equipment
Guided by the results of preliminary hydrodynamic modelling (MetOcean, 2016a, b) in
addition to advice from the TAG, baseline and dredge operations monitoring sites were
located outside the area of predicted direct impact (i.e. dredge footprint and offshore
disposal ground), but within the zone of dredging and dredge material placement influence,
in addition to being in the vicinity of sensitive receptors (e.g. mussels farms and important
mahinga kai sites). For ease of identification the harbour was divided into four areas: spoil
ground (SG); offshore (OS); central harbour (CH); and upper harbour (UH), in which 15
locations were selected for monitoring (Figure 1). In each area, one to three monitoring sites
were selected for the deployment of the various individual types of equipment, which are
identified in Table 1. A total of 22 monitoring units were deployed across the 15 locations.
The offshore monitoring area (encompassing monitoring sites SG1 to SG3 and OS1 to OS7)
is a deep water (generally >15 m) oceanic environment, where turbidity appears to be mostly
driven by wind speeds and wave heights, resulting in resuspension of material from the
benthos. A combination of both surface loggers and benthic loggers have been utilised at a
number of offshore locations.
Page 1Lyttelton Port Company Water Quality Monitoring Monthly Report December 2018
Figure 1 Monitoring locations for the LPC Channel Deepening Project, displaying sites within each location.
ST = subsurface telemetry, SL = self-logger, BPAR = benthic photosynthetically active radiation, ADCP = Acoustic Doppler Current Profiler
Page 2Lyttelton Port Company Water Quality Monitoring Monthly Report December 2018 The inshore monitoring area (including monitoring sites CH1 and CH2, and UH1 to UH3) is a shallow (
Lyttelton Port Company Water Quality Monitoring Monthly Report December 2018

during this period is provided, in addition to the results of continuous and discrete water
sampling with comparisons to the baseline monitoring period.
2.1.2 Water Quality Guidelines
Water quality monitoring data from LYT were compared to the Australian and New Zealand
Water Quality Guidelines (WQG) (ANZECC/ARMCANZ, 2000) default interim trigger values.
In the absence of specific default trigger values for estuarine or marine ecosystems, which
are yet to be developed in New Zealand, the WQG suggest the use of interim trigger values
for south-east Australian estuarine and marine ecosystems.
Total metals represent the concentration of metals determined in an unfiltered sample (those
bound to sediments or colloidal particles in addition to dissolved metals), while dissolved
metals are defined as those which pass through a 0.45 µm membrane filter (APHA, 2005).
Specific trigger levels for varying levels of ecosystem protection (99%, 95%, 90% and 80%
of species) have been derived for a number of metals. These guidelines refer to the
dissolved fraction, as they are considered to be the potentially bioavailable fraction
(ANZECC/ARMCANZ, 2000). The LYT coastal environment could be described as slightly-
to-moderately disturbed, therefore the 95% WQG trigger value was considered appropriate
for comparison.

3 RESULTS & DISCUSSION
3.1   Metocean Conditions
3.1.1 Wind and precipitation
The December 2018 total precipitation of 38.2 mm received at Cashin Quay over 16 days
was relatively high in comparison to previous months but remained lower than the 52.0 mm
of rainfall received in November (Figure 2). The majority of the precipitation (7.8 and 10.6
mm) occurred on 19 and 22 December, respectively, with smaller falls dispersed evenly
across the month (Metconnect, 2018).
Freshwater flows (Figure 2) from the Waimakariri River, which can be transported south
along the coastline and enter Lyttelton Harbour several days later, were less than 200 m3/s
(Figure 3) for the duration of the month (ECAN, 2018) with the exception of a short flow
event on 6 December which peaked at 340 m3/s. This is in contrast to the previous month
where a single large flow event introduced noticeable volumes of freshwater into the upper
harbour area.
Inshore wind speeds in December were relatively low with maximum daily mean inshore
wind speeds measured at Cashin Quay ranging from 4.8 to 10.9 knots (Figure 2), mostly
from an east-north-easterly direction, as they were in November (Metconnect, 2018). Daily
mean air temperatures at Cashin Quay ranged from 11 to 27°C, resulting in a warmer
monthly mean temperature of 16°C compared to 13°C during the previous month
(Metconnect, 2018). Minimum overnight temperatures were also 4°C higher than the
previous month.
Offshore significant wave heights peaked at 2.0 m on 1 December travelling in a south
westerly direction (Figure 3) but remained at less than 1.3 m from 6 December to the end of
the month. Wind speeds and gusts were also highest during the first week of December with
average daily speeds peaking at 13.9 knots on 6 December and maximum gusts of 24.5
knots recorded on 4 December (Figure 3). Offshore wind speeds remained relatively low for
the remainder of the month.

                                           Page 4
Lyttelton Port Company Water Quality Monitoring Monthly Report December 2018
30 400 20
Rainfall
Waimakariri Flow
CQ Wind
25 Wind Direction (>14 kts)
Waimakariri River Flow (m /s)
300 15
3
20
Rainfall (mm)
Wind (kts)
15 200 10
10
100 5
5
0 0 0
01-Dec 08-Dec 15-Dec 22-Dec 29-Dec
Figure 2 Inshore metocean conditions, including daily averaged wind speed and direction, rainfall
measured at Cashin Quay, and Waimakariri River flow at the Old Harbour Bridge station, during
December 2018.
Note: Arrows indicate the direction of travel for inshore winds greater than 14 knots.
30 400 3.0
Waimakariri Flow
WK Wind
Wind Direction (>14 kts)
25 WK Wave Height (m) 2.5
Waimakariri River Flow (m /s)
Wave Direction (>1 m)
300 3
20 2.0
Wave Height (m)
Wind (kts)
15 200 1.5
10 1.0
100
5 0.5
0 0 0.0
01-Dec 08-Dec 15-Dec 22-Dec 29-Dec
Figure 3 Offshore metocean conditions, including wind speed and direction, significant wave height
and daily averaged wave direction as measured by the WatchKeeper Buoy at site SG2a, and
Waimakariri River flow at the Old Harbour Bridge station, during December 2018.
Note: Arrows indicate the direction of travel for offshore winds greater than 14 knots and offshore
waves above 1 m significant wave height. Directions from the WatchKeeper buoy have not been
corrected for magnetic declination.
Page 5Lyttelton Port Company Water Quality Monitoring Monthly Report December 2018
3.1.2 Currents
Acoustic Doppler Current Profilers (ADCPs) are deployed at the spoil ground monitoring
sites SG1 and SG3, reporting the speed and direction of currents in close proximity to the
sea surface and seabed. Unfortunately, both ADCP units stopped sending data in late
August/early September 2018 and have not been removed from the spoil ground for
maintenance due to the requirement for turbidity monitoring to continue at these sites during
the dredge operations. Whilst no data are being transferred over the telemetry system, it is
likely that the units are internally logging and the data may be available through manual
download at a later date. The units are scheduled for maintenance in early 2019 during the
post dredge phase.
In the interim, ADCP data collected from the WatchKeeper Buoy at SG2a are provided within
this report. Summary ADCP statistics are presented within Figure 4 and Table 2. Additional
current information in the form of weekly current speed, direction and associated shear
stress plots are provided in Figures 30 and 31 in the Appendix.
The maximum near-surface current velocity at SG2a was recorded on 4 December at
342 mm/s (Table 2), coinciding with increased offshore significant wave heights which
peaked on 1 December and remained elevated until 5 December (Figure 3). Near the
seabed, maximum current velocities of 286 mm/s were recorded on 1 December coinciding
with peak wave heights. The monthly mean current speed for the near-seabed (95 mm/s)
was greater than that recorded for the near surface (75 mm/s) as typically found. Current
velocities tended to be overall lower than the previous month reflecting the calmer metocean
conditions experienced in December 2018.
Table 2 Parameter statistics for ADCP at SG2a (WatchKeeper buoy) during December 2018.
SG2a
Parameter
Near-surface Near-seabed
Minimum current speed (mm/s) 1 3
Maximum current speed (mm/s) 342 286
Mean current speed (mm/s) 75 95
Standard deviation of current speed (mm/s) 48 50
Current speed, 95th percentile (mm/s) 171 194
The time-series plots (Figures 28 and 29 in Appendix) illustrate time-varying current
direction, whilst the current rose diagram (Figure 4) depicts the distribution of current
direction and velocity in the near-surface and near-seabed layers. When interpreting the
current data, please note that the convention for defining current direction is the direction in
which the current flows towards, which is the reference used throughout the figures
presented (the opposite is true for wind direction, where the reference is the direction from
which the wind is coming from).
Similar to the data recorded during October and November 2018, current direction data from
SG2a during December displayed a strong dominance of flow along the west to east axis
(38.2%) at the near-surface (Figure 4). The near-seabed current directions in December
were also predominantly from west to east (24.2%) in addition to a southeast direction
(17.2%).
Page 6Lyttelton Port Company Water Quality Monitoring Monthly Report December 2018
Figure 4 WatchKeeper near-surface and near-seabed current speed and direction during December 2018.
Speed intervals of 50 mm/s are used
Page 7Lyttelton Port Company Water Quality Monitoring Monthly Report December 2018
3.2 Continuous Physicochemistry Loggers
Physical and chemical properties (turbidity, temperature, conductivity [normalised to a
reference temperature of 25°C], pH and DO) of the water column are measured at
monitoring sites every 15 minutes by dual telemetered surface loggers. Additional dual sets
of benthic loggers have also been deployed at five offshore sites (OS1 to OS4 and OS6). In
conjunction with the continuous loggers, discrete depth profiles of all physicochemical
parameters were also conducted at all 15 monitoring sites on 12 December 2018. Further
details regarding the methodology used can be found in the Channel Deepening Project
Water Quality Environmental Monitoring Methodology report (Vision Environment, 2017).
Summary statistics for each physicochemical parameter recorded during December are
presented in Tables 3 to 12. Validated datasets for surface and benthic measurements are
also presented in Figures 5 to 20. Due to the inherent high level of variability in the turbidity
datasets, a 24-hour rolling average has been calculated every 15 minutes to act as an
interim smoothing technique and aid in data interpretation.
3.2.1 Turbidity
Of key importance within the real time parameters recorded are the surface turbidity
measurements, due to their relevance to established trigger values for management of
dredge operations. As such, summary turbidity statistics for the initial baseline period of
monitoring from 1 November 2016 to 31 October 2017 (Fox, 2018) are also presented in
Tables 3 to 5 to allow a comparison with the December 2018 post dredge data.
Summary statistics for KZ filtered turbidity data used for real time compliance monitoring
during dredge operations but not applicable during the post dredge phase, are also
presented in Tables 19 to 21 in the Appendix for comparison with previous months dredge
compliance reports. Similarly, plots of KZ filtered turbidity data with site specific trigger
values are also presented within Figures 30 to 33 in the Appendix.
Surface Turbidity:
Consistent with previous monitoring months, surface turbidity values were typically highest
(monthly means of 4.2 to 10 NTU) at the inshore monitoring sites (Tables 3 to 5, Figure 5).
Further offshore, the spoil ground sites exhibited lower (monthly means of 1.1 to 2.1 NTU)
surface turbidity values (Table 4), which are likely due to the deeper water column limiting
disturbance expressions at the sub-surface. As typically observed, nearshore sites
experienced intermediate turbidity values (1.2 to 3.6 NTU) during December (Table 5). All
turbidity monthly means were noticeably lower than the previous month most likely due to
the calmer metocean conditions experienced in December. Flocculation of fine sediments
which occurred mid-November at inshore sites after freshwater inundation from the
Waimakariri River is likely to have removed the amount of fine sediments that were
previously available for resuspension, resulting in lower inshore turbidity.
Continuing a trend observed in both October and November, surface turbidity at CH2 on the
southern side of the harbour remained lower than the other three inshore sites. Site UH2
also in the southern harbour, which had displayed similarly lower turbidity values up until
mid-November, continued to trend with the two other inshore sites throughout December.
Patterns of turbidity for all four sites were reflective of inshore wind conditions experienced at
the time (Figures 5 and 6) with elevated turbidity occurring during the first week of
December. For the remainder of the month turbidity at all sites was fairly stable, with slight
elevations on 29 December corresponding to increasing inshore wind speeds.
Page 8Lyttelton Port Company Water Quality Monitoring Monthly Report December 2018
Similarly offshore sites trended together by displaying increases in turbidity in response to
increased wind speed and wave height events, particularly in the first week of December.
Site OS3 displayed some of the highest turbidity peaks as typically previously observed
(Figure 5 and Figures 7 to 9). Spoil ground sites also responded to the early December wind
event but to a lesser extent (Figures 5 and 10). All offshore and spoil ground sites remained
fairly stable to the end of December in line with relatively low offshore wind speed and wave
heights.
Table 3 Mean turbidity and statistics at inshore water quality logger sites during December 2018 and
Baseline period (1 November 2016 to 31 October 2017).
Values for December are means ± se, range and percentiles (n = 2938 to 2957) Baseline values
modified from Fox 2018.
Turbidity (NTU)
Site
Statistic Surface December Surface Baseline
UH1 Mean ± se 10 ± 0 12
RangeLyttelton Port Company Water Quality Monitoring Monthly Report December 2018
Table 5 Mean turbidity and statistics at offshore water quality logger sites during December 2018 and
Baseline period (1 November 2016 to 31 October 2017).
Values for December are means ± se, range and percentiles (n = 212* to 2973). Baseline values
modified from Fox 2018.
Turbidity (NTU)
Site Statistic
Surface December Surface Baseline Benthic December
OS1 Mean ± se 3.6 ± 0.0 7.5 30 ± 1
RangeLyttelton Port Company Water Quality Monitoring Monthly Report December 2018
25 25
UH1 CQ Wind
UH2 CQ Wind Dir
CH1
20 CH2 20
Wind Speed (kts)
Turbidity (NTU)
15 15
10 10
5 5
0 0
01-Dec 08-Dec 15-Dec 22-Dec 29-Dec 01-Dec 08-Dec 15-Dec 22-Dec 29-Dec
14 14
OS1 Surface SG1 Surface
OS2 Surface SG2 Surface
12 OS3 Surface SG3 Surface 12
OS4 Surface OS5 Surface
10 OS7 Surface OS6 Surface 10
Turbidity (NTU)
Turbidity (NTU)
8 8
6 6
4 4
2 2
0 0
01-Dec 08-Dec 15-Dec 22-Dec 29-Dec 01-Dec 08-Dec 15-Dec 22-Dec 29-Dec
120 3.0 20
OS1 Benthic WK Wind
OS3 Benthic WK Wind Dir
100 OS4 Benthic 2.5 WK Wave Height
OS2 Benthic
OS6 Benthic 15
Wind Speed (kts)
Wave Height (m)
Turbidity (NTU)
80 2.0
60 1.5 10
40 1.0
5
20 0.5
0 0.0 0
01-Dec 08-Dec 15-Dec 22-Dec 29-Dec 01-Dec 08-Dec 15-Dec 22-Dec 29-Dec
Figure 5 24 hour rolling average turbidity and metocean data for inshore, nearshore, offshore and
benthic monitoring stations.
Note differing scales between plots. Arrows indicate the direction of travel for inshore/offshore winds
greater than 14 knots.
Page 11Lyttelton Port Company Water Quality Monitoring Monthly Report December 2018
50 25
UH1
40 20
Turbidity (NTU)
Wind (kts)
30 15
20 10
10 5
0 0
01-Dec 08-Dec 15-Dec 22-Dec 29-Dec
50 25
UH2
40 20
Turbidity (NTU)
Wind (kts)
30 15
20 10
10 5
0 0
01-Dec 08-Dec 15-Dec 22-Dec 29-Dec
30 25
CH1
25 20
Turbidity (NTU)
20
Wind (kts)
15
15
10
10
5 5
0 0
01-Dec 08-Dec 15-Dec 22-Dec 29-Dec
30 25
CH2
25 20
Turbidity (NTU)
20
Wind (kts)
15
15
10
10
5 5
0 0
01-Dec 08-Dec 15-Dec 22-Dec 29-Dec
Turbidity 24h rolling average CQ Wind Wind direction > 14 kts
Figure 6 Surface turbidity and inshore daily averaged winds at inshore sites (UH1, UH2, CH1 and
CH2) during December 2018.
Note differing scales for each plot. Arrows indicate the direction of travel for inshore winds greater
than 14 knots. Grey shading indicates the baseline mean turbidity.
Page 12Lyttelton Port Company Water Quality Monitoring Monthly Report December 2018
20 20 3.0
OS1 Surface
2.5
Wave Height (m)
Turbidity (NTU)
15 15
2.0
Wind (kts)
10 10 1.5
1.0
5 5
0.5
0 0 0.0
01-Dec 08-Dec 15-Dec 22-Dec 29-Dec
200 20 3.0
OS1 Benthic
2.5
Wave Height (m)
Turbidity (NTU)
150 15
2.0
Wind (kts)
100 10 1.5
1.0
50 5
0.5
0 0 0.0
01-Dec 08-Dec 15-Dec 22-Dec 29-Dec
20 20 3.0
OS2 Surface
2.5
Wave Height (m)
Turbidity (NTU)
15 15
2.0
Wind (kts)
10 10 1.5
1.0
5 5
0.5
0 0 0.0
01-Dec 08-Dec 15-Dec 22-Dec 29-Dec
200 20 3.0
OS2 Benthic
2.5
Wave Height (m)
Turbidity (NTU)
150 15
2.0
Wind (kts)
100 10 1.5
1.0
50 5
0.5
0 0 0.0
01-Dec 08-Dec 15-Dec 22-Dec 29-Dec
Turbidity WK Wind WK Wave Height
24h Rolling Average WK Wind Direction (>14 kts)
Figure 7 Surface and benthic turbidity and daily averaged winds at offshore sites (OS1 and OS2)
during December 2018.
Note differing scales for each plot. Arrows indicate the direction of travel for offshore winds greater
than 14 knots. Grey shading indicates the baseline mean turbidity.
Page 13Lyttelton Port Company Water Quality Monitoring Monthly Report December 2018
20 20 3.0
OS3 Surface
2.5
Wave Height (m)
Turbidity (NTU)
15 15
2.0
Wind (kts)
10 10 1.5
1.0
5 5
0.5
0 0 0.0
01-Dec 08-Dec 15-Dec 22-Dec 29-Dec
200 20 3.0
OS3 Benthic
2.5
Wave Height (m)
Turbidity (NTU)
150 15
2.0
Wind (kts)
100 10 1.5
1.0
50 5
0.5
0 0 0.0
01-Dec 08-Dec 15-Dec 22-Dec 29-Dec
20 20 3.0
OS4 Surface
2.5
Wave Height (m)
Turbidity (NTU)
15 15
2.0
Wind (kts)
10 10 1.5
1.0
5 5
0.5
0 0 0.0
01-Dec 08-Dec 15-Dec 22-Dec 29-Dec
200 20 3.0
OS4 Benthic
2.5 Wave Height (m)
Turbidity (NTU)
150 15
2.0
Wind (kts)
100 10 1.5
1.0
50 5
0.5
0 0 0.0
01-Dec 08-Dec 15-Dec 22-Dec 29-Dec
Turbidity WK Wind WK Wave Height
24h Rolling Average WK Wind Direction (>14 kts)
Figure 8 Surface and benthic turbidity and daily averaged winds at offshore sites (OS3 and OS4)
during December 2018.
Note differing scales for each plot. Arrows indicate the direction of travel for offshore winds greater
than 14 knots. Grey shading indicates the baseline mean turbidity.
Page 14Lyttelton Port Company Water Quality Monitoring Monthly Report December 2018
20 20 3.0
OS5 Surface
2.5
Wave Height (m)
Turbidity (NTU)
15 15
2.0
Wind (kts)
10 10 1.5
1.0
5 5
0.5
0 0 0.0
01-Dec 08-Dec 15-Dec 22-Dec 29-Dec
20 20 3.0
OS6 Surface
2.5
Wave Height (m)
Turbidity (NTU)
15 15
2.0
Wind (kts)
10 10 1.5
1.0
5 5
0.5
0 0 0.0
01-Dec 08-Dec 15-Dec 22-Dec 29-Dec
200 20 3.0
OS6 Benthic
2.5
Wave Height (m)
Turbidity (NTU)
150 15
2.0
Wind (kts)
100 10 1.5
1.0
50 5
0.5
0 0 0.0
01-Dec 08-Dec 15-Dec 22-Dec 29-Dec
20 20 3.0
OS7 Surface
2.5 Wave Height (m)
Turbidity (NTU)
15 15
2.0
Wind (kts)
10 10 1.5
1.0
5 5
0.5
0 0 0.0
01-Dec 08-Dec 15-Dec 22-Dec 29-Dec
Turbidity WK Wind WK Wave Height
24h Rolling Average WK Wind Direction (>14 kts)
Figure 9 Surface turbidity and daily averaged winds at offshore sites (OS5, OS6 and OS7) during
December 2018.
Note differing scales for each plot. Arrows indicate the direction of travel for offshore winds greater
than 14 knots. Grey shading indicates the baseline mean turbidity.
Page 15Lyttelton Port Company Water Quality Monitoring Monthly Report December 2018
12 20 3.0
SG1
10 2.5
Wave Height (m)
Turbidity (NTU)
15
8 2.0
Wind (kts)
6 10 1.5
4 1.0
5
2 0.5
0 0 0.0
01-Dec 08-Dec 15-Dec 22-Dec 29-Dec
12 20 3.0
SG2
10 2.5
Wave Height (m)
Turbidity (NTU)
15
8 2.0
Wind (kts)
6 10 1.5
4 1.0
5
2 0.5
0 0 0.0
01-Dec 08-Dec 15-Dec 22-Dec 29-Dec
12 20 3.0
SG3
10 2.5
Wave Height (m)
Turbidity (NTU)
15
8 2.0
Wind (kts)
6 10 1.5
4 1.0
5
2 0.5
0 0 0.0
01-Dec 08-Dec 15-Dec 22-Dec 29-Dec
Turbidity WK Wind WK Wave Height
24h Rolling Average WK Wind Direction (>14 kts)
Figure 10 Surface turbidity at spoil ground sites (SG1, SG2b and SG3) during December 2018.
Note differing scales for each plot. Arrows indicate the direction of travel for offshore winds greater
than 14 knots. Grey shading indicates the baseline mean turbidity.
Comparison to Baseline:
Mean surface turbidity and higher order percentile statistics from all monitoring sites in
December were markedly lower than calculated baseline values (Tables 3 to 5, Figures 6 to
10). This is in contrast to previous months where at inshore sites UH1, UH2 and CH2,
turbidity statistics tended to be only slightly lower, or similar to baseline. Site CH1 which had
previously recorded a monthly mean 2 NTU greater than that of the baseline (Table 3),
recorded a monthly mean 1.7 NTU lower in December. Percentile statistics for all sites were
lower in December than those recorded for baseline monitoring. As previously mentioned,
flocculation of fine sediments from freshwater inundation in November may have contributed
to the lower overall values.
3.2.2 Temperature
Average surface water temperatures during December were warmer than those experienced
during the previous months, ranging from 16.3 to 17.5°C (Table 6), compared to 14.7 to
Page 16Lyttelton Port Company Water Quality Monitoring Monthly Report December 2018
16.1°C in November, as a result of warmer ambient air temperatures. Once again the
shallow waters of the upper and central harbour displayed the warmest mean temperatures,
which is in contrast to the winter months. All sites exhibited a warming trend across the
month, with small decreases occurring during periods of heavier rainfall particularly from 19
to 22 December (Figures 11 and 12).
Semidiurnal variability (associated with tidal water movements and solar radiation) was
again observed within the datasets. Sites OS1 and OS7 at the harbour entrance in addition
to SG1, recorded more elevated temperatures on 18 December compared to surrounding
sites in line with peak mean daily ambient temperatures for the month. Sudden declines in
temperature were observed at the majority of offshore sites in particular OS3 and OS4 in
addition to SG3, in response to the lower overnight minimum air temperatures on 7
December.
Similar to previous months, benthic temperatures were a few degrees cooler than those of
the surface waters. Declines in temperature were also recorded at OS2, OS3 and OS4
benthic sites from the 7 December but benthic water temperatures did not recover as quickly
as they did at the surface. Site OS1 benthic continued to demonstrate cyclical responses to
tidal variation.
Table 6 Mean temperature at inshore, spoil ground and offshore water quality sites during December
2018.
Values are means ± se (n = 217* to 2976).
Temperature (°C)
Site
Surface loggers Benthic loggers
UH1 17.5 ± 0.0 –
UH2 17.3 ± 0.0 –
CH1 17.0 ± 0.0 –
CH2 17.0 ± 0.0 –
SG1 16.6 ± 0.0 –
SG2 16.5 ± 0.0 –
SG3 16.5 ± 0.0 –
OS1 16.9 ± 0.0 15.3 ± 0.0
OS2 16.9 ± 0.0 14.5 ± 0.0
OS3 16.4 ± 0.0 13.8 ± 0.0
OS4 16.3 ± 0.0 13.7 ± 0.0
OS5 16.8 ± 0.0 –
OS6 16.6 ± 0.0 13.7 ± 0.0
OS7 17.0 ± 0.0 –
Page 17Lyttelton Port Company Water Quality Monitoring Monthly Report December 2018
26 20
Rainfall
UH1
24 UH2
CH1
CH2
15
22
Temperature (°C)
Rainfall (mm)
20
10
18
16
5
14
12 0
01-Dec 08-Dec 15-Dec 22-Dec 29-Dec
26 20
Rainfall
SG1
24 SG2b
SG3
15
22
Temperature (°C)
Rainfall (mm)
20
10
18
16
5
14
12 0
01-Dec 08-Dec 15-Dec 22-Dec 29-Dec
Figure 11 Surface temperature at inshore (UH1, UH2, CH1 and CH2) and spoil ground (SG1, SG2b
and SG3) water quality sites and rainfall during December 2018.
Page 18You can also read


