Life Cycle Cost Analysis - 2021 General Electric Company
←
→
Page content transcription
If your browser does not render page correctly, please read the page content below

Life Cycle Cost Analysis

                           © 2021 General Electric Company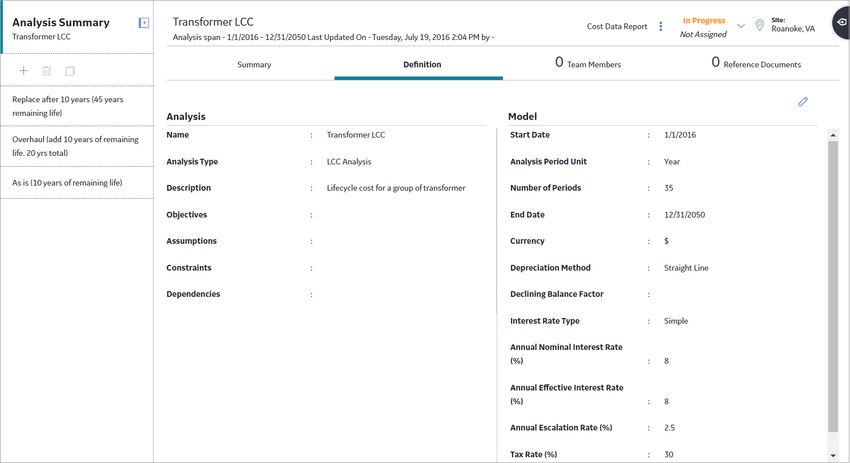
Contents
     Overview                                                                          1
         Overview of the Life Cycle Cost Analysis (LCC) Module                         1
         Access the LCC Overview Page                                                  1
         LCC Workflow                                                                  2
     Workflow                                                                          3
         Life Cycle Cost Analysis Workflow                                             3
         Define Analysis/Develop Model                                                 3
         Assemble Team                                                                 3
         Add Reference Documents                                                       3
         View Existing Analysis                                                        4
         Develop a Scenario                                                            4
         Develop Operating Profile                                                     4
         Create Elements/Assign Assets                                                 4
         Acquire Data                                                                  4
         Allocate Resources                                                            4
         Review Scenario Data                                                          4
         Copy/Modify/Update Scenarios                                                  5
         Review Analysis Results                                                       5
         Complete Analysis                                                             5
     LCC Analyses                                                                      6
         About LCC Analyses                                                            6
         About Fleet Management                                                        6
         Access an LCC Analysis                                                        6
         Create an LCC Analysis                                                      15
         Modify an LCC Analysis                                                      16
         Delete an LCC Analysis                                                      17
         Access Reference Documents in LCC                                           17
         Access the LCC Team Members Section                                         18
         Access Recommendations in LCC                                               18
     Resource Management                                                             19
         About Resource Management                                                   19
         Create a Resource                                                           19

ii                                                               Life Cycle Cost Analysis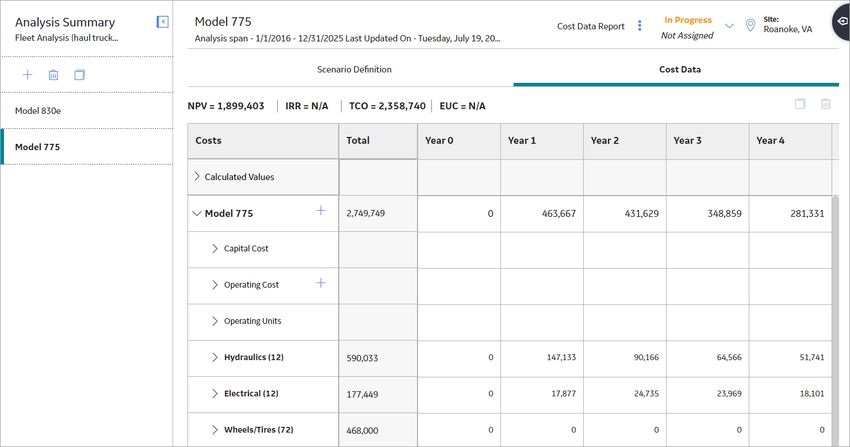
Delete a Resource                                  20
Scenarios                                               21
     About Scenarios                                    21
     About Operating Profiles                           21
     About LCC Elements                                 21
     About Asset Groups in LCC                          22
     Access a Scenario                                  22
     Create a Scenario for an LCC Analysis              23
     Create a Scenario for a Fleet Analysis             25
     Create a Profile                                   28
     Create a Secondary Element                         28
     Delete a Secondary Element                         30
     Import Scenario Elements Into an Analysis          31
     Copy a Scenario Within an Analysis                 32
     Delete a Profile                                   32
     Delete a Scenario                                  32
Cost Data                                               33
     About Cost Data                                    33
     About Operating Costs                              33
     About Import Cost Data                             34
     About Calculated Values                            35
     Access a Cost Data Grid                            35
     Create a Resource                                  36
     Add an Existing Resource                           37
     Create a Secondary Element in the Cost Data Grid   38
     Copy a Secondary Element                           39
     Create Operating Costs Manually                    40
     Import Cost Data                                   42
     Access Calculated Values                           56
     Add Capital Costs to the Cost Data Grid            56
     Delete Cost Data                                   57
Deployment                                              59
     Deploy LCC for the First Time                      59
     Upgrade LCC                                        59
     LCC Security Groups                                59

                                                         iii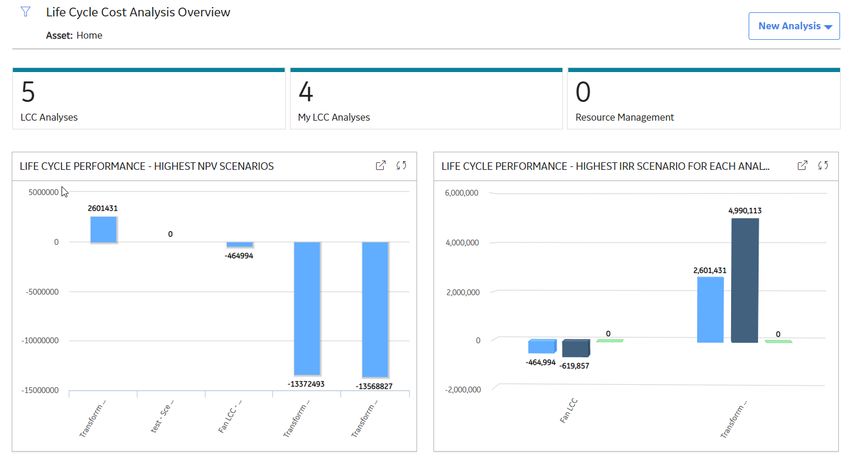
Reference                                           61
         General Reference                               61
         Family Field Descriptions                       64
         Catalog Items                                   71
         Rates and Calculations                          73

     Chapter 2: Release Notes                           78
         Second Quarter of 2021                          79
         Third Quarter of 2020                           79
         Third Quarter of 2019                           79
         First Quarter of 2019                           80
         Fourth Quarter of 2018                          81
         Third Quarter of 2018                           81

iv                                   Life Cycle Cost Analysis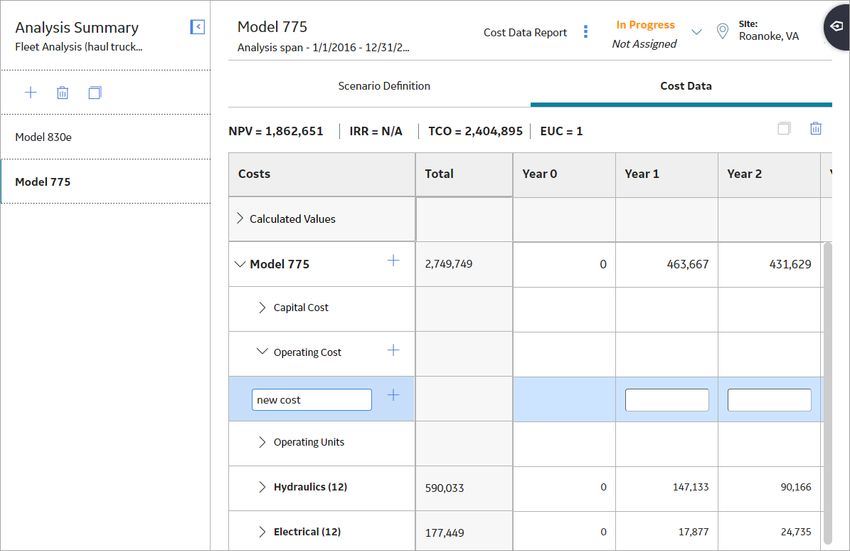
Copyright GE Digital
      © 2021 General Electric Company.

      GE, the GE Monogram, and Predix are either registered trademarks or trademarks of All other trademarks
      are the property of their respective owners.
      This document may contain Confidential/Proprietary information of and/or its suppliers or vendors.
      Distribution or reproduction is prohibited without permission.
      THIS DOCUMENT AND ITS CONTENTS ARE PROVIDED "AS IS," WITH NO REPRESENTATION OR
      WARRANTIES OF ANY KIND, WHETHER EXPRESS OR IMPLIED, INCLUDING BUT NOT LIMITED TO
      WARRANTIES OF DESIGN, MERCHANTABILITY, OR FITNESS FOR A PARTICULAR PURPOSE. ALL OTHER
      LIABILITY ARISING FROM RELIANCE UPON ANY INFORMATION CONTAINED HEREIN IS EXPRESSLY
      DISCLAIMED.
      Access to and use of the software described in this document is conditioned on acceptance of the End
      User License Agreement and compliance with its terms.

© 2021 General Electric Company                                                                                v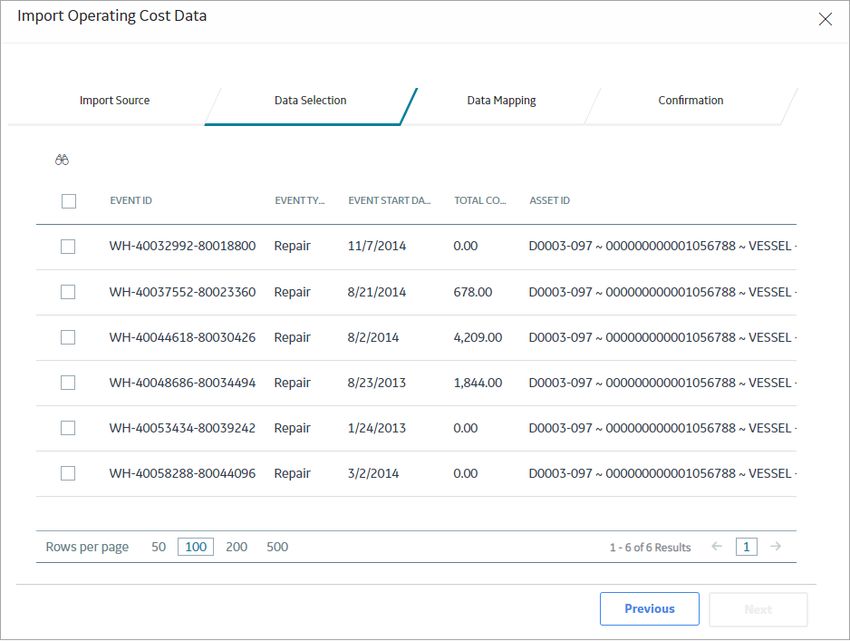
Overview

Overview of the Life Cycle Cost Analysis (LCC) Module
      The Life Cycle Cost Analysis (LCC) module provides the ability to balance costs, plan budgets, collect
      performance data and build contingency plans for your organization.
      By using LCC, your organization can:
      •   Develop Process Models
      •   Acquire Data
      •   Run Models
      •   Perform Analyses
      •   Report Results
      •   Track Costs

Access the LCC Overview Page
      Procedure
      In the module navigation menu, select Strategy > Life Cycle Cost Analysis.
      The LCC Overview page appears.

      The LCC Overview page displays the following sections with information related to Life Cycle Cost
      Analysis:
      •   LCC Analyses : Contains a list of Life Cycle Analyses associated with assets at or below the selected
          Asset Hierarchy level.
      •   My LCC Analyses : Contains a list of the LCC Analyses to which you are assigned as a team member.
      •   Resource Management : Contains a list of Resources available to be applied to Life Cycle costs
          available in the database.

© 2021 General Electric Company                                                                                   1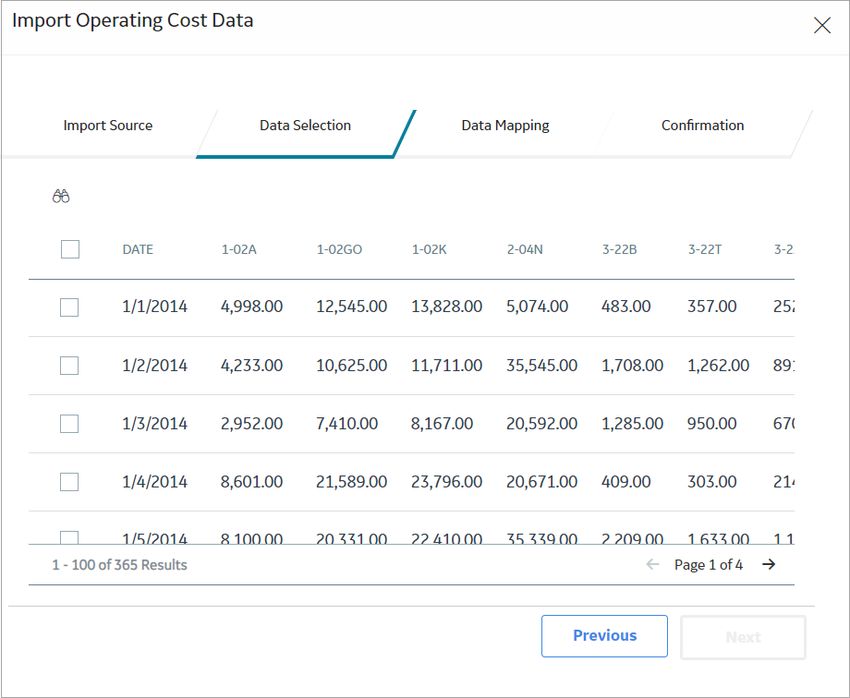
•   Life Cycle Performance - Highest IRR Scenario For Each Analysis : Displays a summary of Life
        Cycle Performance of the greatest Internal Rate of Return (IRR) of all the scenarios per analysis.
        Note: LCC assumes that all LCC Analyses being compared share the same currency.
    •   Life Cycle Performance - Top NPV Scenarios : Displays a summary of Life Cycle Performance of the
        greatest Net Present Value (NPV) scenarios.
        Note: LCC assumes that all LCC Analyses being compared share the same currency.
    By default, the hierarchy level is set to Home, displaying all of the analyses with and without assets. You
    can filter the hierarchy level by selecting    on the upper-left corner of the page. When setting the filter
    to an asset or functional location in the hierarchy, only those analyses linked to the selected functional
    location and its children or to the selected asset will appear.

LCC Workflow
    This workflow provides the basic, high-level steps for using this module. The steps and links in this
    workflow do not necessarily reference every possible procedure.
    1. Define an Analysis to create a Life Cycle Cost Analysis.
    2. Create Scenarios to reflect the best forecast of life cycle costs for the defined period, using cost data to
       populate the Operating and Capital costs. Within the scenario, you will also develop and define an
       Operating Profile, Primary Element and Secondary Elements. Primary and Secondary elements can be
       defined and associated with asset hierarchy elements.
    3. Define cost elements.
    4. Import Cost Data or Manually Add Cost Data to associated scenario elements. After the costs are
       entered, they will be saved in the Cost Data grid where you can review them.
    5. Create resources applicable to your analysis, such as people, replacement parts, consumable parts,
       oils and lubricants, maintenance equipment, and tools.
    6. Analyze results of your Analysis.

2                                                                                     © 2021 General Electric Company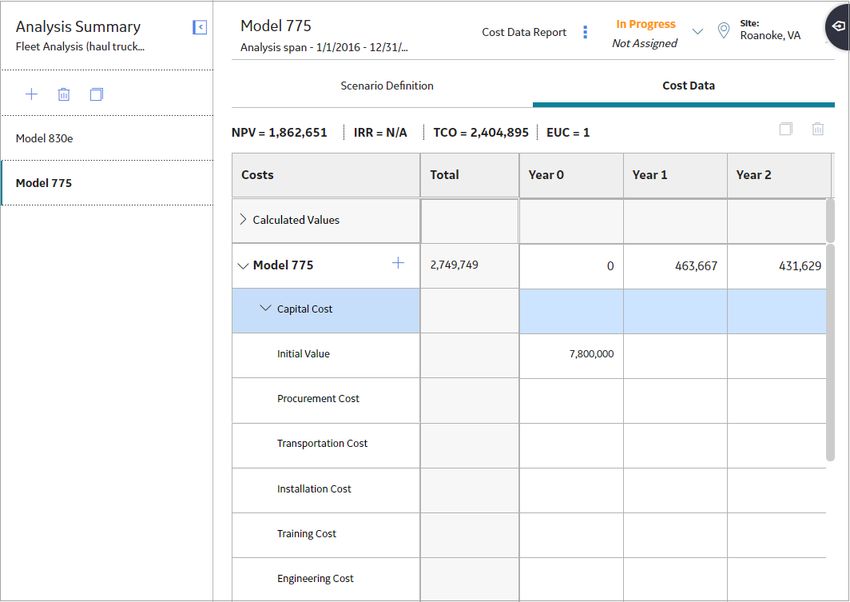
Workflow

Life Cycle Cost Analysis Workflow
      This workflow describes the process for developing a Life Cycle Cost Analysis to compare costs through
      various scenarios.
      In the following workflow diagram, the blue text in a shape indicates that a corresponding description has
      been provided in the sections that follow the diagram.

Define Analysis/Develop Model
      Persona: Analyst
      Define the LCC Analysis, duration, and financial model to be applied to the analysis.

Assemble Team
      Persona: Analyst
      Assemble team members to perform an LCC.

Add Reference Documents
      Persona: Analyst

© 2021 General Electric Company                                                                                3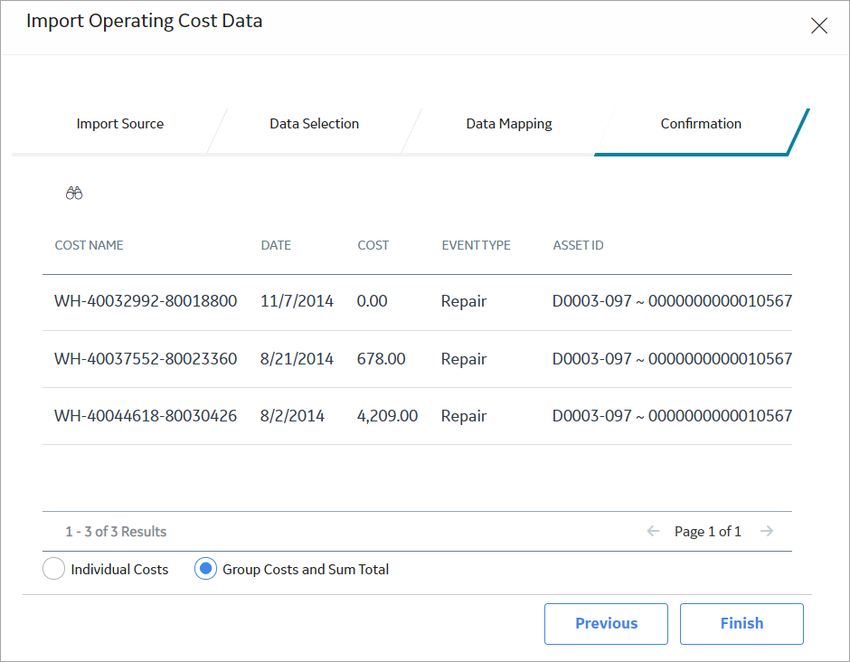
Create reference documents to associate files or websites with a record in the GE Digital APM database.

View Existing Analysis
    Persona: Analyst
    Find, select, and open a previously created analysis via the LCC Module Overview page. For a baseline
    test, this will be the analysis created in step A1.

Develop a Scenario
    Persona: Analyst
    Develop a new scenario for the first scenario. A new scenario will form the best current projection of
    future asset usage over the defined period of the analysis.

Develop Operating Profile
    Persona: Analyst
    Develop the operating profile for the analysis by defining operating usage through each defined period.

Create Elements/Assign Assets
    Persona: Analyst
    Create Primary and Secondary Elements for the Scenario. Elements can be linked to assets or locations
    taken from the hierarchy, but this is not mandatory as required elements may not always exist in the
    hierarchy. Secondary Elements may also be added from previously created Asset Groups.

Acquire Data
    Persona: Analyst
    Categorize each element of cost data within the scenario. Basic categories are provided by default, but
    others may need to be added. Operating Costs may then be added manually or imported for each
    element.

Allocate Resources
    Persona: Analyst
    Allocated resources used in operating and maintaining an asset in the scenario. This may include humans,
    tools, facilities, insurance, etc.

Review Scenario Data
    Persona: Analyst

4                                                                                   © 2021 General Electric Company
Review all added or imported data in the scenario for accuracy and completeness. Amend and update the
data as needed.
Copy/Modify/Update Scenarios
Persona: Analyst
Alternative scenarios will usually be variations of a previously created scenario. Time can be saved by
copying a scenario, and then modifying the copied scenario needed.
Review Analysis Results
Persona: Analyst
Using the various charts provided, analyze the results of the analysis. Compare costs for each scenario
according to the displayed categories. Create additional scenarios as needed until an optimum scenario
for minimizing life cycle costs for the analysis has been determined.
Complete Analysis
Persona: Analyst
Change the state of the LCC to Completed, making the analysis read-only.
© 2021 General Electric Company 5LCC Analyses
About LCC Analyses
LCC Analyses are economic analyses used to evaluate the total cost of ownership of an asset, including
cost of installation, operation, maintenance, conversion, and decommission, through applying different
operating scenarios to a model.
Managers are able to use analyses to understand the cost of ownership of Assets or fleets of Assets over
defined accounting periods or planned asset life. By comparing scenarios, LCC Analyses provide
information to inform choices to optimize costs over the period defined in the Analysis. Cost information
is presented in a range of categories to help managers determine which assets to buy, what maintenance
strategies are most cost effective, and when replacement is necessary. Informed decisions can be based
on a range of financial criteria for all scenarios in the analysis, presented in a chart format. Examples
include Capital Costs, Operating Costs and Cashflow.
For Example, as a transportation manager, I would like to evaluate the costs of owning a fleet of trucks.
Using an LCC Analysis, the company will keep a log of the use and maintenance of each truck in the fleet in
order to determine the exact cost of each truck in the fleet and to know when replacement or
decommission should occur.
About Fleet Management
Using LCC Analyses, you can now manage a fleet of vehicles in one central location. Analyses are used to
collect performance data, balance costs of ownership, and plan action items over the lifespan of each
vehicle, and the fleet.
Access an LCC Analysis
Before You Begin
• Create an Analysis
Procedure
1. Access the LCC Overview page.
2. Select the LCC Analyses tab.
The LCC Analyses section appears, displaying a list of available LCC Analyses.
6 © 2021 General Electric Company3. In the list, in the Analysis Name column, select an analysis.
In a new page, the Analysis Summary workspace for the selected analysis appears, displaying the
Summary section. The following charts related to LCC Analyses can be accessed from the drop-down
list box:
• Capital Cost: Displays a summary trend for each scenario, which is based on the sum of all capital
costs per period for each scenario.
• Operating Cost: Displays a summary trend for each scenario, which is based on the sum of all
operating costs per period for each scenario.
• Cash Flow Trend: Displays a summary trend for each scenario, which is based on the cash flow per
period for each scenario.
• Capital Cost Break Down: Displays stacked bars for each scenario, which breaks down the capital
costs for the capital cost type.
• Operating Cost Break Down: Displays stacked bars for each scenario, which breakdown the
operating costs by elements.
• Depreciated Values: Displays a summary trend of depreciated values per period for each scenario.
• Present Values: Displays a summary trend of present values per period for each scenario.
• Total Cost: Displays a cumulative summary trend of the associated capital costs and operating
costs for each scenario.
About Analysis Charts and Graphs
Capital Cost Chart
The Capital Cost Summary Chart displays the trend for each scenario, as well as the sum of all capital
costs per period for each scenario.
© 2021 General Electric Company 7Capital Cost Break Down Chart
The Capital Cost Break Down Chart displays all the values that comprise the capital cost totals for each
scenario in the analysis. Within the chart, you will see a complete breakdown of the costs contained in a
scenario. If you hover over the individual capital costs, the title and details of the costs appear.
8 © 2021 General Electric CompanyCash Flow Chart
The Cash Flow Chart displays Cash Flow per period. All of the values from the Cost Data grid are factored
into the output shown in the chart, making it easier for you to monitor the movement of money
throughout the span of the Analysis and easily view and determine which scenario has the optimal cash
flow as compared with other scenarios.
© 2021 General Electric Company 9Depreciated Value Chart
The Depreciated Value Chart displays Depreciated Values per period for each scenario, detailing how the
value of the asset has been depreciated throughout the analysis. The chart allows you to assess the
overall depreciation so that a corrective course of action can be determined.
10 © 2021 General Electric CompanyEquivalent Unit Cost Chart
The Equivalent Unit Cost Chart displays the average cost per operating unit as it has changed across the
analysis lifespan.
© 2021 General Electric Company 11Operating Cost Chart
The Operating Cost Chart displays the trend, as well as the sum of all operating costs per period for each
scenario. The chart allows you to review the overall operating costs of an Analysis and make decisions
regarding future courses of action.
Operating Cost Break Down Chart
The Operating Cost Break Down Chart displays stacked bars for each scenario that are broken down by
element; these break down the operating costs by elements. The Break Down chart enables you to see
where money is being spent within each scenario, identifying major cost drivers and target areas for cost
reduction. If you hover over the individual operating costs, the title and details of the costs appear.
12 © 2021 General Electric CompanyPresent Value Chart
The Present Value Chart displays Present Values per period for each scenario. Present values are
determined based on the Interest Rate.
The chart provides information to allow you to accurately view the expected worth of your Analysis based
on the current Interest Rate.
© 2021 General Electric Company 13Remaining Planned Life
The Remaining Planned Life graph displays the amount of life that remains after consumption throughout
a scenario, or all scenarios, in an analysis.
14 © 2021 General Electric CompanyTotal Cost Chart
The Total Cost Chart displays the cumulative summary trend of the associated capital costs and operating
costs for each scenario. The chart allows you to review the overall capital costs and operating costs of an
Analysis and make decisions regarding future courses of action.
Create an LCC Analysis
Procedure
1. Access the LCC Overview page.
2. In the upper-right corner of the page, select New Analysis, and then select one of the following
options:
Option
Basic Analysis Select this option if you want to create a standard life cycle
cost analysis.
Fleet Management Select this option if you want to create an analysis to manage
a fleet. This option provides a profile for each secondary
element, start and end lives, additional calculated values for
EUC and Remaining Life, and additional charts.
In a new page, the Analysis Summary workspace for the new analysis appears, displaying the
Definition section.
© 2021 General Electric Company 153. As needed, enter values in the available fields, and then select .
The LCC Analysis is saved.
Modify an LCC Analysis
Procedure
1. Access the LCC Analysis that you want to modify.
2. Select the Definition tab.
The Definition section appears.
16 © 2021 General Electric Company3. Select .
4. As needed, modify the values in the available fields.
Note: When modifying the value in the Analysis Period Unit box and Analysis length, the following
occurs:
• When the Number of Periods field is modified to shorten the Analysis, columns are removed from
the end of the Cost Data grid.
• When the Number of Periods field is modified to lengthen the Analysis, empty columns are added
to the end of the Cost Data grid.
• When only the Start Date field is modified, the columns in the Cost Data grid will remain the same
and only the dates in the Definition and Summary section will reflect the change.
• When you modify the value in the Analysis Period Unit box, the data in the Cost Data grid is
divided or aggregated based on the new unit of time that you specify. For example, if a unit was
previously measured in years and is now measured in quarters, then the data in each row will be
one fourth of what it was previously. For the Salvage Value row, the whole value will appear in the
last quarter within the same year.
5. Select .
The analysis is saved.
Delete an LCC Analysis
Procedure
1. Access the LCC Overview page.
2. In the workspace heading, select the LCC Analyses tab.
The LCC Analysis section appears, displaying a list of available LCC Analyses.
3. Select the row for the analysis that you want to delete.
4. At the top of the workspace, select .
A confirmation message appears.
5. Select Yes.
The LCC Analysis is deleted from the GE Digital APM database.
Access Reference Documents in LCC
Procedure
1. Access the LCC Analysis whose Reference Documents you want to access.
2. In the workspace, select the Reference Documents tab.
A list of Reference Documents linked to the selected LCC Analysis appears.
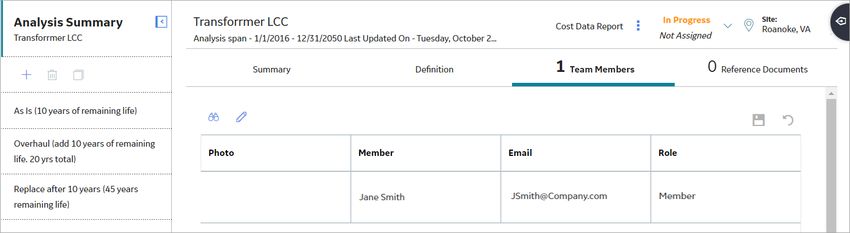
© 2021 General Electric Company 17Access the LCC Team Members Section
Procedure
1. Access the LCC Analysis whose list of team members you want to access.
2. In the workspace, select the Team Members tab.
The Team Members section appears, displaying a list of team members assigned to the analysis.
Tip: For details about working with teams and the Team Members section, refer to the Teams section
of the documentation.
Access Recommendations in LCC
Procedure
1. Access the LCC Analysis whose list of team members you want to access.
2. Select the LCC Analyses tab.
The LCC Analyses section appears, displaying a list of available LCC Analyses.
3. Select the analysis for which you want to access Recommendations.
The Analysis Summary workspace for the selected analysis appears, displaying the Summary
section.
4. Select .
The Recommended Actions pane expands.
Tip: For information about additional options available when working with recommendation records,
refer to the Recommended Actions section of the documentation.
18 © 2021 General Electric CompanyResource Management
About Resource Management
Resource Management organizes all of the resources that have been applied to existing analyses in a
central location within LCC to ensure easy access. Resource types include people, replacement parts,
consumable parts, oils and lubricants, maintenance equipment, and tools.
Create a Resource
Procedure
1. Access the LCC Overview page.
2. Select Resource Management.
The Resource Management section appears, displaying a list of available resources.
3. Select .
The Add Resource window appears.
© 2021 General Electric Company 194. As needed, enter values in the available fields. .
5. Select Done.
The resource is created.
Delete a Resource
About This Task
Note: If you are deleting a resource that has been applied to an LCC cost, then the cost will not be
affected.
Procedure
1. Access the LCC Overview page.
2. Select Resource Management.
The Resource Management section appears, displaying a list of available resources.
3. Select the row containing the resource you want to delete, and then select .
A confirmation message appears.
4. Select Yes.
The resource is deleted.
20 © 2021 General Electric CompanyScenarios
About Scenarios
Scenarios are based on one or more assets or groups of assets that help evaluate the cost of ownership
over defined accounting periods or planned asset life. An analysis can have one or many scenarios to
cover all of the costs over the lifespan of an asset. On the LCC Overview page, scenario performance can
be compared when an analysis has more than one scenario.
Scenarios are made up of an Operating Profile and a Cost Data grid.
For example, a construction company owns a fleet of trucks and would like to assess the cost of trucks
over a lifespan. A scenario will include different trucks based on their life expectancy. Within the scenario,
the company will keep track of maintenance, repairs, and fuel usage to determine the exact cost of the
truck in that scenario.
About Operating Profiles
Multiple Operating Profiles can be used within a scenario, enabling you to establish different revenue
rates for different periods within the analysis. Profiles within scenarios define the production operating
rate for a prescribed operating condition by allowing production output values to be added to an analysis.
The analysis will then have a value to analyze asset ownership costs.
For example, assume that you have been tasked with determining the lifecycle costs of an air compressor.
Your compressor will operate at one operating profile during the summer months and a second operating
profile during the winter months, due to the greater density of air in winter. The two profiles allow the
performance between two different time spans with different production rates to be captured.
About LCC Elements
Life Cycle Cost Analysis uses two different types of elements: primary and secondary. Elements are
organized in a two level hierarchy with the primary level as the top level. One or many secondary
elements can be added below the primary element, and all element costs are distributed up to the
primary element and shown under the scenario calculated costs.
Primary Elements
Primary elements are assets that apply directly to the scenario and can be supplemented with an infinite
amount of secondary elements.
Secondary Elements
Secondary elements are used to add other assets or groups of assets from the hierarchy to scenarios that
will contribute to the operating cost. Secondary elements are subcomponents that contribute to the costs
of a primary element.
For example, Hydraulics would be secondary elements to a haul truck, contributing to
the overall cost of the primary element.
© 2021 General Electric Company 21About Asset Groups in LCC
When you create secondary elements in LCC, you can associate them with a single asset or a previously
defined Asset Group. Multiple assets can be added and related by selecting an Asset Group.
For more information about the different Asset Group functions, refer to the Asset section of the
documentation. Functions include, but are not limited to, creating and modifying an Asset Group.
Access a Scenario
Before You Begin
• Create a Scenario
Procedure
1. Access the Analysis containing the scenario that you want to access.
2. In the left pane, select a scenario.
The workspace for the selected scenario appears, displaying the Scenario Definition section.
22 © 2021 General Electric CompanyCreate a Scenario for an LCC Analysis
Procedure
1. Access an LCC Analysis.
2. In the left pane, select .
The workspace for the new scenario appears, displaying the Scenario Definition section.
3. In the Details subsection, enter values in the Scenario ID, Primary Element Name boxes.
4. In the Link to Hierarchy box, select .
The Asset Finder window appears.
© 2021 General Electric Company 235. Navigate to and select an item in the hierarchy, and then select Done.
Note: The asset that you choose to link from the hierarchy is used to determine the relevant costs to
be imported to the elements in the Cost Data grid.
6. In the Operating Profile subsection, complete the Measurement Unit, Value of Unit, Measurement
Frequency, and Rate Capacity fields.
Tip: Once the Measurement Unit is entered, it is saved in a drop down list for future use.
7. In the Operating Profile subsection, in the grid, select .
A new row appears in the grid.
8. In the new row, enter values in the Profile Name, Operating %, From, and To boxes.
Note: Profiles are used as the revenue model for the scenario; therefore, a warning message will
appear if Profiles overlap or there is a gap where there is no associated profile. One or many Profiles
can be created to cover the span of the analysis.
9. In the new row, if you want the profile to repeat annually, then select the Repeat Annually check box.
24 © 2021 General Electric Company10. Select .
The scenario is saved.
Create a Scenario for a Fleet Analysis
Procedure
1. Access an LCC Analysis.
2. In the left pane, select .
The workspace for the new scenario appears, displaying the Scenario Definition section.
3. In the Details subsection, enter values in the Scenario ID, Primary Element Name boxes.
4. In the Link to Hierarchy box, select .
The Asset Finder window appears.
© 2021 General Electric Company 255. Navigate to and select an item in the hierarchy, and then select Done.
Note: The asset that you choose to link from the hierarchy is used to determine the relevant costs to
be imported to the elements in the Cost Data grid.
6. In the grid, select select .
A new row appears.
7. Enter a Secondary Element Name.
8. To associate the secondary element with either an Asset or an Asset Group, in the Asset Hierarchy ID
cell, select .
The Asset Finder window appears.
26 © 2021 General Electric Company9. Navigate to an Asset or Asset Group in the hierarchy, and then select the asset or asset group from the
list.
Note: The asset that you choose to link from the hierarchy is used to determine the relevant costs to
be imported to the elements in the Cost Data grid.
10. Select Done.
The Asset Hierarchy ID field is populated with a link, and the Quantity field is populated with a value of
1 automatically.
Note: The hyperlink for an Asset or Asset Group displays the asset or asset group's datasheet in the
record explorer. The Quantity can be manually modified by entering a new number in the field. Every
cost, entered or imported, is multiplied by the Quantity in the element's cost summary row.
11. In the Operating Profile subsection, complete the Measurement Unit, Value of Unit, Measurement
Frequency, and Rate Capacity fields.
Tip: Once the Measurement Unit is entered, it is saved in a drop down list for future use.
© 2021 General Electric Company 2712. Select the row of the secondary element for which you want to enter the operating rate.
Note: The Operating Rate For subsection is enabled once a secondary element is selected.
13. In the Operating Profile subsection, in the grid, select .
A new row appears.
14. In the new row, enter values in the Profile Name, Operating %, From, and To boxes.
Note: Profiles are used as the revenue model for the scenario; therefore, a warning message will
appear if Profiles overlap or there is a gap where there is no associated profile. One or many Profiles
can be created to cover the span of the analysis.
15. In the new row, if you want the profile to repeat annually, then select the Repeat Annually check box.
16. Select .
The scenario is saved.
Create a Profile
Procedure
1. Access the Scenario for which you want to create a profile.
2. In the Operating Profile subsection of the Scenario Definition section, select .
A new row appears in the grid.
3. In the new row, enter values in the Profile Name, Operating %, From, and To boxes.
Note: Profiles are used as the revenue model for the scenario; therefore, a warning message will
appear if Profiles overlap or there is a gap where there is no associated profile. One or many Profiles
can be created to cover the span of the analysis.
4. In the new row, if you want the profile to repeat annually, then select the Repeat Annually check box.
5. Select .
The profile is created.
Create a Secondary Element
Procedure
1. Access the Scenario to which you want to create a secondary element.
2. In the Details subsection, in the upper-left corner of the grid, select .
A new row appears in the grid.
28 © 2021 General Electric Company3. Enter a Secondary Element Name.
4. To associate the secondary element with either an Asset or an Asset Group, in the Asset Hierarchy
ID cell, select .
The Asset Finder window appears.
© 2021 General Electric Company 29Delete a Secondary Element
Procedure
1. Access the Scenario from which you want to delete a secondary element.
2. In the row for the secondary element that you want to delete, select the check box, and then select
.
A confirmation message appears.
3. Select OK.
The selected secondary element and all links to assets or groups created when the element was
added are deleted.
30 © 2021 General Electric CompanyImport Scenario Elements Into an Analysis
About This Task
You can use the import feature within the Scenario Definition section to create a new, comprehensive
analysis by adding primary and secondary elements from previously created analyses. These will appear
as secondary elements in the target scenario.
Procedure
1. Access the scenario into which you want to import a previously created scenario's elements.
2. In the Details subsection, select .
The Import Secondary Elements window appears, displaying a list of scenarios. The list is comprised
of scenarios with the same site, start date, period type, and number of periods as the target analysis.
3. Select the scenario that contains elements you want to import into the analysis, and then select
Import.
The primary and secondary elements from the selected scenario appear in the Details subsection. In
addition, all associated capital and operating costs for the imported elements are imported.
© 2021 General Electric Company 31Copy a Scenario Within an Analysis
Procedure
1. Access a Scenario.
2. In the left pane, select .
A confirmation message appears.
3. Select Yes.
The workspace for the copied scenario appears, displaying all the copied information from the original
scenario. The scenario is saved, with its name based on the following format: Copy
If you want to change the name of the scenario, you can enter the new name in the Scenario ID field,
and then select .
Delete a Profile
Procedure
1. Access the Scenario containing the profile that you want to delete.
2. In the Profile section grid, select the check box beside the profile that you want to delete.
3. Select .
A confirmation message appears.
4. Select Yes.
The profile is deleted and its associated revenues are removed from the cost data grid.
Delete a Scenario
Procedure
1. Access the LCC Analysis containing the scenario that you want to delete.
2. In the left pane, select the scenario that you want to delete, and then select .
A confirmation message appears.
3. Select Yes.
The scenario is deleted.
32 © 2021 General Electric CompanyCost Data
About Cost Data
Cost Data includes all of the costs that an Asset or Group of Assets will incur throughout the life span of
an asset. It is essential that all Cost Data is collected before and throughout the LCC Analyses to maximize
reliability and accuracy.
Example
For example, if the asset is a fleet of service vehicles, you would want to collect the
following types of Cost Data:
• Maintenance Costs
• Replacement Parts
• Energy Costs
• Driver Costs
By collecting all of the above Cost Data, you can create an analysis to maintain, track,
and predict costs throughout the lifespan of the fleet of service vehicles.
About Operating Costs
Blank Rows
Blank rows provide the option to add costs to the grid and apply them the applicable period(s).
Known Interval/Cost
Known interval cost data provides the ability for you to track the ongoing costs that occur on a regular
basis.
For example, a fleet of trucks have their air filters changed every 6 months. Air filter maintenance can be
logged in the cost data grid by adding a Known Interval/cost and continued every 6 months for the life of
the truck.
Distributed Costs
Distributed costs can be added where the user has the option to specify the distribution type and
distribution parameters. The application of these costs will distribute the mean cost over all periods
within the scenario based upon the shape of the distribution that was specified.
In a scenario with 10 yearly periods, where the user elects to apply a distributed cost
with the following parameters:
• Mean Cost: 50000
• Distribution Type Weibull
• Beta: 1.25
• Eta: 72 (months)
• Gamma: 0
The costs would be applied as follows:
© 2021 General Electric Company 33Period Cost
Period 1 5051
Period 2 6137
Period 3 5975
Period 4 5463
Period 5 4823
Period 6 4158
Period 7 3521
Period 8 2940
Period 9 2425
Period 10 1981
About Import Cost Data
In LCC, you are able to import cost data from sources including Work Histories, Strategy Actions,
Production Events, and Datasets. Importing cost data in various forms allows you to evaluate the Total
Cost of Ownership for an asset with all of the information in the Cost Data grid.
Possible Cost Data you may want to import:
• Equipment Failures.
• Shutdowns and Slowdowns + Maintenance actions.
• Insurance costs.
• Fuel/Energy usage.
34 © 2021 General Electric CompanyAbout Calculated Values
Calculated Values are located at the top of the Cost Data grid and are automatically factored or calculated
from data from the Primary Element and Secondary Elements. Calculated values provide a mathmatical
summation of the costs associated with each of the elements within the analysis.
Calculated Values Include:
• Capital Costs
• Operational Costs
• Total Depreciated Values
• Revenue
• Cash Flow
• Present Value
• Planned Unit Consumption
• Equivalent Unit Cost
Access a Cost Data Grid
Before You Begin
• Create a Scenario
Procedure
1. Access a Scenario.
2. Select Cost Data.
The Cost Data section appears, displaying the Cost Data grid.
Note: The unit displayed in grid heading (i.e., quarters, months, or years) is based on the Analysis
Period Unit that you selected when you created the analysis.
© 2021 General Electric Company 35Create a Resource
Procedure
1. Access a Cost Data grid.
2. In the cell for the Cost Element to which you want to add a resource, select , and then select Add a
New Resource.
The Create a New Resource window appears.
3. As needed, enter values in the available fields, and then select Next.
The Apply Resource section appears.
36 © 2021 General Electric Company4. Enter values in the Quantity, Consumption Unit, Period Usage, and Periods boxes, and then select
Finish.
The new resource is added.
Add an Existing Resource
Procedure
1. Access a Cost Data grid.
2. In the cell for the Cost Element to which you want to add a resource, select , and then select Add
Existing Resource.
The Select Resources section appears.
© 2021 General Electric Company 373. Beside each resource that you want to add, select the check box, and then select Next.
The selected resources appear in the Apply Resource section.
4. Enter values in the Quantity, Consumption Unit, Period Usage, and Periods boxes.
If you want to add another resource, select .
5. Select Finish.
The selected resources are added.
Create a Secondary Element in the Cost Data Grid
Procedure
1. Access a Cost Data grid.
2. In the primary element cell, select .
The Add Secondary Element window appears.
38 © 2021 General Electric Company3. If you want to add an element that is listed in the hierarchy:
a. Beside the Asset Hierarchy ID box, select .
The Hierarchy window appears.
b. Navigate to and select an Asset, and then select Done.
c. Enter values in the Secondary Element and Quantity boxes.
Note: Quantity, which has a default of 1, is used as a multiplier. For example, if the quantity is
equal to 10, all of the operating and capital costs are multiplied by 10.
d. On the Add Secondary Element window, select OK.
-or-
If you want to add an element that is not listed in the hierarchy:
a. Enter values in the Secondary Element and Quantity boxes, and then select OK.
Important: When adding an asset not listed in the hierarchy, the import features may not have the
context needed to function and will return null results.
The secondary element appears in the Cost Data grid.
Copy a Secondary Element
Procedure
1. Access a Cost Data grid that contains at least one secondary element.
2. Select the row that contains the secondary element that you want to copy.
The selected row is highlighted.
3. In the upper-right corner of the Cost Data section, select .
© 2021 General Electric Company 39The Copy selected item? dialog box appears, asking you to confirm that you want to copy the
selected secondary element.
4. Select Yes.
The copied secondary element appears in the Cost Data grid and in the Details subsection of the
Scenario Definition section.
Note: The quantity of the new secondary element will be set to 1, regardless of the quantity of the
secondary element you copied. The asset associated with the original secondary element will be
removed.
Create Operating Costs Manually
Procedure
• Create a Blank Row
1. Access a Cost Data grid.
2. In the Operating Cost cell, select , and then select Blank Row.
A new row appears.
3. In the new row, enter values in the cells.
• Create a Known Interval/Cost
1. Access a Cost Data grid.
2. In the Operating Cost cell, select , and then select Known Interval/Cost.
The Add Known Interval Cost window appears.
40 © 2021 General Electric Company3. Enter values in the Cost Name, Cost, Interval, Interval Unit, Start Date boxes.
4. Select OK.
The Known Interval Cost is added in a new row in the Cost Data grid according to the interval
within the analysis period row or column.
• Create a Distributed Cost
1. Access a Cost Data grid.
2. In the Operating Cost cell, select , and then select Distributed Cost.
The Add Distributed Cost window appears.
© 2021 General Electric Company 413. As needed, modify the Cost Name, Mean Cost, Interval Unit, Interval Distribution Type, Beta,
Eta, and Gamma boxes, and then select OK.
Based on the Interval Distribution Type selection, the Distributed Cost is added in a new row to the
Cost Data grid.
Import Cost Data
About This Task
Important: To execute this procedure, membership in Security Groups additional to those normally
associated with this module is required. For more information, please see the Security Groups topic.
Procedure
• Import Work History
1. Access a Cost Data grid.
2. In the element section to which you want to add cost data, in the Operating Cost cell, select ,
and then select Import Data.
The Import Operating Cost Data window appears.
42 © 2021 General Electric Company3. Depending on the type of source that you want to import, select the Work History, Strategy
Action, Production Event, or Dataset check box.
4. Select Next.
Based on the assets associated with the element, a list of work history events and their associated
event types and costs appears.
© 2021 General Electric Company 435. Select the work history events that you want to import, and then select Next.
The Data Mapping section appears.
44 © 2021 General Electric Company6. In the Start Date and End Date boxes, select dates to set the Review Period for the events you are
importing, then select Next.
A list of the costs that you are importing appears.
© 2021 General Electric Company 457. Depending on how you want the data to be displayed in the grid, select Individual Costs or Group
costs and sum total.
If Individual Costs is selected, then each selected event will add a new row to the Cost Data grid.
If Group costs and sum total is selected, then all selected action costs are summed by year
number and inserted into grid as one row.
8. Select Finish.
The selected cost data is imported to the Cost Data grid and repeated every review period until the
end of the analysis with cost inflation applied.
• Import Strategy Action Costs
1. Access a Cost Data grid.
2. In the element section to which you want to add cost data, in the Operating Cost cell, select ,
and then select Import Data.
The Import Operating Cost Data window appears.
46 © 2021 General Electric Company3. Depending on the type of source that you want to import, select the Work History, Strategy
Action, Production Event, or Dataset check box.
4. Select Next.
A list of Strategy Actions related to the asset or asset group selected in the primary or secondary
element appears.
© 2021 General Electric Company 475. Beside each Strategy Action that you want to import, select the check box, and then select Next
The Strategy Actions associated with the asset will only appear in the list if the strategy is currently
active.
The Confirmation screen appears displaying the list of Strategy Actions that you selected and
their associated costs.
48 © 2021 General Electric Company6. Select Individual Costs or Group costs and sum total, depending on how you want the data to
be displayed in the grid.
If Individual Costs is selected, each selected action will add a new row to the cost grid. If Group
costs and sum total is selected, all selected action costs are summed by year number and
inserted into grid as one row.
7. Select Finish.
The selected cost data is imported to the Cost Data grid.
• Import Production Event Costs
1. Access a Cost Data grid.
2. In the element section to which you want to add cost data, in the Operating Cost cell, select ,
and then select Import Data.
The Import Operating Cost Data window appears.
© 2021 General Electric Company 493. Depending on the type of source that you want to import, select the Work History, Strategy
Action, Production Event, or Dataset check box.
4. Select Next.
A list of Production Events appears based on the event, where the causing asset has been
associated with either primary or secondary elements.
50 © 2021 General Electric Company5. Beside each Production Event that you want to import, select the check box, and then select Next.
The Data Mapping section appears.
© 2021 General Electric Company 516. Enter values in the Cost ID, Cost, Date, Start Date, and End Date boxes, and then select Next.
The Date selection in the Data Mapping subsection determines whether repeat events are based
on the Start Date or End Date of the source event. The Start Date and End Date fields in the Review
Period subsection define the frequency of the repeat events.
7. Select Individual Costs or Group costs and sum total, depending on how you want the data to
be displayed in the grid, and then select Finish.
If Individual Costs is selected, each selected action will add a new row to the cost grid. If Group
costs and sum total is selected, all selected action costs are summed by year number and
inserted into grid as one row.
The selected cost data is imported to the Cost Data grid and repeated every review period until the
end of the analysis with cost inflation applied.
• Import a Dataset
1. Access a Cost Data grid.
2. In the element section to which you want to add cost data, in the Operating Cost cell, select ,
and then select Import Data.
The Import Operating Cost Data window appears.
52 © 2021 General Electric Company3. Depending on the type of source that you want to import, select the Work History, Strategy
Action, Production Event, or Dataset check box.
4. Select Browse.
The Select a Dataset from the catalog window appears.
© 2021 General Electric Company 535. Navigate to and select the data that you want to import.
6. Select Open.
The dataset link is automatically populated in the Dataset box.
7. Select Next.
Data from the the selected dataset is displayed.
54 © 2021 General Electric Company8. Select the data that that you want to insert into the Cost Data grid.
9. Select Next.
The Data Mapping section appears.
10. Enter the Cost ID, Cost, Date, Start Date, and End Date values.
The difference between the Date value in each row and the Start Date entered in step 10 will
determine the period number of each row. For example, if year number is 5, then the current cost
will be populated in the Year 5 column. The Review Period Start Date must precede the date of the
first imported cost. The Review Period End Date must follow the date of the most recent imported
cost.
11. Select Next.
A list of costs that you are importing appears.
12. Depending on how you want the data to be displayed in the grid, select Individual Costs or Group
costs and sum total.
If Individual Costs is selected, each cost will be inserted into the grid as a new row. If Group costs
and sum total is selected, all costs will be combined and only one new row will be inserted into
the grid.
13. Select Finish.
The selected cost data is imported to the Cost Data grid and repeated every review period until the
end of the analysis with cost inflation applied.
© 2021 General Electric Company 55Access Calculated Values
About This Task
Calculated Values are available in the Cost Data grid for each scenario and for each period within each
scenario. For information on the formulas used to calculate the values, refer to the Rates and Calculations
section.
Note: The values appear a whole numbers in the grid. However, the actual value appears when the cell is
selected and is what is stored in the database. If a number is too long to fit in the cell, then scientific
notation is used.
Procedure
1. Access a Cost Data grid.
The Calculated Values row appears at the top of the Cost Data grid with values listed in columns
including:
• Total Cost of Ownership (TCO)
• Net Present Value (NPV)
• Internal Return Rate (IRR)
• Planned Unit Consumption (PUC)
• Equivalent Unit Cost (EUC)
2. Expand the Calculated Values row.
The grid and various sub rows containing calculated values appear.
Sub rows include:
• Capital Costs
Note: Capital Costs sums the capital costs of all elements in the scenario.
• Operational Costs
Note: Operational Costs sums the operating costs of all elements in the scenario.
• Total Depreciated Value
Note: Total Depreciated Value sums the depreciated values for both primary and secondary
elements
• Revenue
• Cash Flow
• Present Value (PV)
Add Capital Costs to the Cost Data Grid
About This Task
In LCC, you have the ability to add the value or cost of an asset into the calculation using the Capital Cost
section of the Cost Data grid. The added capital costs are depreciated according to the method and rate
determined in the analysis model. Capital Costs can be added at the Primary and Secondary Element
levels.
56 © 2021 General Electric CompanyInitial Values are entered at Year 0 and are not treated as costs or revenue, as they are the value of the
element at T0 before the analysis. The total capital cost for an element is the sum of rows underneath it,
excluding the initial value row, salvage value row, and depreciated value row.
Capital Costs are added to the depreciated value of the element and the Depreciated Value sum shown in
the calculated values for the period. Capital costs and Initial Value are depreciated to the Salvage Value in
the period in which the salvage is taken.
Procedure
1. Access a Cost Data grid.
2. Expand the Primary Element Name or Secondary Element section.
3. Expand the Capital Cost section.
4. Select the cell beside the value that you want to add in the corresponding column.
5. Enter the value.
6. Select any other cell.
Your changes have been saved.
Note: Sums are displayed in the Sum of Capital Costs row at the top of the Capital Cost section.
Delete Cost Data
Procedure
1. Access a Cost Data grid.
2. Select the row containing the data that you want to delete, and then, in the upper-right corner of the
section, select Delete.
© 2021 General Electric Company 57A confirmation message appears.
3. Select Yes.
The Cost Data has been deleted.
58 © 2021 General Electric CompanyDeployment
Deploy LCC for the First Time
Before You Begin
The following table outlines the steps that you must complete to deploy and configure this module for the
first time.
These tasks may be completed by multiple people in your organization. GE Digital recommends, however,
that the tasks be completed in the order in which they are listed.
Before you begin completing these tasks, review the system requirements for this module to identify the
supported features for this module in GE Digital APM.
Upgrade LCC
Before You Begin
The following tables outline the steps that you must complete to upgrade this module to the latest
version of GE Digital APM .
These tasks may be completed by multiple people in your organization. We recommend, however, that the
tasks be completed in the order in which they are listed.
Procedure
• Upgrade to the latest version of GE Digital APM.
This module will be updated to the latest version of GE Digital APM automatically. No additional steps
are required.
LCC Security Groups
The following table lists the baseline Security Groups available for users within this module, as well as the
baseline Roles to which those Security Groups are assigned. In Predix APM, Roles are assigned to Security
Users through permission sets.
Important: Assigning a Security User to a Role grants that user the privileges associated with all of the
Security Groups that are assigned to that Role. To avoid granting a Security User unintended privileges,
before assigning a Security User to a Role, be sure to review all of the privileges associated with the
Security Groups assigned to that Role.
© 2021 General Electric Company 59Security Group Roles
MI LCC Administrator MI APM Viewer
MI Strategy User
MI Strategy Power
MI Strategy Admin
MI LCC User MI Strategy User
MI Strategy Power
MI LCC Viewer MI APM Viewer
The baseline family-level privileges that exist for these Security Groups are summarized in the following
table.
Family LCC Administrator LCC User LCC Viewer
Entity Families
LCC Analysis View, Update, Insert, Delete View, Update, Insert, Delete View
LCC Cost View, Update, Insert, Delete View, Update, Insert, Delete View
LCC Cost Value View, Update, Insert, Delete View, Update, Insert, Delete View
LCC Element View, Update, Insert, Delete View, Update, Insert, Delete View
LCC Operating Profile View, Update, Insert, Delete View, Update, Insert, Delete View
LCC Period View, Update, Insert, Delete View, Update, Insert, Delete View
LCC Resource View, Update, Insert, Delete View, Update, Insert, Delete View
LCC Scenario View, Update, Insert, Delete View, Update, Insert, Delete View
Relationship Families
Has Associated LCC Element View, Update, Insert, Delete View, Update, Insert, Delete View
Has LCC Member View, Update, Insert, Delete View, Update, Insert, Delete View
Has LCC Cost View, Update, Insert, Delete View, Update, Insert, Delete View
Has LCC Cost Value View, Update, Insert, Delete View, Update, Insert, Delete View
Has LCC Element View, Update, Insert, Delete View, Update, Insert, Delete View
Has LCC Operating Profile View, Update, Insert, Delete View, Update, Insert, Delete View
Has LCC Period View, Update, Insert, Delete View, Update, Insert, Delete View
Has LCC Scenario View, Update, Insert, Delete View, Update, Insert, Delete View
60 © 2021 General Electric CompanyReference
General Reference
LCC Site Filtering
A Life Cycle Cost Analysis is assigned a site and spread to all the related records, such as Analysis records
and Cost records. In LCC, users will see only LCC Analyses that are assigned to their site(s) or that are
global records.
Tip: For more information, refer to the Site Filtering section of the documentation.
When a user with multiple sites creates an LCC Analysis, the user will have the option of selecting one of
the sites or selecting Global.
When a user makes an asset selection, the list of assets is limited to assets that have the same site as the
analysis.
Resources are all viewable by any user and can be used in any analysis.
Example
Consider an organization that has three sites, Site X, Site Y, and Site Z. The following
LCC Analysis records exist:
• LCC Analysis A: Assigned to Site X
• LCC Analysis B: Assigned to Site Y
• LCC Analysis C: Assigned to Site Z
• LCC Analysis D: No site assigned (global record)
Scenario 1: User assigned to only Site X
This user will see LCC Analyses A and D.
Scenario 2: User assigned to both Site X and Site Y
This user will see LCC Analyses A, B, and D.
Scenario 3: Super User
This user will see LCC Analyses A, B, C, and D.
Important: If a multi-site user or a Super User links child records from multiple sites
to a parent record designated as a global record, then another user who does not
have access to all sites may only see a portion of the data associated with that record.
In the example above, if a child record assigned to Site X and a child record assigned
to Site Y are linked to LCC Analysis D, the Site X user will not be able to see all the
records associated with LCC Analysis D.
LCC Data Model
The following diagram shows how the families used in LCC are related to one another.
© 2021 General Electric Company 61Note: In the diagram, boxes represent entity families and lines represent relationship families that are
configured in the baseline database. You can determine the direction of the each relationship definition
from the direction of the arrowhead: the box from which the arrow originates is the predecessor, and the
box to which the arrow head points is the successor.
LCC URLs
There is one URL route associated with Life Cycle Cost Analysis: LCC. The following table describes the
various paths that build on the route, and the elements that you can specify for each.
Tip: For more information, refer to the URLs section of the documentation.
Element Description Accepted Value(s) Notes
lcc/dashboard/0: Displays the LCC Dashboard (no asset context).
lcc/dashboard/0/: Displays the LCC Dashboard with an asset context.
AssetKey Entity key of the selected None N/A
asset
lcc/shell/0/summary: Displays the Definition of a new LCC Analysis. Used to create a new LCC Analysis.
62 © 2021 General Electric CompanyElement Description Accepted Value(s) Notes
lcc/shell//summary: Displays the Overview and Definition of an existing LCC Analysis. Used to open an existing LCC
Analysis.
AnalysisKey Entity key of a LCC Analysis None N/A
record
lcc/shell//scenario/0/definition: Displays the Scenario Definition for a new scenario in an existing LCC Analysis. Used
to add a new scenario to an existing LCC Analysis
AnalysisKey Entity key of a LCC Analysis None N/A
record
lcc/shell//scenario//definition: Displays the Scenario Definition for an existing scenario in an existing
LCC Analysis. Used to open an existing scenario in an existing LCC Analysis and show Scenario Definition.
AnalysisKey Entity key of a LCC Analysis None N/A
record
ScenarioKey Entity key of a LCC Scenario None N/A
record
lcc/shell//scenario//grid: Displays the Cost Data for an existing scenario in an existing LCC Analysis.
Used to open an existing scenario in an existing LCC Analysis and show Cost Data.
AnalysisKey Entity key of a LCC Analysis None N/A
record
ScenarioKey Entity key of a LCC Scenario None N/A
record
Example URLs
Example URL Destination
lcc/dashboard/0 LCC Overview page
lcc/dashboard/0/1234567 LCC Overview page in the context of an asset with the Entity
Key 1234567
lcc/shell/0/summary LCC Analysis Definition page to create a new LCC Analysis
lcc/shell/1234567/summary LCC Analysis Overview page and LCC Definition page of an
existing LCC Analysis with the Entity Key 1234567
lcc/shell/1234567/scenario/0/definition Scenario Definition page to add a new scenario to an existing
LCC Analysis with the Entity Key 1234567
lcc/shell/1234567/scenario/7654321/definition Scenario Definition page of an existing scenario with the
Entity Key 7654321 in an existing LCC Analysis with the Entity
Key 1234567
lcc/shell/1234567/scenario/7654321/grid Cost Data page of an existing scenario with Entity Key 7654321
in an existing LCC Analysis with the Entity Key 1234567
LCC System Code Tables
The following table lists the System Code Tables that are used by LCC:
© 2021 General Electric Company 63Table ID Table Description Function
MI_LCC_CAL_VAL_TYPE Calculated Value Type Populates the cost name for costs that
are a subcategory of Calculated Values.
MI_LCC_COST_TYPE Cost Type Populates the cost name for costs that
are a subcategory of the primary or
secondary element.
MI_LCC_DEPRECIATION_METHOD Depreciation Method Populates the Depreciation Method field
in LCC Analysis records.
MI_LCC_FIXED_COST_TYPE Capital Cost Type Populates the name for costs in the
Capital Cost subcategory.
MI_LCC_INTEREST_RATE_TYPE Interest Rate Type Populates the Interest Rate Type field in
LCC Analysis records.
MI_LCC_PERIOD_UNITS Period Units Populates the Period Unit field in
LCC Analysis records.
MI_LCC_PROFILE_UNITS Profile Rate Units Populates the Measurement Frequency
field in LCC Scenario records.
MI_LCC_RESOURCE_CATEGORY Resource Category Populates the Type field in LCC Resource
records.
MI_LCC_TEAM_MEMBER_TYPE LCC Team Member Type Populates the Type field for LCC Team
Members.
Family Field Descriptions
Analysis Records
Analysis records store information about the fields in the Analysis family that are used to populate the
fields for the Analysis Definition. This topic provides an alphabetical list and description of the fields that
exist for the Analysis family and appear on the LCC Analysis datasheet. The information in the table
reflects the baseline state and behavior of these fields.
This family is enabled for site filtering, which means that records in this family can be assigned to a
specific site, and will only be accessible to users who are assigned to the same site and have the
appropriate license and family privileges. For more information, refer to the Sites section of the
documentation.
Field Data Type Description Behavior and Usage
Analysis Period Unit Character The time for unit period. The default value for this field
is years.
This field is required.
Annual Effective Interest Rate Numeric The annualized compounding This value must be a positive
interest rate. number.
This field is required.
64 © 2021 General Electric CompanyYou can also read