Interim Assessments Interpretive Guide - February 21, 2019 2019 Smarter Balanced Assessment Consortium - Smarter Balanced Member Portal
←
→
Page content transcription
If your browser does not render page correctly, please read the page content below
Interim Assessments Interpretive Guide
                               February 21, 2019

                      © 2019 Smarter Balanced Assessment Consortium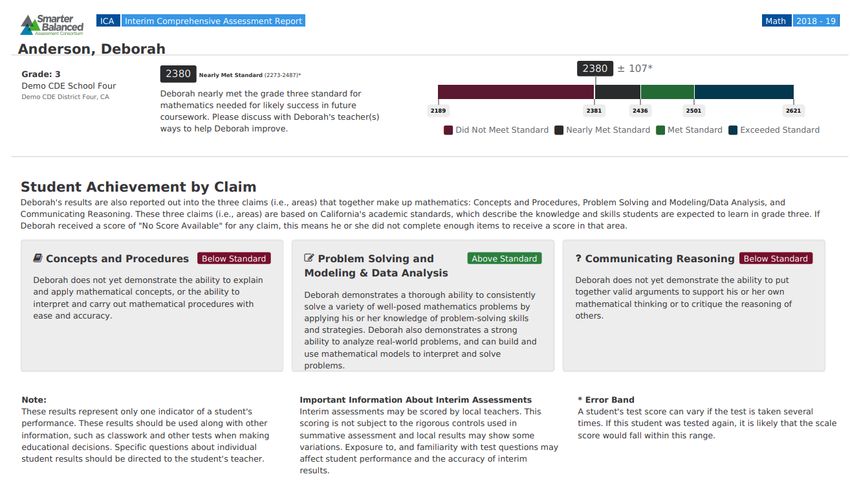
Interim Assessments Interpretive Guide

Contents
   List of Tables and Figures ...........................................................................................................................................3
Purpose of the Smarter Balanced Interim Assessments Interpretive Guide ................................................................4
Smarter Balanced Assessment System ......................................................................................................................4
   Two Types of Interim Assessments ........................................................................................................................5
   Assessment Content ...............................................................................................................................................6
   Administration of the Interim Assessments .............................................................................................................6
           Table 1. Possible Uses of the Interim Assessments: Examples of Standardized and
           Nonstandardized Administration ................................................................................................................7
Understanding Smarter Balanced Assessment Results ..............................................................................................8
   Group-Level Results ...............................................................................................................................................8
   Student-Level Results .............................................................................................................................................8
   Item-Level Results ..................................................................................................................................................8
   Scale Scores and Error Band .................................................................................................................................8
           Figure 1. Smarter Balanced Vertical Scale................................................................................................9
   Reporting Overall Performance on Interim Assessments .....................................................................................10
   Interim Assessment Blocks ...................................................................................................................................10
           Figure 2. Comparison between Performance Standard and the IAB Scale Score and Confidence
           Interval to determine IAB Reporting Category ........................................................................................11
   Interim Comprehensive Assessments...................................................................................................................11
           Figure 3. Smarter Balanced Summative and ICA Scale Score Ranges by Content and Grade ...........12
Guidelines for Appropriate Use of Test Results ........................................................................................................12
           Figure 4. Student’s Scale Score and Error Band .....................................................................................13
The IAB Dashboard: A Quick View of Overall Group-level Results ...........................................................................15
           Figure 5. IAB Dashboard. ..........................................................................................................................15
Example of Classroom Use of an IAB: End-of-Unit Assessment ...............................................................................16
   Group-Level Analysis ............................................................................................................................................16
           Figure 6. Group-Level View of IAB Results..............................................................................................16
   Group Item-Level Analysis ....................................................................................................................................17
           Figure 7. Item-Level View of IAB Results: Group Scores ......................................................................17
   Student-Level Analysis .........................................................................................................................................18
           Figure 8. Student-Level View of IAB Results ...........................................................................................18
           Figure 9. Individual Student Item-Level View of IAB Information ..........................................................19
           Figure 10. Item-Level Tabs ........................................................................................................................19
           Figure 11. Rubric and Exemplar Tab ........................................................................................................20
                                                                                                                                                          Page 1 of 41
Interim Assessments Interpretive Guide

           Figure 12. Item Information Tab ................................................................................................................20
           Table 2. Depth of Knowledge Levels ........................................................................................................21
           Table 3. Item Difficulty Categories............................................................................................................21
   Key and Distractor Analysis ..................................................................................................................................22
           Figure 13. Select to View Key/Distractor Analysis ..................................................................................23
           Figure 14. Key and Distractor Analysis View..........................................................................................24
           Figure 15. Key and Distractor Analysis Item Details Tabs ....................................................................25
   Writing Trait Score Report ....................................................................................................................................25
           Figure 16. Group Report on the Essay Question ...................................................................................25
           Figure 17. Individual Student Report on the Essay Question ...............................................................27
   Using IAB Results to Inform Next Steps for Instruction .........................................................................................27
   Smarter Balanced Digital Library ..........................................................................................................................28
   Digital Library Connections Playlists .....................................................................................................................28
           Figure 18. Smarter Balanced Connections Playlist for Grade 5 Fractions............................................29
   Glossary of Terms ................................................................................................................................................30
Appendix A: Resources to Support the Use of Interim Assessments ........................................................................32
   Test Blueprints ......................................................................................................................................................32
           Figure A1. Grade 5 Block 4 IAB: Revision ...............................................................................................33
           Figure A2. Grade 5 Block 3 IAB: Brief Writes ..........................................................................................34
           Figure A3. Grade 5 Block 8 IAB: Informational Performance Task ........................................................34
Appendix B: A Parent and Student Guide to Understanding the Interim Assessment Reports .................................35
   What Are the Interim Assessment Blocks? ...........................................................................................................35
   What Do the Interim Assessment Block Scores Mean? ........................................................................................35
   What Are the Interim Comprehensive Assessments? ...........................................................................................35
   What Do the Interim Comprehensive Assessment Scores Mean?........................................................................35
   How Accurate Are the Interim Assessments? .......................................................................................................36
   One Measure of a Student’s Success ...................................................................................................................36
   Sample Interim Assessment Block Individual Student Report ..............................................................................37
   Sample Interim Comprehensive Assessment Individual Student Report ..............................................................39

                                                                                                                                                           Page 2 of 41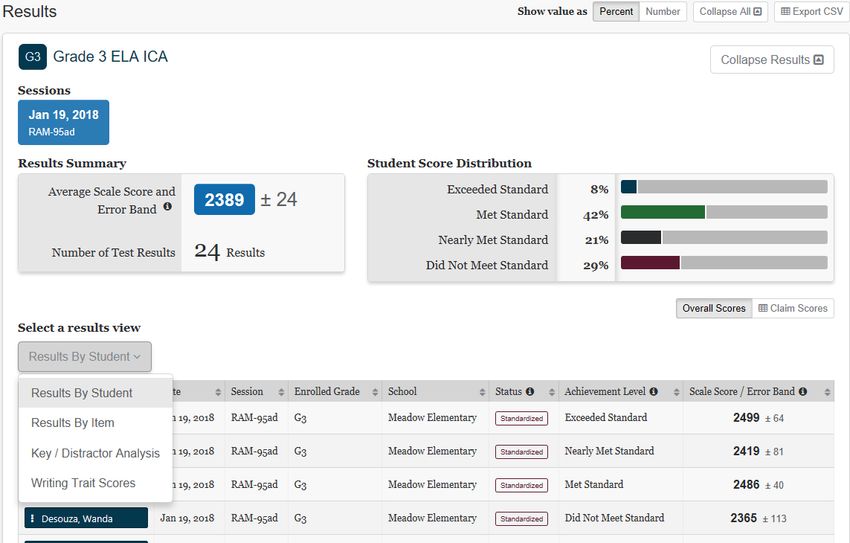
Interim Assessments Interpretive Guide

List of Tables and Figures
Table 1. Possible Uses of the Interim Assessments: Examples of Standardized and Nonstandardized
Administration ...........................................................................................................................................................7
Figure 1. Smarter Balanced Vertical Scale.............................................................................................................9
Figure 2. Comparison between Performance Standard and the IAB Scale Score and Confidence Interval to
determine IAB Reporting Category........................................................................................................................11
Figure 3. Smarter Balanced Summative and ICA Scale Score Ranges by Content and Grade ........................12
Figure 4. Student’s Scale Score and Error Band ..................................................................................................13
Figure 5. IAB Dashboard ........................................................................................................................................15
Figure 6. Group-Level View of IAB Results...........................................................................................................16
Figure 7. Item-Level View of IAB Results: Group Scores ...................................................................................17
Figure 8. Student-Level View of IAB Results ........................................................................................................18
Figure 9. Individual Student Item-Level View of IAB Information .......................................................................19
Figure 10. Item-Level Tabs .....................................................................................................................................19
Figure 11. Rubric and Exemplar Tab .....................................................................................................................20
Figure 12. Item Information Tab .............................................................................................................................20
Table 2. Depth of Knowledge Levels .....................................................................................................................21
Table 3. Item Difficulty Categories .........................................................................................................................21
Figure 13. Select to View Key/Distractor Analysis ...............................................................................................23
Figure 14. Key and Distractor Analysis View .......................................................................................................24
Figure 15. Key and Distractor Analysis Item Details Tabs .................................................................................25
Figure 16. Group Report on the Essay Question.................................................................................................25
Figure 17. Individual Student Report on the Essay Question ............................................................................27
Figure 18. Smarter Balanced Connections Playlist for Grade 5 Fractions .........................................................29
Figure A1. Grade 5 Block 4 IAB: Revision ............................................................................................................33
Figure A2. Grade 5 Block 3 IAB: Brief Writes .......................................................................................................34
Figure A3. Grade 5 Block 8 IAB: Informational Performance Task .....................................................................34

                                                                                                                                                           Page 3 of 41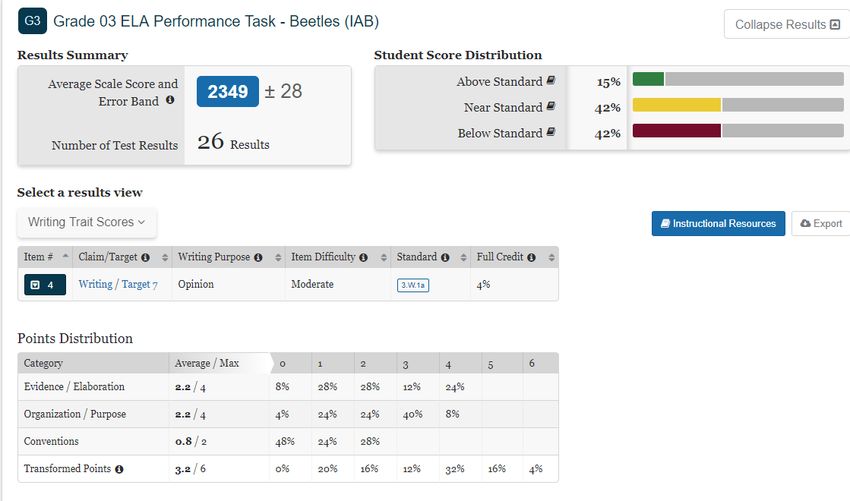
Interim Assessments Interpretive Guide

Purpose of the Smarter Balanced Interim
Assessments Interpretive Guide
THE SMARTER BALANCED INTERIM ASSESSMENTS INTERPRETIVE GUIDE IS DESIGNED TO HELP EDUCATORS, PARENTS, AND
OTHER STAKEHOLDERS INTERPRET INTERIM ASSESSMENT REPORTS OF THE SMARTER BALANCED REPORTING SYSTEM.

This document focuses on interpreting student test results for the Interim Assessment Blocks (IABs) and
the Interim Comprehensive Assessments (ICAs), which are one component of a comprehensive three-part
assessment system. The guide addresses questions of how to evaluate group, student, and item-level data
from these assessments to improve teaching and learning. Appendix A provides a list of helpful resources
that support the use of interim assessments. Appendix B provides guidance on the Individual Student
Report (ISR) for use in student and parent discussions.

Smarter Balanced Assessment System
The Smarter Balanced Assessment System has three major components:

   Summative Assessments                       Interim Assessments                           Digital Library
 End-of-year assessments that             Designed to support teaching and          A suite of tools and resources that
 measure student achievement and          learning throughout the year.             support a classroom-based
 growth in English and mathematics                                                  formative assessment process.
 in grades 3-8 and HS.

Administration of the interim assessments is flexible and can serve a variety of educator and student needs.
Schools and school districts may establish timeframes, administration policies, and scoring practices for the interim
assessments, keeping in mind any guidance from their own state department of education. Educators can use the
interim assessments in a standardized fashion as an assessment of learning after a period of instruction, or in a
nonstandardized fashion (e.g., teaching tool, warm-up activity) as an assessment for learning. The interim
assessments are powerful resources to improve teaching and learning for all students.

“Assessment has two fundamental purposes: one is to provide information about student learning minute-by-minute, day-to-
day, and week-to-week so teachers can continuously adapt instruction to meet students’ specific needs and secure progress.
This type of assessment is intended to assist learning and is often referred to as formative assessment or assessment for
learning. A second purpose of assessment is to provide information on students’ current levels of achievement after a period
of learning has occurred. Such assessments – which may be classroom-based, districtwide, or statewide – serve a summative
purpose and are sometimes referred to as assessments of learning.”
                                                                                  California Department of Education (2014)
                                                          English Language Arts/English Language Development Framework
                                                           for California Public Schools: Kindergarten through Grade Twelve

Interim assessments can serve a variety of educator needs. To better support the range of possible
uses consistent with member education agency policies, educators may establish the timeframe,
administration policies and scoring practices for interim assessments. The interim assessments are
                                                                                                                Page 4 of 41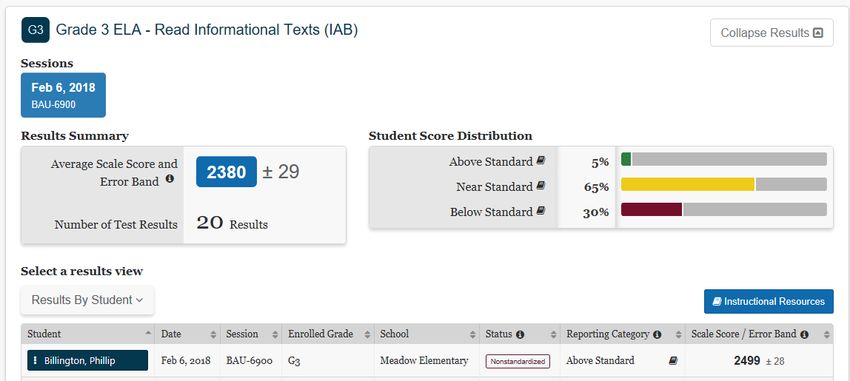
Interim Assessments Interpretive Guide

considered student and teacher facing. The student and teacher facing designation provides
educators the flexibility to access the test questions and their students' responses to the test
questions. Because of this flexibility, the interim assessments are not intended to be used for
accountability purposes. Interim assessments are not for public use, display, or distribution. This
allows educators to use the interim assessments in the intended manner. For this reason, any use,
display, or distribution of the interim assessments that results in access to individuals beyond
authorized local education agency staff and students is prohibited. The interim assessments also
include all the accessibility resources that are available in the summative assessment to provide
accurate results for all students. Finally, interim assessment items must not be copied into third party
systems without the permission of Smarter Balanced.

Two Types of Interim Assessments
Smarter Balanced offers two types of interim assessments: IABs and ICAs. The lists below provide a summary of
the features of each type.

                                                        Common Features:
          •   are available in English-language arts/literacy (ELA) and mathematics
          •   contain high-quality items that are placed on the same scale as the summative assessments and use the
              full array of accessibility resources and supports available on the summative assessments
          •   are designed for Grades 3 - 8 and high school, but may be administered to students in any grade level
          •   use the same item types and formats as the summative assessments
          •   include performance tasks
          •   are administered online using the same test delivery system as the summative assessments, but are fixed-
              form tests, not computer-adaptive

          Interim Assessment Blocks:                                          Interim Comprehensive Assessments:
      •     focus on specific topics (e.g., Measurement                   •   measure the same content and the same
            and Data, Fractions, Read Informational Text);                    standards as the Smarter Balanced
      •     can usually be administered in one class                          Summative Assessment;
            period; include between 4 and 18 items                        •   take between 3 and 4 hours to administer (like
            depending on grade and content area;                              the Smarter Balanced Summative
      •     provide information about student performance                     Assessment);
            in three categories: Above Standard, Near                     •   provide information about student performance
            Standard, and Below Standard;                                     overall (achievement levels) and for each
      •     include a performance task for each content                       claim in ELA and mathematics (three levels of
            area;                                                             performance);
      •     may require local hand scoring if the IAB                     •   include a performance task in each content
            includes constructed-response items or an                         area;
            essay;                                                        •   require local hand scoring of some
      •     may be administered to students in a manner                       constructed-response items and performance
            consistent with the sequence of the                               tasks;
            curriculum; and                                               •   may be used to determine the knowledge and
      •     may be administered as a standardized or                          skills of students after a significant period of
            nonstandardized assessment.                                       instruction; and
                                                                          •   may be administered as a standardized
                                                                                                                  Page 5 ofor41
                                                                              nonstandardized assessment.
Interim Assessments Interpretive Guide
Assessment Content
Both the IABs and the ICAs are available in ELA and mathematics in grades three through eight and high
school, though they may be administered to students in any grade for appropriate educational purposes.
The ICAs measure the same content and the same standards as the Smarter Balanced Summative
Assessment.
Administration of the Interim Assessments
The interim assessments can be administered flexibly by teachers to best meet their instructional needs. All
student results will note the manner in which the assessment was administered
(standardized/nonstandardized). This information is provided when viewing results in the online system or
on printed student reports.
Standardized
Standardized administration means that a student completes the interim assessment individually, following
the procedure for administration used for the summative assessments. Results from a standardized
administration can be interpreted in a consistent manner and used as a gauge of student learning that is
comparable across students. In this approach, the interim assessment is used as assessment of learning
after a period of instruction and results reflect an individual student’s mastery of the concepts assessed.
Standardized tests can be used as part of an assessment of learning and an assessment for learning.
Nonstandardized
Nonstandardized administration refers to any administration that is not consistent with the administration
requirements of the summative assessment. Some examples of nonstandardized administration might
include (but are not limited to):
• Administering tests while students answer cooperatively in pairs, in small groups, or as a whole
class. Teachers may elect to include some discussion time between test items, and may have
students hand score items as needed.
• Providing interim assessment resources other than those approved in the Usability, Accessibility
and Accommodations Guidelines (e.g., use of a multiplication table by a student who does not
have an IEP and a documented need for this accommodation).
Because nonstandardized administration does not necessarily describe the performance of individual
students in a comparable manner, caution must be used when making instructional decisions based on
results from a nonstandardized administration and when interpreting classroom results that incorporate
results from tests administered in a nonstandardized manner. Remember that results from a
nonstandardized administration of an interim assessment are more appropriately used in the assessment
for learning rather than the assessment of learning. Tables 1 below provides several examples of
standardized and nonstandardized administration of interim assessments.
STANDARDIZED ADMINISTRATION = ASSESSMENT OF LEARNING AND
ASSESSMENT FOR LEARNING
NONSTANDARDIZED ADMINISTRATION = ASSESSMENT FOR LEARNING
Page 6 of 41Interim Assessments Interpretive Guide
Table 1. Possible Uses of the Interim Assessments: Examples of Standardized and
Nonstandardized Administration
Standardized Administration Nonstandardized Administration
Example 1: Example 1:
A teacher recently changed instruction to The teacher displays an IAB item that requires
emphasize reading informational text. The teacher hand scoring using a vendor’s item viewer
administers a Read Informational Texts IAB to application and asks students to respond to the
assess the degree to which students learned the question on paper. The teacher scores the item
emphasized skills. using the scoring guides and uses the student
responses to inform next steps for instruction.
Example 2: Example 2:
A grade eight mathematics teacher administers the A teacher asks students to work in small groups
grade seven ICA in the fall to new students who and discuss the questions in an IAB as they take
did not take the Smarter Balanced Summative the test. This is followed with a class discussion.
Assessment the previous school year. The teacher
uses these results, along with grade seven
summative results for the other students, to
determine instructional focus in the first few weeks
of the school year.
Example 3: Example 3:
A district pilots a new writing program to improve A teacher administers an IAB during instruction.
students’ writing skills. Teachers administer the The teacher projects the items on the screen and
grade-level ELA Performance Task IAB. Teachers elicits answers from the class followed by a
score the students’ full writes using the IAHSS discussion about the reasoning behind student
Teachers use the results as one indicator of the responses.
degree to which the program improved students’
writing skills.
Page 7 of 41Interim Assessments Interpretive Guide
Understanding Smarter Balanced Assessment
Results
The Interim Assessment Reporting System allows educators to view results from the interim assessments
at the group, student, and item level to help identify what students know and can do and where they might
need additional support to master the content.
THE INTERIM ASSESSMENT REPORTING SYSTEM SHOWS RESULTS
ONLY FOR STUDENTS WHO COMPLETE THE ONLINE ASSESSMENT,
AND FOR WHICH AN EDUCATOR SCORES ALL HAND-SCORED ITEMS.
Group-Level Results
Group-level results can help educators evaluate the degree to which they may need to adjust their
instruction by analyzing areas in which students excel and areas where students need additional support.
The definition of a group is locally defined. Some examples are:
• a classroom of students
• a grade level of students or
• the students who participate in a special program (e.g., intervention or enrichment) who received
similar instruction
The Interim Assessment Reporting System allows users to establish customized groups or to display
results by grade-level within a school, educational services, or supports.
Student-Level Results
Student-level results can provide insight into those specific areas of content individual students have not
yet mastered, and the additional instructional support each individual student or group of students may
require.
Item-Level Results
Item-level results provide student responses to test questions and enable educators to evaluate any
patterns in responses by looking at items on which the group did well and items on which they struggled.
Scale Scores and Error Band
Results from the interim assessments include scale scores and an error band.
Student-Level Information
Scale Scores
Each student who completes a Smarter Balanced Interim or Summative Assessment receives an overall
scale score. The scale score is the basic unit of reporting. It allows for fair comparisons at both the
Page 8 of 41Interim Assessments Interpretive Guide
individual student level and the aggregate or group level. This scale ranges from approximately 2000 to
3000.
The Smarter Balanced scale is a vertical scale, which means that student performance in all grades is
reported on the same scale. This allows educators to compare a student’s scale score from a test in one
grade to that student’s scale score from a test in another grade. However, this comparison should be done
with caution, especially when interpreting or predicting scores for non-adjacent grade levels. An important
aspect of a vertical scale is that the overall score range for each grade steadily increases, and the
threshold scores between each level increase across grade levels. Figure 1 below shows the range of
scaled scores for each grade and content area.
Figure 1. Smarter Balanced Vertical Scale
Math ELA
3000 3000
Smarter Balanced Summative
Smarter Balanced Summative
2900 2900
2800 2800
2700 2700
2600 2600
Scaled Score
Scaled Score
2500 2500
2400 2400
2300 2300
2200 2200
2100 2100
2000 2000
Scale scores provide information about overall student performance and can be used to evaluate student
progress.
Error Band
Test scores are estimates of student achievement and come with a certain amount of measurement error
for several reasons, including the sample of test questions administered, testing conditions, or student
guessing. Each time a student takes a Smarter Balanced test, statistical procedures are used to calculate
the scale score and the standard error of measurement (SEM) for the student’s score. Since this
measurement error is known, the individual student report also provides the range of scores the student is
likely to earn if that student were to take the test multiple times, or a test of parallel construction and similar
difficulty, without receiving further instruction. This range, called an error band, represents one standard
error of measurement above and below the student’s scale score.
An example of student scale score with the error band can be found in Appendix B of this document. For
more examples on measurement error, please refer to “Tests Results are Not Perfect Measures of Student
Performance” section on page 12.
Page 9 of 41Interim Assessments Interpretive Guide
Reporting Overall Performance on Interim Assessments
Interim Assessment Blocks
Based on their individual scale scores and the error band, student results for IABs are reported as one of
three reporting categories: Above Standard, Near Standard, or Below Standard. Each reporting category
represents a range of scale scores. A student score distribution by reporting category is also provided for
group-level reporting, providing educators with the proportion of students that performed within each
reporting category.
Reporting categories used for the IABs are different from achievement levels used to communicate overall
performance on the summative and ICA tests.
The IAB reporting categories that are used to classify students are calculated using the performance
standard, which is defined as the summative (and ICA) cut score between Levels 2 and 3, as the starting
point. The student’s performance on the IAB is evaluated against the grade and content Standard Met
performance standard. (e.g., a student’s scale score for the Grade 3 IAB, Numbers and Operations—
Fractions is compared to the Grade 3 mathematics summative assessment performance standard as the
starting point). Since the SEM represents the uncertainty around a student’s scale score, the SEM is
multiplied by 1.5 to create a confidence interval that likely includes the student’s true score. The confidence
interval is even larger than the student’s SEM, so it provides greater certainty, or confidence, in the
reporting category classification.
Figure 2 (below) contains a dot representing the scale score for each of the seven students being
evaluated on a Grade 4 Math IAB. The bars above and below the scale score are the confidence interval,
or 1.5 times the standard error of measurement on the test. The dark horizontal line is the performance
standard for the summative and ICA Grade 4 Math assessments—a scale score of 2485. If the confidence
interval for the student’s scale score on the IAB is completely above the performance standard, as in
Students 1, 5, and 6, the student’s reporting category is Above Standard. If the confidence interval for the
student’s scale score is completely below the performance standard, as in Students 4 and 7, the student’s
reporting category is Below Standard. If the confidence interval for the student’s scale score touches the
performance standard, as in Students 2 and 3, the student’s reporting category is Near Standard,
regardless of whether the reported scale score is above or below the performance standard. Please note:
The achievement level of some students in the Near Standard category will be either above or below the
performance standard, but not far enough above or below such that we can confidently label the
performance as Above Standard or Below Standard.
Page 10 of 41Interim Assessments Interpretive Guide
Figure 2. Comparison between Performance Standard and the IAB Scale Score and Confidence
Interval to determine IAB Reporting Category
2700
2600
Scale for Grade 4
2500
2400
2300
2200
2100
2000
0 1 2 3 4 5 6 7 8
Students
(*Smarter Balanced would like to acknowledge the Connecticut State Department of Education who designed Figures 1 and 2.)
Please note that IAB scale scores are derived using fewer items than the overall vertical scale scores on
the Summative and Interim Comprehensive Assessments; therefore, the standard error of measurement for
an IAB scale score will be greater than that of the overall vertical scale score.
Since the IAB reporting categories are derived in a different way from the summative and ICA achievement
levels, there is not a direct comparison between performance levels on the IABs and the ICA or summative
test. For full technical details on the calculations used, please refer to the Smarter Balanced Scoring
Specifications under Technical Documentation at
http://www.smarterbalanced.org/assessments/development/.
Interim Comprehensive Assessments
Based on their individual scale scores and the error band, student results for ICAs are reported in one of
four achievement levels, Level 4: Standard Exceeded; Level 3: Standard Met; Level 2: Standard Nearly
Met; Level 1: Standard Not Met. The same achievement levels are also reported for the summative
assessments. They were decided upon by a committee of member state representatives, teachers,
parents, and other stakeholders through a process called Achievement Level Setting. In this process,
threshold (or cut) scores are identified to differentiate the knowledge and skills expected at each level.
The tables below (Figure 3) show the range of scaled scores for each achievement level in the ICA and
summative assessments in mathematics and English Language Arts/Literacy.
Page 11 of 41Interim Assessments Interpretive Guide
Figure 3. Smarter Balanced Summative and ICA Scale Score Ranges by Content and Grade
Mathematics:
Grade Level 1 Level 2 Level 3 Level 4
3 2500
4 2548
5 2578
6 2609
7 2634
8 2652
11 2717
English Language Arts/Literacy
Grade Level 1 Level 2 Level 3 Level 4
3 2489
4 2532
5 2581
6 2617
7 2648
8 2667
11 2681
Claim Scores
The summative tests and ICAs also report claim scores. A claim is a summary statement about the
knowledge and skills students will be expected to demonstrate on the assessment related to an aspect of
the Common Core State Standards (CCSS). Claim scores are reported in one of three reporting categories:
Above Standard, Near Standard, or Below Standard. These reporting categories are determined using the
same calculation used to determine the IAB overall reporting categories. (See page 8 for additional
information.)
Guidelines for Appropriate Use of Test Results
Many variables influence test results and it is important that educators understand the following guidelines
when analyzing assessment results to inform educational decisions.
Tests Results are Not Perfect Measures of Student Performance
All tests include measurement error; no test is perfectly reliable. An error band is included with a student’s
test score as an indicator of its reliability. A statistical calculation is made by the system, determining how
much worse or better the student could be expected to do on the assessment if the student took the test
Page 12 of 41Interim Assessments Interpretive Guide
multiple times. Since performance could increase or decrease, the error band is represented on the report
by the entry after the scale score, with a “+” or “-” before it.
For example, as shown in Figure 4 below, a Grade 7 student takes the ELA Interim Comprehensive
Assessment and receives a score of 2552 with an error band of +/- 48 points. The error band indicates that
the student’s true score lies between 2504 (2552 minus 48) and 2600 (2252 plus 48). This means that if the
student took a test with a similar difficulty again without receiving further instructions, using either a different
sample of test questions, or taking the test on a different day, his or her score would likely fall within the
range given by the error band. The student’s scale score falls on the cut score between Nearly Met
Standard and Met Standard. With the error band, the student’s true score falls within both acheivement
levels.
Figure 4. Student’s Scale Score and Error Band
Measurement error in testing may result from several factors such as the sample of questions included on
the test, a student’s mental or emotional state during testing, or the conditions under which the student took
the test. For example, student factors, like whether the student was tired, hungry, or under stress,
classroom factors such as noise or temperature, or technical issues with the computer might all affect the
student’s test performance. In addition, any required human scoring for a test item may also influence the
test result due to factors associated with the accuracy of the human scorer.
REMEMBER:
IABs are fixed-form tests. Repeated exposure to the same test items may influence a student’s
score, therefore educators should be mindful about how often a student responds to the same
IAB.
MEASUREMENT ERROR IN TESTING IS EXPECTED AND UNAVOIDABLE.
USING A TEST RESULT IN CONJUNCTION WITH OTHER INDICATORS
ABOUT STUDENT PERFORMANCE IMPROVES THE ACCURACY OF
JUDGMENTS ABOUT WHAT STUDENTS KNOW AND CAN DO.
Use the Entire Assessment in Combination with Other Indicators
Items in an assessment form vary in format, content, target skill, and difficulty level. While it may be
possible to make some inferences about what students know and can do based on their performance on a
Page 13 of 41Interim Assessments Interpretive Guide
single test item, students’ performance on the entire IAB is a better indicator of students’ knowledge and
skills.
All test results include some degree of error. Therefore, it is critical to use results from a test in combination
with other information about student learning. This can encompass student work on classroom
assignments, quizzes, observation, and other forms of evidence.
Educators may use assessment results as one part of an “academic wellness check” for a student. The test
results, when analyzed alongside additional information about the student, can strengthen conclusions
about where the student is doing well and where the student might benefit from additional instruction and
support.
Validity of Results Depends on Appropriate Interpretation and Use
The Smarter Balanced Interim Assessments were designed to be used by educators to evaluate student
performance against grade-level standards. When used as designed, results from the Smarter Balanced
Interim Assessments can provide useful information to help educators improve teaching and learning for
their students. However, any inferences made from the test results may not be valid if the test is used for
purposes for which it was not designed and validated.
Manner of Administration Informs the Use of Results
Teachers may use the Smarter Balanced Interim Assessments in several ways to gain information about
what their students know and can do. When a test examiner begins a test session for the interim
assessment, the examiner must first determine if the test will be administered in a standardized or
nonstandardized manner of administration. The teacher selects the manner of administration when starting
a test session. Nonstandardized is the default setting if the teacher doesn’t select Standardized.
When combined with other forms of evidence, results from standardized administrations can be reasonably
used to gauge student knowledge and growth over time after a period of instruction because those results
represent individual student knowledge. Standardized administration of the IABs is much like an end-of-unit
test and can be used both as an assessment of learning and an assessment for learning.
Nonstandardized administration of the interim assessments is done primarily for learning. Results from a
nonstandardized administration should be used with caution when evaluating an individual student.
Individual student scores may be produced, but if a student is working with other students, the individual
student scores are not reflective of the individual student’s ability. However, nonstandardized
administrations may yield valid results for other purposes. The goal of a nonstandardized administration is
to learn where students are succeeding and where they might need more support during instruction.
MORE THAN ONE MEASURE OF STUDENT PROGRESS AND
PERFORMANCE SHOULD ALWAYS BE USED TO MAKE EDUCATIONAL
DECISIONS.
Page 14 of 41Interim Assessments Interpretive Guide
The IAB Dashboard: A Quick View of Overall
Group-level Results
The IAB Dashboard provides educators with a quick view of overall results for the IABs administered to a
group of students. A teacher can view the score distribution for each IAB to see the percentage of students
who performed in each reporting category (Above, Near, and Below Standard). The teacher can also see
which IABs were completed by all students in the group.
Figure 5. IAB Dashboard.
The teacher can see from the IAB Dashboard that not all 25 students in the class completed each IAB. The
score distributions for each IAB show overall group performance so the teacher can quickly see on which
IABs students did well and which they did not do well. By selecting an IAB, the teacher can see more
detailed information about student performance.
Page 15 of 41Interim Assessments Interpretive Guide
Example of Classroom Use of an IAB: End-of-
Unit Assessment
In this section, we provide an example of how an educator might use one of the IABs to improve teaching
and learning in her classroom. Included in this example are screenshots from the Smarter Balanced
Reporting System that illustrate the different views available to educators to analyze the data and interpret
it within their local context. Results will be analyzed at the group level, individual student level, and item
level. At each level, highlights of appropriate use and cautions will be provided.
SAMPLE SCENARIO
Ms. Garcia is a third-grade teacher who administers the grade three ELA IAB Read Information
Text as one measure of how well her students can read closely and analytically to
comprehend a range of increasingly complex informational texts.
Group-Level Analysis
As shown in Figure 6 below, Ms. Garcia’s classes had an average scale score on the Grade 3 ELA – Read
Information Texts IAB of 2380. She can also see the error band of +/- 29 points or error of the mean. This
means that if a test of parallel design were given to these students on another day without further
instruction, their average scale score would likely fall between 2351 (2380 minus 29 points) and 2409 (2380
plus 29 points).
Figure 6. Group-Level View of IAB Results
Page 16 of 41Interim Assessments Interpretive Guide
Ms. Garcia can see from the Student Score Distribution section that 5% of her students scored within the
Above Standard reporting category. The distribution of scores also highlighted that 65% of the students
scored within the Near Standard reporting category, and 30% scored within the Below Standard category.
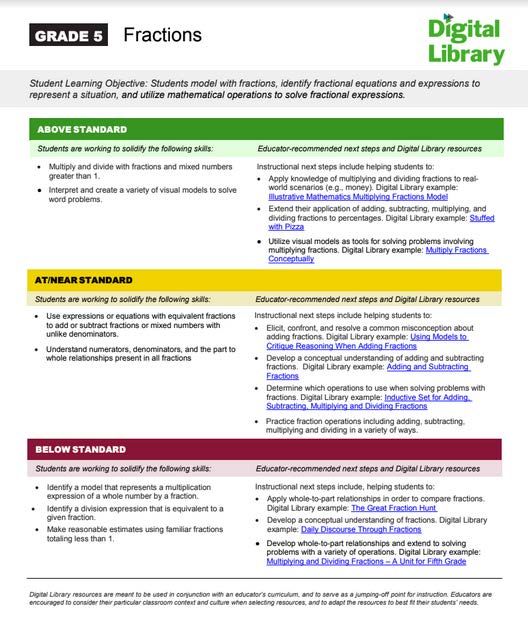
From the group results page, Ms. Garcia can access links to instructional resources. Each IAB has an
associated Digital Library Connections Playlist. Connections Playlists are time-saving tools that were
developed by teachers for teachers. Each playlist provides resources that were selected and organized
based on the reporting categories for an IAB. More information about Connections playlists is available on
the Digital Library page of the Smarter Balanced website. In addition to the Smarter Balanced Connections
Playlists, districts and schools may include links within the Reporting System to local district or school
resources.
There are several ways that Ms. Garcia can access these resources. By selecting the “Instructional
Resources” button, Ms. Garcia can access resources for all reporting categories. To view resources that
would be useful for students at particular reporting categories, she can select the book icons located on the
student score distribution and student rosters. Through any of these links, Ms. Garcia can find resources to:
• provide students who scored above standard with instruction designed to enrich and expand their
skills; and
• provide differentiated instruction based on student needs.
See page 29 for additional information about the Digital Library.
Group Item-Level Analysis
For each item in the IAB, Ms. Garcia can see the claim, target, item difficulty, the relevant standard
assessed, and the proportion of students who received full credit, as well as the proportion of students at
each score point.
For example, as shown in Figure 7, item #5 is listed as Difficult. Ms. Garcia sees that about 40% of her
students received full credit on Item #5. Continuing in the same row, she can also see that 60% of her
students did not receive any points on Item #5 and 40% received the maximum of one point. This
information indicates a need for additional support.
Figure 7. Item-Level View of IAB Results: Group Scores
Page 17 of 41Interim Assessments Interpretive Guide
Ms. Garcia can also sort on the Full Credit column to quickly identify test items that students performed well
on and items where students struggled.
Student-Level Analysis
To inform her teaching to help students comprehend a range of increasingly complex informational texts
and provide better instructional support to her students, Ms. Garcia can use individual student performance
results by looking at the “Results by Student” screen (Figure 8). The “Reporting Category” column is
sortable so that Ms. Garcia can easily identify the students who performed within each reporting category.
Using the test results for students in the Above Standard reporting category, combined with her knowledge
of student performance on classroom assignments, homework, and other observations, Ms. Garcia makes
inferences about her students’ ability to read and comprehend informational text. She is confident that
students who scored in the Above Standard category have mastered the skills and knowledge taught in the
classroom and are in no need of additional support on that content.
Because she feels confident in the abilities of about half of her students, Ms. Garcia chooses to focus her
attention on the students who scored in the Below Standard category, suspecting that there might be need
for additional instruction for that group. Ms. Garcia remembers that the information from the IAB is only one
measure and it should always be used in combination with other information about her students. However,
the information from the IAB can assist her in adjusting instruction to the specific needs of her students,
thereby improving teaching and learning in the classroom. For example, Ms. Garcia could use the reporting
categories to determine the specific needs of her students and tailor the instruction and processes of
collaborative learning groups to meet those needs.
Figure 8. Student-Level View of IAB Results
As shown in Figure 8, Ms. Garcia can select an individual student from the group list (by selecting the blue
box with the student’s name) to examine the student’s performance on items within the IAB. When an
individual student is selected, Ms. Garcia can select the option to view the student’s responses and a
screen showing each item in the IAB is displayed (see Figure 9).
Page 18 of 41Interim Assessments Interpretive Guide
Figure 9. Individual Student Item-Level View of IAB Information
Ms. Garcia selects item number 1 and the following three tabs appear Item Viewer, Rubric and Exemplar,
and Item Information (Figure 10).
Figure 10. Item-Level Tabs
By examining student responses in the Item Viewer tab, Ms. Garcia can identify patterns in student
responses that might reveal common misconceptions or misunderstandings. If several students chose the
same incorrect response, for example, Ms. Garcia can isolate areas to revisit with her class.
Page 19 of 41Interim Assessments Interpretive Guide
The Rubric and Exemplar tab (Figure 11) shows the exemplar (i.e., correct response), any other possible
correct responses to the item, and a rubric that defines the point values associated with specific responses.
For multiple-choice questions, the key or correct response is provided.
Figure 11. Rubric and Exemplar Tab
The Item Information tab (Figure 12) describes the claim, assessment target, domain, and standard that the
item assesses. This tab also provides the Depth of Knowledge, the item difficulty, and links to other
supporting documentation.
Figure 12. Item Information Tab
Claims, Targets, Domain, and Standards
Claims and targets are a way of classifying test content. The claim is the major topic area. For example, in
English language arts, reading is a claim. Within each claim, there are targets that describe the knowledge
and skills that the test measures. Each target may encompass one or more standards from the CCSS.
Within the Reading claim, for example, one of the targets is concerned with finding the central idea in a
Page 20 of 41Interim Assessments Interpretive Guide
text. Domains are large groups of related standards in the Mathematics CCSS (e.g., Geometry, Statistics
and Probability, Ratios and Proportional Relationships). More information about the claims, targets, and
standards can be found in the Content Specifications, and Item and Task Specifications at
http://www.smarterbalanced.org/assessments/development/.
Depth of Knowledge
Depth of Knowledge (DOK) levels, developed by Webb (1997), reflect the complexity of the cognitive
process demanded by curricular activities and assessment tasks (Table 2). Higher DOK levels are
associated with activities and tasks that have high cognitive demands. The DOK level describes the kind of
thinking a task requires, not if the task is difficult in and of itself.
Table 2. Depth of Knowledge Levels
DOK Level Title of Level
1 Recall
2 Skills and Concepts
3 Strategic Thinking
4 Extended Thinking
Item Difficulty
Each Smarter Balanced test item is assigned a difficulty level based on the proportion of students in the
field-test sample who responded to that item correctly. The students who responded to the item are
referred to as the reference population. The reference population determines the difficulty level of a test
item. (Note: The reference population for an item consists of all the students who took the test the year the
item was field-tested. Depending on when the item was field tested, the reference population may refer to
students who took the spring 2014 Field Test or a subsequent summative assessment that included
embedded field-tested items.”)
Test items are classified as easy, moderate, or difficult based on the average proportion of correct
responses of the reference population, also referred to as the average proportion-correct score (Table 3).
The average proportion-correct score can range from 0.00 (no correct answers meaning the item is difficult)
to 1.00 (all correct answers meaning the item is easy).
Table 3. Item Difficulty Categories
Range of Average
Difficulty Proportion Correct (p- For items worth more than 1 point, the average
value) Score proportion correct score is the item’s average
Category
score among students in the reference
Minimum Maximum population divided by the maximum possible
score on the item. For example, if the average
Easy 0.67 1.00
score for a 2-point item is 1, its average
Moderate 0.34 0.66 proportion correct score is 1 divided by 2, or
0.50. In this example, that test item would be
Difficult 0.00 0.33 rated as moderate on the item difficulty scale.
Page 21 of 41Interim Assessments Interpretive Guide
Easy items are answered correctly by at least 67% of the students in the reference population.
Moderate items are answered correctly by 34-66% of the reference population.
Difficult items are answered correctly by 33% or fewer of the reference population.
As previously shown in Figure 12, item #1 is aligned to Standard 3.RL.5 (Use text features and search tools
(e.g., key words, sidebars, hyperlinks) to locate information relevant to a given topic efficiently) and
assesses Reading claim, Target 13 (TEXT STRUCTURES/ FEATURES: Relate knowledge of text
structures or text features (e.g., graphics, bold text, headings) to obtain, interpret, or explain information).
This information tells Ms. Garcia what concepts and skills the item assesses.
Ms. Garcia can also see from this tab that Item #1 is classified as difficult. Ms. Garcia can include item
difficulty in her inferences about student performance because item classification provides her with
additional context when reviewing test results and considering instructional implications.
Student scores on more difficult items should be treated differently from the scores on less difficult items.
For example, if half of the students get an item wrong, Ms. Garcia should avoid making generalized
inferences about student needs. Instead, Ms. Garcia can account for the item difficulty when drawing
conclusions from test results to determine what students know and can do. If the item is rated difficult, Ms.
Garcia’s conclusions about her students may differ from conclusions based on an item rated easy. If half of
the students answer an easy item incorrectly, she may decide to re-teach the concepts addressed in that
item. On the other hand, if half of her students got a difficult item incorrect, she may choose to address that
result by encouraging additional practice on this type of item.
Key and Distractor Analysis
For selected response items, Ms. Garcia can analyze whether a large group of students selected a
particular incorrect response, which may signal a common misconception about a topic or skill. To do this,
Ms. Garcia selects the Key/Distractor Analysis from the results view drop-down menu (Figure 13).
Page 22 of 41Interim Assessments Interpretive Guide
Figure 13. Select to View Key/Distractor Analysis
The Key and Distractor Analysis view (Figure 14) displays information for multiple-choice and multi-select
items. Ms. Garcia can see the claim, target, item difficulty, and related standard(s) for each item. In
addition, she can see the percentage of students who earned full credit for each item and the percentage of
students who selected each answer option. (For multi-select items, these percentages will not add up to
100 percent since students may select more than one option.) Ms. Garcia can sort the list by the
percentage of students who earned full credit to see those items on which students had the greatest
difficulty and then determine whether there were incorrect answers that many students selected. (The
correct answers are highlighted.)
Page 23 of 41Interim Assessments Interpretive Guide
Figure 14. Key and Distractor Analysis View
Ms. Garcia identifies Item 18 as one on which several students selected the same incorrect answer, A. To
learn more about this item, Ms. Garcia can select the item number and see four tabs as shown in Figure
15: Student Scores and Responses, Item Viewer, Rubric and Exemplar, and Item information. From the
Student Scores and Responses tab, Ms. Garcia can sort on the Response column to see which students
incorrectly selected C. By selecting the Item Viewer, Ms. Garcia can see all the response options and,
using other information she has about her students based on classroom discussion and assignments, begin
to form hypotheses about why her students may have incorrectly chosen the incorrect response option.
Page 24 of 41Interim Assessments Interpretive Guide
Figure 15. Key and Distractor Analysis Item Details Tabs
Writing Trait Score Report
Ms. Garcia also administered the ELA Performance Task IAB that includes a full write or essay question.
This report is available for ELA Performance Task IABs and ELA Interim Comprehensive Assessments
(ICA). It allows teachers to analyze the strengths and weaknesses of student writing (Figure 16) based on
student performance on the essay question.
Figure 16. Group Report on the Essay Question
Page 25 of 41Interim Assessments Interpretive Guide
This report provides the information found on other group summary reports (average scale score and error
band, student score distribution and item information). In addition, it indicates the writing purpose of the
essay question. The purpose may be argumentative, explanatory, informational, narrative, or opinion
depending on the grade level of the assessment.
The report provides the average points earned by Ms. Garcia’s students and maximum number of points for
each writing trait. The three writing traits describe the following proficiencies in the writing process.
• Purpose/Organization: Organizing ideas consistent with purpose and audience
• Evidence/Elaboration: Providing supporting evidence, details, and elaboration consistent
with focus/thesis/claim, source text or texts, purpose and audience
• Conventions: Applying the conventions of standard written English; editing for grammar usage
and mechanics to clarify the message
There is a maximum of four points for organization/purpose, four points for evidence/elaboration, and two
points maximum for conventions.
The report also displays the Transformed Points value that is calculated by adding the Conventions score
to the average of the Organization/Purpose and Evidence/Elaboration scores. These two values represent
two dimensions that are used to compute the student’s overall scale score and the Claim 2 – Writing
reporting category for the ELA ICA.
A student’s score is computed as follows:
Organization/purpose: 4 points earned Average = (4+1)/2 = 2.5, which is rounded up to 3 points
Evidence/elaboration: 1 points earned
Conventions: 2 points earned
3 + 2 = 5 Transformed Points
The report also provides the percentage distribution of students by the number of points they earned for
each writing trait and the percentage of students who earned each possible number of Transformed Points.
Hand scoring training guides are available in the Interim Assessment Hand Scoring System. The guides
include the rubrics and annotated scored student responses that are used to determine student scores.
The Performance Task Writing Rubrics are also available in the links below:
• Argumentative (PDF)
• Explanatory (PDF)
• Informational (PDF)
• Narrative (PDF)
• Opinion (PDF)
Ms. Garcia can view the writing trait scores for individual students by selecting the blue box for item 4
(Figure 16). This displays a report on individual student performance by writing trait and Transformed
Points earned (Figure 17). Ms. Garcia can sort by Transformed Points to quickly identify students who
Page 26 of 41You can also read