Optimizing Chemically Enhanced Primary Treatment Processes for Simultaneous Carbon Redirection and Phosphorus Removal - MDPI
←
→
Page content transcription
If your browser does not render page correctly, please read the page content below
water
Article
Optimizing Chemically Enhanced Primary Treatment
Processes for Simultaneous Carbon Redirection and
Phosphorus Removal
Tianchen Dong 1 , Wudneh Ayele Shewa 1 , Kyle Murray 2 and Martha Dagnew 1, *
 1   Department of Civil and Environmental Engineering, Western University, 1151 Richmond Street, London,
     ON N6A 3K7, Canada; tdong8@uwo.ca (T.D.); wshewa@uwo.ca (W.A.S.)
 2   City of London, 300 Dufferin Avenue, London, ON N6B 1Z2, Canada; kjmurray@london.ca
 *   Correspondence: mdagnew@uwo.ca; Tel.: +1-519-661-2111 (ext. 87427)

 Received: 25 February 2019; Accepted: 13 March 2019; Published: 16 March 2019

 Abstract: There has been increased interest towards maximizing wastewater energy recovery by
 enhancing the carbon captured through the primary treatment process such as chemically enhanced
 primary treatment (CEPT). This research was conducted to optimize the CEPT performance in terms
 of redirection of carbon and nutrients in both bench- and full-scale operations. In order to improve
 the CEPT process, the performance of ferric chloride and seven types of polymers were evaluated
 through jar testing. The optimal coagulant (15 mg/L ferric chloride) and flocculant (0.5 mg/L poly
 aluminum chloride (PACl)) combination achieved total COD, soluble COD, total suspended solids
 (TSS), and total phosphorus (TP) removal efficiencies of 76, 58, 89, and 84, respectively, in a full-scale
 primary clarifier operation. In doing so the organic matter and phosphorus were concentrated in
 CEPT sludge, making them available for recovery. Furthermore, the relationship between influent
 characteristics and removal rates under varying operating conditions was investigated. It was found
 that soluble COD removal appeared to be season-dependent, and TSS removals were independent
 of influent TSS concentrations in all scenarios. The removal of tCOD, sCOD, and TP had a positive
 relationship with their corresponding concentrations when the polymer Alcomer® 120L was used,
 whereas no correlation between removal and concentration was observed with PACl.

 Keywords: chemically enhanced primary treatment; carbon redirection; polymer; municipal
 wastewater; optimization; phosphorus removal

1. Introduction
     One of the most prominent and practical topics, concerning all facets of the wastewater industry,
is the necessity for low-energy and sustainable technologies. Recent developments in wastewater
treatment have also heightened the need for carbon redirection from primary treatment units to
transfer more carbon to anaerobic digestion or incinerators for maximizing energy recovery and
generation. One of the existing technologies being considered for carbon redirection is chemically
enhanced primary treatment (CEPT) [1]. CEPT refers to the process whereby chemicals are added
to primary influent to promote coagulation and/or flocculation in primary clarifiers, resulting in
improved removals via precipitation of particulate/dissolved solids as well as the carbon and
nutrients associated with those solids [2]. Historically, metal salts, such as ferric chloride and alum,
were considered as coagulants to be added to primary influent to enhance the removal of phosphorus.
CEPT with metal salts have been shown to improve phosphate removal rates from 75 to 95% [3].
Wang et al. [4] also showed that dosing alum can effectively remove 78% of phosphate through primary
treatment. Therefore, the addition of metal salts has been demonstrated to have a significant impact on

Water 2019, 11, 547; doi:10.3390/w11030547                                       www.mdpi.com/journal/water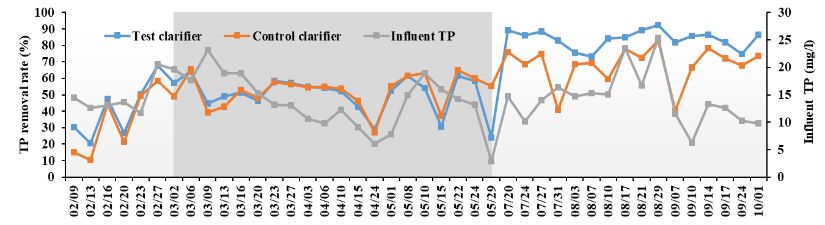
Water 2019, 11, 547                                                                               2 of 14

phosphorus removal performance for primary clarification when compared to a conventional clarifier,
which typically only achieves removals of approximately 30%. Further, the chemical addition causes
the particulate matter to form larger flocs, increasing the settling rate and thus reducing the required
residence time for primary treatment, which translates into the ability to treat higher wastewater flows
in wet weather or overflow conditions without compromising primary treatment performance [4].
Odegaard [5] conducted research on the impact of polymer to supplement metal salt addition for a
CEPT process. This research showed a promising increase in the floc settling rate allowing similar
performance at higher surface overflow rates than when the metal salts were used alone. The results
of bench-scale testing show that the total suspended solids (TSS) removal rate can be increased to
around 90% by adding coagulant and flocculants [6–8]. Furthermore, the results of a survey of 100
wastewater treatment plants in the United States suggest that, based on a comparison of full-scale CEPT
applications to conventional primary clarification under similar operating conditions, CEPT results in
a 30% increase in TSS removed through primary treatment [9].
     Currently, many wastewater treatment plants are being upgraded for the purpose of resource
recovery. As part of this process, both wastewater engineering practitioners and researchers are
considering the role that the CEPT process can play. Compared with conventional primary treatment,
CEPT shows superior efficiencies in removing suspended solids and phosphorus [10]. As organic
carbon is a potential energy-rich component of wastewater, a key consideration for sustainable,
energy self-sufficient wastewater treatment is the removal and management of the carbon in the
influent wastewater. Therefore, the removal rate of total chemical oxygen demand (tCOD) and soluble
chemical oxygen demand (sCOD) will be a more important parameter in the design and operation of
CEPT. Furthermore, although there are some recent studies that discuss the potential of using CEPT
in carbon redirection, there is a notable lack of research being undertaken that focuses on optimizing
CEPT for simultaneous carbon and nutrient redirection by removing more tCOD, sCOD, and total
phosphorus (TP).
     If a large amount of carbon can be redirected by CEPT compared to traditional primary treatment,
a larger portion of pollutants are concurrently removed via CEPT sludge rather than requiring
removal through downstream biological or chemical treatment processes. Additionally, the pollutants
concentrated in CEPT sludge, such as organic carbon, can be regarded as valuable resources to
increase anaerobic digester gas production or promote autogenous combustion in sludge incineration.
The other advantages of CEPT include a reduction of the footprint of primary settling processes, as it
permits operation at high surface overflow rates, while also reducing the footprint and operating
cost of subsequent biological treatment processes due to the decreased organic and nitrogen loadings
contained in primary effluent. Despite these advantages, previous studies concerning CEPT have
only focused on the selection of coagulants and flocculants for wet weather flow conditions and
phosphorus removal [2,11,12]. Studies that holistically address the potential for optimization of CEPT
technology for simultaneous carbon redirection, wet weather flow, and phosphorus removal are
limited. Thus, the objectives of this study are to (1) investigate the effectiveness of several polymers
with ranging characteristics on simultaneous carbon and nutrient removal using jar testing, (2) monitor
and characterize full-scale long-term CEPT performance under optimal and suboptimal polymer
dosing operations, and (3) evaluate the influence of influent characteristics on removal rates under
varying operating conditions.

2. Materials and Methods
     This study was conducted using bench-scale units to address the above objectives prior to
evaluation at full-scale. The bench-scale study was conducted systematically to identify the best
coagulant/polymer combination for achieving simultaneous carbon redirection and P removal.
The study evaluated the effectiveness of seven different types of polymers in combination with ferric
chloride by assessing the removals of tCOD, sCOD, TP, and TSS. After the optimal combination was
identified, it was further implemented on a full-scale primary clarifier in a side-by-side comparative
Water 2019, 11, 547 3 of 14
evaluation using a similar full-scale conventional clarifier as a control. The primary influent and effluent
from both full-scale clarifiers were characterized, and the long-term performance of each clarifier,
as well as 2019,
Water the impact of the
11, x FOR PEER primary influent characteristics on their performance, was evaluated.
REVIEW 3 of 14
clarifier, as
2.1. Full-Scale well
Site as the
Layout impact
and of the primary influent characteristics on their performance, was
Sampling
evaluated.
Full-scale tests were conducted at the Vauxhall Pollution Control Plant (PCP) (London, ON,
Canada). The plantSite
2.1. Full-Scale hasLayout
two sections, designated as Sections 1 and 2, treating two-thirds and one-third
and Sampling
of the total flow, respectively (Figure 1). According to the 2016 annual report, the average daily flow
of the Vauxhall PCP is 13,500 m3 /day [13]. The plant makes use of ferric chloride for phosphorus
removal and occasionally uses Alcomer® 120L polymer (hereafter called Alcomer) to enhance the
plant’s performance during wet weather flow conditions. The CEPT optimization experiment was
conducted on the section designated as Section 2, and Section 1 was monitored as a control clarifier
(Figure 1). During the test period, the flow going to each section was manipulated to maintain
similar surface overflow rate and detention time between the test and the control clarifiers (Table 1).
Ferric chloride addition for phosphorus removal was resumed for Section 1 influent (herein referred
to as the control clarifier), while a selected polymer in combination with ferric chloride was added
to the Section 2 influent (herein referred as the test clarifier) for simultaneous carbon redirection and
phosphorus removal. The influent and effluent of the primary clarifiers of both sections (Sections 1
and 2) were collected twice per week for wastewater quality analysis, which included tCOD, sCOD,
total phosphorus (TP), and total suspended solids (TSS). The operating parameters and characteristics
of the raw wastewater are shown in Table 1.
Figure
Figure 1. 1.Layout
Layoutofofthe
theVauxhall
Vauxhall Pollution
Pollution Control
ControlPlant (PCP).
Plant (PCP).Water 2019, 11, 547 4 of 14
Table 1. Clarifier operating parameters and wastewater characteristics.
Operating Parameters Control Clarifier Test Clarifier
Flow (MLD) 9 4.5
Detention time (h) 1.7 1.8
Surface overflow rate
32 30
(m3 /m2 /day)
TSS, mg/L 354 *
BOD, mg/L 228 *
TP, mg/L 6.3 *
* 24-h composite samples, average year.
2.2. Bench-Scale Jar Testing and Polymer Selection
The jar test experiments were performed using Phipps and Bird PB-900 six-paddle flocculation
stirrer and the contents of the jars were mixed simultaneously. One liter of raw wastewater was placed
into each of the jars and a fixed dosage of ferric chloride (15 mg/L) was added to each jar. The ferric
chloride dosing rate was adopted from the plant and was consistent with the optimal rate being
applied at the full-scale plant for TP removal. After the addition of ferric chloride, the wastewater was
briefly stirred at 100 rpm for 1 min, and increasing dosages of polymer solution (0.25–2 mg/L) were
added to each jar as quickly as possible in succession, and then slowly stirred at 20 rpm for another
2 min. The wastewater mixture was then allowed to settle for 30 min, and a sample of supernatant
was then withdrawn for analysis.
As part of the jar testing methodology, special emphasis was placed on the method of coagulant
and flocculant addition to mimic the dosing conditions typically found at full-scale wastewater
treatment facilities [14,15]. In actual wastewater treatment plants, standard design practice is to inject
coagulant at a location where there is a high degree of turbulence in order to stimulate the process
of coagulation. Because of the negative impact of rapid mixing on the flocculation process, causing
a break-up of already formed flocs, flocculants are typically added in a more quiescent location.
Concomitant to this, the coagulant was added during rapid mixing followed by flocculant addition
during slow mixing.
A total of 126 tests were performed using seven different polymers, each applied at concentrations
of 0.25, 0.5, 0.75, 1, 1.5, and 2 mg/L and conducted in triplicate. Prior to the test, stock solutions of
ferric chloride and the seven different polymers were prepared and stored at 21 ◦ C in sealed plastic
bottles. Table 2 provides a summary of the polymers used for this study. The polymers were selected
based on their wide range of characteristics and their potential impact on carbon redirection.
Table 2. Comparison of different polymers.
Polymer Name Type Composition
Polyacrylamide Nonionic (C3 H5 NO)n
Polyacrylamide Anionic (C3 H5 NO)n
Polyacrylamide Cationic (C3 H5 NO)n
Poly aluminum chloride - (Al2 (OH)3 Cl3 )n
BASF 8848FS (B1) Cationic Unknown, proprietary
BASF 8858FS (B2) Cationic Unknown, proprietary
Alcomer Anionic Anionic, acrylamide-based copolymer
2.3. Wet Chemistry and Statistical Analysis
The wet chemistry analysis including total and soluble COD and TP was performed according to
HACH methods 8000 and 10127, respectively (HACH, Loveland, CO, USA). TSS values were measured
as per the standard methods [16]. All analyses of field samples were carried out within 24 h after
their collection to minimize any changes in wastewater characteristics. Samples collected during jar
testing were analyzed immediately after collection. The assessment of normality of the data and meanWater 2019, 11, 547 5 of 14
comparison was made using the Anderson–Darling Test and t-test, respectively [17]. MINITAB 18
(www.minitab.com, Minitab Inc., State College, PA, USA), a statistical software program, was used to
determine the skewness, kurtosis, Anderson–Darling p-values, and t critical values.
3. Results and Discussion
3.1. An Evaluation of Polymer Type on Simultaneous Carbon Redirection and TP Removal
The carbon and nutrients removal efficiencies of the seven polymers described in Table 2 were
investigated for the purpose of selecting an optimal polymer type and its corresponding dosage.
The evaluation was conducted using jar testing with a fixed coagulant (ferric chloride) dose of 15 mg/L
and varying doses of polymers. The details of the comparison are described in the subsequent sections.
Figure 2a–d illustrate the performance of different types and concentrations of polymers in terms
of tCOD, sCOD, TSS, and TP removals. Overall, the tCOD removal ranged from 22 ± 2 to 94 ± 2%
(Figure 2a). The results indicated an optimal polymer dose ofWater 2019, 11, 547 6 of 14
Wa ter 2019, 11, x FOR PEER REVIEW 6 of 14
(a) (b)
(c)
(d)
Figure2.
Figure Percent
2.Pe removal
rce nt re movalbybyindividual
individual polymers
polyme rswith
with15
15 mg/L ferric
mg/L fe rric chloride
chloride (values
(value sare
areaverages of
ave rages
triplicates): (a) tCOD, (b) sCOD, (c) TP, and (d) TSS.
of triplicate s): (a) tCOD, (b) sCOD, (c) TP, and (d) TSS.
Figure 2c shows the TP removal achieved though the dosing of ferric chloride (15 mg/L) coupled
Figure 2c shows the TP removal achieved though the dosing of ferric chloride (15 mg/L) coupled
with various polymers. The cationic polymer, B2, was found to be the best polymer to be used with
with various polymers. The cationic polymer, B2, was found to be the best polymer to be used with
ferric chloride for removing TP based on an observed removal rate of 95 ± 1.1% at a polymer dosage
ferric chloride for removing TP based on an observed removal rate of 95 ± 1.1% at a polymer dosage
of 0.75 mg/L. The TP removal efficiency of other cationic, anionic, or nonionic polymers is in the range
of 0.75 mg/L. The TP removal efficiency of other cationic, anionic, or nonionic polymers is in the range
from 50 ± 2.4 to 70 ± 2.5%, with the exception of PACl, which removed 80 ± 4.9% of TP. These results
from 50 ± 2.4 to 70 ± 2.5%, with the exception of PACl, which removed 80 ± 4.9% of TP. These results
demonstrate that the charge of polymer is not the decisive factor. This can be concluded on the
demonstrate that the charge of polymer is not the decisive factor. This can be concluded on the basis
basis of equal removal rates from both anionic PAM (70.2 ± 2.1%) and cationic PAM (70.2 ± 5.4%).
of equal removal rates from both anionic PAM (70.2 ± 2.1%) and cationic PAM (70.2 ± 5.4%). Most of
Most of the TP is removed by ferric and polymer ion co-precipitation [21,22]. However, B2 (cationic
the TP is removed by ferric and polymer ion co-precipitation [21,22]. However, B2 (cationic
polyelectrolyte) displayed a much better performance for removing TP, which demonstrates that the
polyelectrolyte) displayed a much better performance for removing TP, which demonstrates that the
liquid grade cationic polyelectrolyte used is superior for TP removal to all varieties of PAM tested.
liquid grade cationic polyelectrolyte used is superior for TP removal to all varieties of PAM tested.
Further research regarding the impact of the characteristics of B2, such as its molecular weight, charge
Further research regarding the impact of the characteristics of B2, such as its molecular weight, charge
density, and viscosity on its bridging and patch charge neutralization capability, need to be done to
density, and viscosity on its bridging and patch charge neutralization capability , need to be done to
establish this argument.
establish this argument.
Figure 2d graphically illustrates the observed TSS removals associated with various polymers
Figure 2d graphically illustrates the observed TSS removals associated with various polymers
added as coagulant aid. Typically, the capability of polymers to remove TSS is an indicator of their
added as coagulant aid. Typically, the capability of polymers to remove TSS is an indicator of their
potential use for wet weather flow conditions. Interestingly, almost all combinations of ferric chloride
potential use for wet weather flow conditions. Interestingly, almost all combinations of ferric chloride
and the various types and concentrations of polymers tested achieved removals that exceeded 70%.
and the various types and concentrations of polymers tested achieved removals that exceeded 70%.
This is in contrast to the results of tCOD, sCOD, and TP removal efficiencies. Three of the polymers,
This is in contrast to the results of tCOD, sCOD, and TP removal efficiencies. Three of the polymers,
PACl, B1, and B2, had higher (>90%) and comparable TSS removal rates (Figure 2d). However,
PACl, B1, and B2, had higher (>90%) and comparable TSS removal rates (Figure 2d). However, the
the dosage needed to achieve these removals with PACl (0.5 mg/L) was found to be lower than the
dosage needed to achieve these removals with PACl (0.5 mg/L) was found to be lower than the other
two polymers (0.75 mg/L) (Figure 2d). Therefore, PACl was considered the best polymer from aWater 2019, 11, 547 7 of 14
other two polymers (0.75 mg/L) (Figure 2d). Therefore, PACl was considered the best polymer from a
performance and cost standpoint for the removal of TSS. The ability of PACl to achieve a high level of
removal despite a lower dosage, compared to other polymers, may be explained by its polymeric form
and higher molecular weight providing both charge neutralization and bridging ability. Molecular
weight and intrinsic viscosity are the most important factors in the coagulation and flocculation process,
owing to the size and bridging ability of the molecules for aggregation [23]. In addition, the ratio of
the Al3+ and the positive charge are elevated, which effectively brings about its excellent capabilities
of bridging and aggregating for flocculation [24].
3.2. Selection of the Best Performing Polymer
The summary of the results obtained from the jar test analysis is shown in Table 3. It is apparent
from this table that selecting the best performing polymer is not straightforward because no single
polymer provides the best observed removal efficiency for each of the parameters considered. Thus,
a simplified comparison matrix introduced by Feo et al. [15] was used. In this process, an equal
weight of 2 was assigned to COD, TSS, TP, and dosage, and the corresponding index for each polymer
and its impact on each parameter was determined. Averages of the four weighted values were then
compared (Table 4), and the polymer with the highest index was selected as the optimal polymer.
The results, as shown in Table 4, indicate that PACl (average index = 1.916) is the best polymer.
Therefore, using 0.5 mg/L PACl combined with 15 mg/L of ferric chloride can achieve removals as
high as 94% of tCOD, 29% of sCOD, 79% of TP, and 96% of TSS through CEPT. Although the sCOD
removal efficiency of PACl is not the highest compared to the nonionic PAM (Figure 3), it exhibits an
outstanding performance in removing tCOD, TP, and TSS. In addition to better performance, the cost
of PACl (200–350 USD/ton) was much lower than PAM (1000–1800 USD/ton), making it the most
economic polymer.
Table 3. Comparison of different polymers.
Removal Efficiency (%)
Polymer Type Optimum Dosage (mg/L)
tCOD sCOD TP TSS
Nonionic PAM 0.5 71 66 68 86
Anionic PAM 1 67 15 70 83
Cationic PAM 0.75 74 21 70 84
PACL 0.5 94 29 78 96
B1 0.75 68 26 67 96
B2 0.75 26 2 95 96
Alcomer 1 43 10 55 78
Min = 0.5 Max = 94 Max = 66 Max = 95 Max = 96
Table 4. Alternative matrix of polymers using equilibrate weight distribution.
Criteria 1
Polymer Type tCOD Removal TP Removal TSS Removal Dosage Average Index 4
Index 2 Index 2 Index 2 Index 3
PACl 2.000 1.662 2.000 2.000 1.916
Nonionic PAM 1.512 1.445 1.794 2.000 1.688
B1 1.446 1.426 1.992 1.333 1.549
Cationic PAM 1.578 1.483 1.746 1.333 1.535
B2 0.560 2.000 1.996 1.333 1.472
Anionic PAM 1.438 1.483 1.735 1.000 1.414
Alcomer 0.922 1.170 1.629 1.000 1.180
1 Each criterion is attributed an equal weight of 2; 2 Index = 2 x Removal (%)/observed maximum removal (%);
3 Index = 2 x Observed minimum dosage/optimum dosage; 4 Average index is the average of the 4 weighted values
for each alternative.Water 2019, 11, 547 8 of 14
Wa ter 2019, 11, x FOR PEER REVIEW 9 of 14
(a)
(b)
(c)
(d)
month/day
Figure Figure 3. Re moval
3. Removal e fficieprofile:
efficiency ncy profile : (a) TSS,
(a) TSS, (b) tCOD,
(b) tCOD, (c) (c) sCOD,
sCOD, andand
(d)(d)TP
TPremoval.
re moval.
Wa ter 2019, 11, x; doi: FOR PEER REVIEW www.mdpi.c om/journal/waterWater 2019, 11, 547 9 of 14
3.3. Full-Scale Carbon Redirection, TP Removal and Wet Weather Flow Performance
Full-scale carbon redirection, TP removal, and wet weather flow performance characterization
were conducted at the Vauxhall PCP using both a test and control clarifier. During the study period,
these clarifiers operated at a surface overflow rate of 30 and 32 m3 /m2 /day, respectively. Prior to
this experiment, the plant had been dosing 15 mg/L ferric chloride for phosphorus removal and had
used Alcomer on an as-needed basis to enhance the plant’s performance during wet weather flows.
The full-scale test was conducted in three phases: (1) Phase 1: in addition to ferric chloride, Alcomer at
1 mg/L was added on a continuous basis to assess the effectiveness of the plant’s existing wet weather
flow for carbon redirection and TP removal; (2) Phase 2: the test and control clarifiers subjected to
only ferric chloride dosing were compared; (3) Phase 3: test clarifier, which received a dose of ferric
chloride followed by an optimized polymer (PACl), was compared with the control clarifier receiving
only ferric chloride.
The TSS, tCOD, sCOD, and TP removal efficiency for both the test and control full scale primary
clarifiers during Phase 1 are depicted in Figure 3a–d. The average TSS, tCOD, sCOD, and TP removal
efficiencies for the control were 68 ± 12, 40 ± 20, 20 ± 14, and 33 ± 20% and for the test clarifier
with polymer addition were 84 ± 9, 47 ± 16, 21 ± 13, and 41 ± 18%, respectively. For most of the
parameters, the test clarifier demonstrated marginal improvement except for TSS, where a substantial
(16%) improvement in removal was demonstrated. This confirms that the usage of Alcomer polymer
during wet weather flow conditions could be used to enhance removals. However, it should be noted
that the enhancement in TP removal was not comparable with other studies that reported higher
removal rates of around 80% [10,11]. It is theorized that the reason why the Alcomer does not achieve
a higher performance improvement may be because of the polymer itself or the performance of the
two primary clarifiers having an inherent difference requiring further data collection and statistical
analysis. Thus, the addition of Alcomer to the test primary clarifier was stopped in order to compare
the performance of the two primary clarifiers under similar conditions.
The shaded areas in Figure 3a–d represent the period when Alcomer was not added to the test
primary clarifier (Phase 2). The two primary clarifiers exhibited similar performance; however, another
observation to emerge from the data comparison between Phase 2 and Phase 1 was the increase in
the primary clarifier removal rate of TSS, COD, sCOD, and TP during Phase 2. During this period,
although polymer dosing was suspended, primary removals increased from an average of 68 ± 12,
40 ± 20, 20 ± 14, and 33 ± 20% during Phase 1 to 74 ± 19, 74 ± 10, 34 ± 16, and 51 ± 10% during Phase
2 for TSS, COD, sCOD, and TP, respectively. These increases may be explained due to the weather
conditions during Phase 1 testing; several snow melt events occurred in February during which
approximately 35 mm of rain was received. This resulted in elevated influent flows, which increased
the operating surface overflow rate more than those during Phase 2. Operation under these conditions
and the lower temperature (data shown in Figure S1) likely explains some of the reduced removals
observed during Phase 1.
In summary, the results from Phase 2 demonstrate that the treatment efficiency of the control
and test clarifiers when operated under identical condition were similar. Subsequently, the addition
of polymer was reinitiated, this time using the selected optimal polymer (PACl) in the test clarifier
for a period of over 2 months. Phase 3 results demonstrate a clear improvement in the removal rates
achieved for the parameters investigated (Figure 3a–d).
The full-scale monitoring results show that PACl added to the test clarifier achieved removals
of 89 ± 2% TSS, 76 ± 4% tCOD, 58 ± 7% sCOD, and 84 ± 5% TP. On the other hand, the control
primary clarifier, which is dosed with only ferric chloride, removed 77 ± 5% TSS, 62 ± 12% tCOD,
35 ± 10% sCOD, and 67 ± 12% TP. A comparison of the two results between the full-scale test and
control primary clarifiers reveal that the PACl combined with ferric chloride performed better than
ferric chloride on its own, which is in agreement with the jar test results. Thus, it can be concluded
that the PACl addition does greatly increase the performance of primary clarification.Water 2019, 11, 547 10 of 14
The improvements observed are not only limited to TSS removal, which in practice is the
design parameter for most full-scale applications of CEPT for overflow conditions, but enhanced
removals of COD, sCOD, and TP were also observed. The increased removal of these parameters
will provide significant benefit through the redirection of additional carbon and phosphorus to
primary sludge. The full-scale monitoring results presented in Figure 3 demonstrate that there is
potential to optimize the CEPT process, providing a significant benefit for facilities looking to optimize
phosphorus removal and increase carbon capture in primary sludge for redirection, reducing aeration
requirements by limiting the carbon that must be oxidized through secondary treatment. As discussed
previously, carbon redirection has the potential to significantly increase digester gas production rates
for facilities equipped with anaerobic digesters. On the other hand, facilities that utilize incineration for
solids disposal can derive benefit from increasing the calorific content of sludge processed, reducing
supplemental fuel requirements or assisting in achieving autogenous sludge conditions. However,
it is anticipated that the capture of additional nutrients in the primary sludge beyond those examined
under the current study will occur, so additional study is required to assess the potential impacts of
receiving sludge arising from PACl addition within anaerobic digestion systems.
3.4. Influence of Influent Characteristics on Removal Rates
The relationship between raw wastewater concentration (TSS, tCOD, sCOD, and TP) and
corresponding removal rates for the test clarifier was plotted to determine if there was any correlation.
To discern if the type of chemical dosing impacted the removal rate relative to influent characteristics,
Figure 4a–d were generated. The figures include data for Phases 1, 2, and 3 where Alcomer + ferric
chloride, ferric chloride, and PACl + ferric chloride were added to the test clarifier, respectively.
From the plots of raw TSS concentration vs. the observed TSS removal rate (Figure 4a), there was
no significant correlation observed under all test scenarios (Phases 1, 2, and 3). This result is consistent
with past research by Exall and Marsalek [25], which reported that the performance of PACl on the
removal of TSS does not depend on the initial TSS concentration.
For the relationship of tCOD, sCOD, and TP concentrations relative to their corresponding
removal rates, an interesting phenomenon was found. It was observed that the removal rates of
these parameters increased with the increase of the respective influent wastewater concentration,
but only during Phase 1 when Alcomer was used. However, this relationship between removal rates
and influent concentrations of tCOD, sCOD, and TP was not observed when PACl (Phase 3) was
used as a polymer (Figure 4b–d). This finding clearly demonstrates that COD and TP concentrations
may influence their respective removal rates when Alcomer is dosed, but not PACl. This might be
attributed to the difference in the removal mechanisms of the two polymers. The dominant removal
mechanism for Alcomer is charge neutralization and that of PACl is both charge neutralization and
polymer bridging. It should be noted that no dependency on influent characteristics for PACl could
indicate that the polymer behaves similarly when applied to wastewater of varying characteristics,
so the results observed under this study can be applicable to other sites. A comparative evaluation
between the TP/TSS ratios as a parameter to evaluate the TP removal efficiency across all three
phases was also conducted. As depicted in Figure 4e, for PACl addition (Phase 3), TP/TSS ratio and
TP removal were negatively correlated (r2 = 0.92), and in the other two scenarios (Phases 1 and 2)
TP removal was independent of the TP/TSS ratio (r2 < 0.10). Note that the r2 was calculated after
removing an outlier circled in red (Figure 4e). Therefore, at lower TSS concentrations, TP removal was
adversely affected when PACl was added, which contradicts the findings of a study conducted by
Szabo et al. [26], who observed less efficient phosphorus removal at higher TSS concentrations.Wa ter 2019, 11, x FOR PEER REVIEW 11 of 14
Water 2019,
affected when11, 547 11 of
PACl was added, which contradicts the findings of a study conducted by Szabo et al.14
[26], who observed less efficient phosphorus removal at higher TSS concentrations.
100 100
tCOD removal rate (%)
TSS removal rate (%)
80 80
60 60
40 40
20 20
0 0
0 100 200 300 400 0 150 300 450 600 750 900
Influent TSS (mg/L) Influent tCOD (mg/L)
(a) (b)
100 100
sCOD removal rate (%)
80 80
TP removal rate (%)
60
60
40
40
20
20
0
0 50 100 150 200 250 0
Influent sCOD (mg/L) 0 10 20 30
Influent TP (mg/L)
(c) (d)
100
TP removal rate (%)
80
60
40
20
0
0 0.05 0.1 0.15 0.2
TP/TSS
(e)
Figure
Figure4. 4.
Effe ct of of
Effect influe nt characte
influent ristics onon
characteristics reremoval
moval rate
rate:: (a)
(a)the
thee effect
ffe ct of
ofTSS
TSSconce ntration, (b)
concentration, (b)the
the
e ffe ct ofoftotal
effect totalCOD,
COD,(c) (c)the
theeeffect
ffe ct of
ofsoluble
soluble COD,
COD, (d)
(d) the
the eeffect
ffe ct of
of TP conce ntration,and
concentration, and(e)
(e)the
theeffect
e ffectof
ofTP/TSS
TP/TSS ratio.
ratio.
3.5.Influence
3.5. Influenceofof Influent
Influent Characteristics
Characteristicsonon
Removal Rates
Removal during
Rates Summer
during versusversus
Summer WinterWinter
SeasonSeason
InIn this
this section,
section, the
the impact
impact of of influent
influent characteristics
characteristics onon removal
removal rates
rates were
were further
further characterized
characterized
by comparing the summer versus winter data of the test clarifier during Alcomer polymer
by comparing the summer versus winter data of the test clarifier during Alcomer polymer addition addition
(Figure 5). The results were consistent with observations made in Section 3.4 except for sCODWater 2019, 11, 547 12 of 14
Wa ter 2019, 11, x FOR PEER REVIEW 12 of 14
(Figure 5). The results were consistent with observations made in Section 3.4 except for sCOD
removal where higher removals were observed during the summer season. For example, at a sCOD
removal where higher removals were observed during the summer season. For example, at a sCOD
concentration of 100 mg/L the corresponding removal rate during winter was 10%, whereas the
concentration of 100 mg/L the corresponding removal rate during winter was 10% , whereas the
removal increased to 30–50% during summer. This difference may be attributed to the presence of
removal increased to 30–50% during summer. This difference may be attributed to the presence of a
a larger colloidal fraction during summer. This also explained the discrepancy between the jar tests
larger colloidal fraction during summer. This also explained the discrepancy between the jar tests
versus full-scale sCOD removal data for PACl where the jar test that was conducted during winter
versus full-scale sCOD removal data for PACl where the jar test that was conducted during winter
showed 20% removal, whereas an average removal of 60% was demonstrated during full-scale testing
showed 20% removal, whereas an average removal of 60% was demonstrated during full-scale testing
that was conducted during summer.
that was conducted during summer.
100 80
tCOD removal rate (%)
TSS removal rate (%)
70
80
60
60 50
40
40
30
20 20
10
0
0
0 100 200 300 400
0 200 400 600
TSS (mg/L)
tCOD (mg/L)
(a) (b)
60 90
sCOD removal rate (%)
80
TP removal rate (%)
50
70
40 60
50
30
40
20 30
20
10
10
0 0
0 50 100 150 200 0 10 20 30
sCOD (mg/L) TP (mg/L)
(c) (d)
Figure 5. The effect of influent characteristics on removal rate during winter versus summer seasons:
Figure 5. The e ffe ct of influe nt characte ristics on re moval rate during winte r ve rsus summerseasons:
(a) TSS concentration, (b) total COD, (c) soluble COD, and (d) TP.
(a) TSS conce ntration, (b) total COD, (c) soluble COD, and (d) TP.
4. Conclusions
4. Conclusions
This study demonstrates that the optimized CEPT successfully achieved both carbon redirection
This study demonstrates
and removal of phosphorus. that the optimized
Through CEPT
jar testing, successfully
a dosage of 15 achieved both
mg/L ferric carbon and
chloride redirection
0.5 mg/L
and removal of phosphorus. Through jar testing, a dosage of 15 mg/L ferric chloride
PACl was selected as the best coagulant and flocculant combination. The application of this and 0.5optimum
mg/L
PACl was selected
dosage as theprimary
in full-scale best coagulant and
clarifier flocculanthad
operation combination. The application
demonstrated a removal ofefficiency
this optimumof 76%
dosage in full-scale primary clarifier operation had demonstrated a removal efficiency
tCOD, 58% sCOD, 89% TSS, and 84% TP. The organic carbon transferred to CEPT sludge could of 76% tCOD,
58% sCOD,anaerobic
increase 89% TSS,digester
and 84%gasTP. The organic
production carbon transferred
or promote autogenous to CEPT sludge
combustion couldincineration.
in sludge increase
anaerobic
Therefore,digester
CEPT cangasbe
production
consideredor as promote
a promising autogenous
method tocombustion in sludge
recover resources incineration.
from wastewater.
Therefore, CEPT can be considered as a promising method to recover resources from wastewater.
Supplementary Materials: The following is available online at www.mdpi.com/xxx/s1. Figure S1: Se asonal
change s in influe nt flow rate and te mperature of Vauxhall WWTP.Water 2019, 11, 547 13 of 14
Supplementary Materials: The following is available online at http://www.mdpi.com/2073-4441/11/3/547/s1.
Figure S1: Seasonal changes in influent flow rate and temperature of Vauxhall WWTP.
Author Contributions: T.D., W.A.S., and M.D. conceived and designed the experiments; T.D. conducted the
experiments; T.D. and W.A.S. analyzed the data and prepared the draft manuscript; M.D. reviewed, edited,
and contributed to the final paper; K.M. provided wastewater treatment plant data and participated in the writing
and editing.
Funding: This research was funded by the Natural Sciences and Engineering Research of Canada (NSERC),
grant number 2017-05178.
Acknowledgments: We thank Geordie Gauld and Randy Robinson from the City of London for their assistance
in wastewater sample and data collection.
Conflicts of Interest: The authors declare no conflict of interest.
References
1. Jimenez, J.A. Carbon redirection in water reuse and recovery facilities: Technologies Overview. Proc. Water
Environ. Fed. 2017, 3, 21–23. [CrossRef]
2. Neupane, D.R.; Riffat, R.; Murthy, S.N.; Peric, M.R.; Wilson, T.E. Influence of Source Characteristics,
Chemicals, and Flocculation on Chemically Enhanced Primary Treatment. Water Environ. Res. 2008,
80, 331–338. [CrossRef] [PubMed]
3. Tchobanoglous, G.; Stensel, H.D.; Tsuchihashi, R.; Burton, F.L. Wastewater Engineering: Treatment and Resource
Recovery, 5th ed.; McGraw-Hill Education: New York, NY, USA, 2014.
4. Wang, H.; Li, F.; Keller, A.A.; Xu, R. Chemically enhanced primary treatment (CEPT) for removal of carbon
and nutrients from municipal wastewater treatment plants: A case study of Shanghai. Water Sci. Technol.
2009, 60, 1803–1809. [CrossRef]
5. Ødegaard, H. Optimized particle separation in the primary step of wastewater treatment. Water Sci. Technol.
1998, 37, 43–53. [CrossRef]
6. Aiyuk, S.; Amoako, J.; Raskin, L.; Van Haandel, A.; Verstraete, W. Removal of carbon and nutrients from
domestic wastewater using a low investment, integrated treatment concept. Water Res. 2004, 25, 1321–1330.
[CrossRef] [PubMed]
7. He, Q.; Wang, H.; Xu, C.; Zhang, J.; Zhang, W.; Zou, Z.; Yang, K. Feasibility and optimization of wastewater
treatment by chemically enhanced primary treatment (CEPT): A case study of Huangshi. Chem. Spec. 2016,
28, 209–215. [CrossRef]
8. Ghafari, S.; Aziz, H.A.; Isa, M.H.; Zinatizadeh, A.A. Application of response surface methodology (RSM)
to optimize coagulation-flocculation treatment of leachate using poly-aluminum chloride (PAC) and alum.
J. Hazard. Mater. 2009, 163, 650–656. [CrossRef] [PubMed]
9. National Research Council. Wastewater Management in Urban Coastal Areas; National Academy Press:
Washington, DC, USA, 1992.
10. Lin, L.; Li, R.H.; Li, Y.; Xu, J.; Li, X. Recovery of organic carbon and phosphorus from wastewater by
Fe-enhanced primary sedimentation and sludge fermentation. Process Biochem. 2017, 54, 135–139. [CrossRef]
11. Mahmoud, E.K. Chemically enhanced primary treatment of textile industrial effluents. Polish J. Environ. Stud.
2009, 18, 651–655.
12. Shi, B.; Li, G.; Wang, D.; Feng, C.; Tang, H. Removal of direct dyes by coagulation: The performance of
preformed polymeric aluminum species. J. Hazard. Mater. 2007, 143, 567–574. [CrossRef]
13. Vauxhall Wastewater Treatment Plant: 2016 Annual Report. Available online: http://www.london.ca/
residents/Sewers-Flooding/Sewage-Treatment/Documents/VAUXHALL16-AODA.pdf (accessed on 9
November 2017).
14. Aguilar, M.I.; Sáez, J.; Lloréns, M.; Soler, A.; Ortuño, J.F.; Meseguer, V.; Fuentes, A. Improvement of
coagulation-flocculation process using anionic polyacrylamide as coagulant aid. Chemosphere 2005, 58, 47–56.
[CrossRef] [PubMed]
15. De Feo, G.; De Gisi, S.; Galasso, M. Definition of a practical multi-criteria procedure for selecting the best
coagulant in a chemically assisted primary sedimentation process for the treatment of urban wastewater.
Desalination 2008, 230, 229–238. [CrossRef]Water 2019, 11, 547 14 of 14
16. APHA; AWWA; WPCF. Standard Methods for the Examination of Water and Wastewater, 21st ed.; American
Public Health Association: Washington, DC, USA, 2005.
17. Ghasemi, A.; Zahediasl, S. Normality tests for statistical analysis: A guide for non-statisticians. Int. J.
Endocrinol. Metab. 2012, 10, 486–489. [CrossRef] [PubMed]
18. Lin, L.; Li, R.H.; Li, X.Y. Recovery of organic resources from sewage sludge of Al-enhanced primary
sedimentation by alkali pretreatment and acidogenic fermentation. J. Clean. Prod. 2018, 172, 3334–3341.
[CrossRef]
19. Edzwald, J.K. Coagulation in drinking water treatment: Particles, organics and coagulants. Water Sci. Technol.
1993, 27, 21–35. [CrossRef]
20. Haydar, S.; Aziz, J.A. Characterization and treatability studies of tannery wastewater using chemically
enhanced primary treatment (CEPT)-A case study of Saddiq Leather Works. J. Hazard. Mater. 2009, 163,
1076–1083. [CrossRef]
21. Hauduc, H.; Takács, I.; Smith, S.; Szabo, A.; Murthy, S.; Daigger, G.T.; Spérandio, M. A dynamic
physicochemical model for chemical phosphorus removal. Water Res. 2015, 73, 157–170. [CrossRef]
22. Ratnaweera, H.; Odegaard, H.; Fettig, J. Coagulation with prepolymerized aluminium salts and their
influence on particle and phosphate removal. Water Sci. Technol. 1992, 26, 1229–1237. [CrossRef]
23. Wei, J.; Gao, B.; Yue, Q.; Wang, Y.; Li, W.; Zhu, X. Comparison of coagulation behavior and floc structure
characteristic of different polyferric-cationic polymer dual-coagulants in humic acid solution. Water Res.
2009, 43, 724–732. [CrossRef]
24. Yan, M.; Wang, D.; Ni, J.; Qu, J.; Ni, W.; Van Leeuwen, J. Natural organic matter (NOM) removal in a typical
North-China water plant by enhanced coagulation: Targets and techniques. Sep. Purif. Technol. 2009, 68,
320–327. [CrossRef]
25. Exall, K.; Marsalek, J. A coagulant survey for chemically enhanced primary treatment of synthetic CSOs.
Water. Air. Soil Pollut. 2013, 224, 1414. [CrossRef]
26. Szabó, A.; Takács, I.; Murthy, S.; Daigger, G.T.; Licskó, I.; Smith, S. Significance of Design and Operational
Variables in Chemical Phosphorus Removal. Water Environ. Res. 2008, 80, 407–416. [CrossRef] [PubMed]
© 2019 by the authors. Licensee MDPI, Basel, Switzerland. This article is an open access
article distributed under the terms and conditions of the Creative Commons Attribution
(CC BY) license (http://creativecommons.org/licenses/by/4.0/).You can also read