The impact of atmospheric rivers on rainfall in New Zealand - Nature
←
→
Page content transcription
If your browser does not render page correctly, please read the page content below
www.nature.com/scientificreports
OPEN The impact of atmospheric rivers
on rainfall in New Zealand
Jingxiang Shu1*, Asaad Y. Shamseldin1,3 & Evan Weller2,3
This study quantifies the impact of atmospheric rivers (ARs) on rainfall in New Zealand. Using
an automated AR detection algorithm, daily rainfall records from 654 rain gauges, and various
atmospheric reanalysis datasets, we investigate the climatology of ARs, the characteristics of
landfalling ARs, the contribution of ARs to annual and seasonal rainfall totals, and extreme rainfall
events between 1979 and 2018 across the country. Results indicate that these filamentary synoptic
features play an essential role in regional water resources and are responsible for many extreme
rainfall events on the western side of mountainous areas and northern New Zealand. In these regions,
depending on the season, 40–86% of the rainfall totals and 50–98% of extreme rainfall events are
shown to be associated with ARs, with the largest contributions predominantly occurring during the
austral summer. Furthermore, the median daily rainfall associated with ARs is 2–3 times than that
associated with other storms. The results of this study extend the knowledge on the critical roles
of ARs on hydrology and highlight the need for further investigation on the landfalling AR physical
processes in relation to global circulation features and AR sources, and hydrological hazards caused by
ARs in New Zealand.
Atmospheric rivers (ARs) are global phenomena primarily occurring in the midlatitudes, distinguished by fila-
mentary regions of strong horizontal water vapour transport in the a tmosphere1–7. Firstly described by Newell
et al.2, ARs are synoptic-scale filaments representing the 4 or 5 largest water vapour fluxes that occur between
the midlatitudes and the tropics on any given day, and the length of an AR is generally five times its width. ARs
often linked to extratropical cyclones and fronts4,5, the key mechanisms of precipitation8,9 and play a critical
role in extreme precipitation e vents10 in the midlatitudes. As part of extratropical cyclones and fronts, ARs have
significant hydrological impacts when making landfall for most mid-latitude regions globally, including extreme
precipitation events11–15 and the frequency of the occurrence of droughts and floods16.
ARs significantly contribute to precipitation totals and produce heavy orographic precipitation when passing
mountainous regions in the midlatitudes. Notable contributions of ARs to precipitation totals have been docu-
mented on the west coast of North America17,18, the central United S tates19, western E urope20, southern south
America21, and South Africa22. ARs can contribute to more than 50% of annual or seasonal precipitation totals
(cool season in particular) for these regions. Further, there is a strong connection between the heavy precipita-
tion events and ARs in these r egions21–25. For example, storm events (3-day precipitation total exceeds 400 mm)
in California between the 1998 and 2008 water years are shown to be all associated with A Rs17.
Rainfall caused by the combined effect of extratropical cyclones and their associated fronts with orographic
lifting is typical in New Zealand19. Generally, this combined effect determines the location and intensity of
heavy rainfall events across the country, commonly on the western side of mountainous areas and northern New
Zealand19,26. For the South Island of the country, orographic precipitation is the major precipitation m echanism27.
The highest annual precipitation totals in New Zealand (over 10,000 mm) occur in the Southern A lps28 as this
29,30
extended mountain range provides a significant barrier to the prevailing a irflows all year round. For the North
Island, frontal systems and extratropical cyclones are the dominant precipitation m echanisms19,31,32, yet moun-
tain ranges and volcanic mountain peaks in the North Island also provide obstacles to the prevailing a irflows19.
Because of its geographic location, New Zealand’s climate is governed by two dynamical global circula-
tion features19: the westerly wind belt33–35 to the south and the band of subtropical anticyclones19 to the north.
As such, the seasonality of these global circulation features strongly influence the rainfall seasonality in the
country26,31,33,34,36,37. For example, the overall seasonal pattern of rainfall in the North Island sees higher rainfall
in winter (JJA) due to the increased occurrence of frontal systems when the country experiences more westerlies,
1
Department of Civil and Environmental Engineering, The University of Auckland, Auckland Mail Centre, Private
Bag 92019, Auckland 1142, New Zealand. 2School of Environment, The University of Auckland, Auckland Mail
Centre, Private Bag 92019, Auckland 1142, New Zealand. 3These authors contributed equally: Asaad Y. Shamseldin
and Evan Weller. *email: jshu987@aucklanduni.ac.nz
Scientific Reports | (2021) 11:5869 | https://doi.org/10.1038/s41598-021-85297-0 1
Vol.:(0123456789)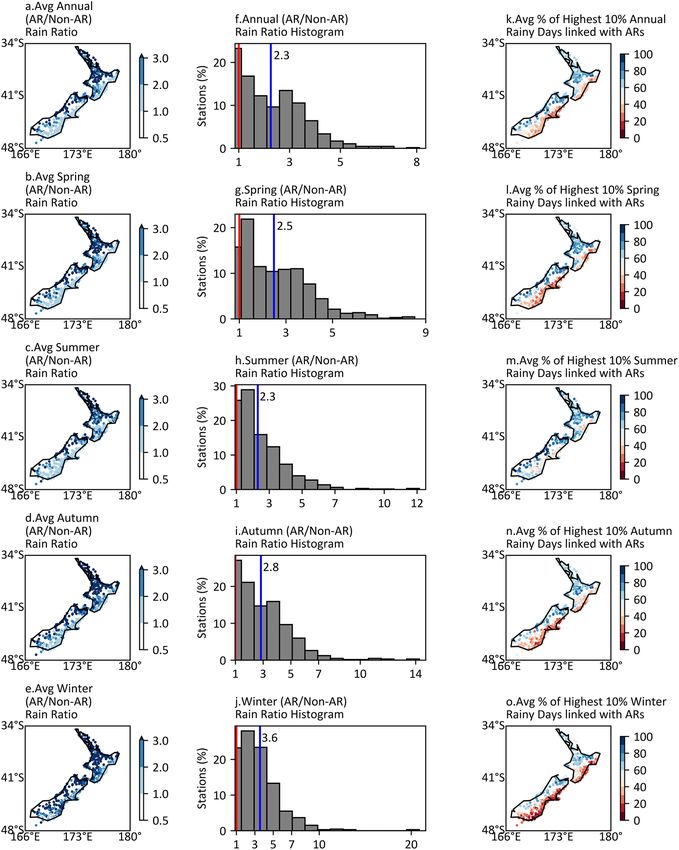
www.nature.com/scientificreports/
and lower rainfall in summer (DJF) as the belt move towards the s outh26,31,37. Conversely, the South Island sees
the opposite rainfall seasonal p attern19.
For New Zealand, several global AR studies have noted a considerable occurrence of landfalling ARs and
their association with heavy precipitation events14,15,38 and the frequency of drought and flood o ccurrences16.
However, these global studies are unable to reflect regions highly impacted by ARs, especially considering the
diverse orography in New Zealand. Additionally, AR frequency and strength is projected to increase by 60%
and 20%, respectively, under the most severe future climate scenario in the southern midlatitudes39. To this end,
the hydrological impact of ARs is likely to be altered in the country. Therefore, evaluating the impact of ARs on
rainfall at a local scale in New Zealand is essential, given the local climate features, the critical role that ARs play
in the global water cycle and midlatitudes climate and hydrology, and the changing climate.
In this study, we hypothesise that this evaluation will be useful for better understanding the causes of both
the spatial distribution of annual and seasonal rainfall totals and heavy rainfall events across the country to
provide more useful information for better assessment of climate change impacts on hydrology. The objectives
of the present study are (1) to investigate the climatology of ARs in New Zealand; (2) to evaluate the fraction
of seasonal and annual rainfall totals linked with ARs; (3) to compare the intensity of AR rainfall and non-AR
rainfall, and to investigate the association between the ARs and heavy rainfall events.
Briefly, ARs are defined as regions where the intensity of integrated water vapour transport (IVT) exceeds
predefined thresholds with a length greater than 2,000 km and length/width ratio greater than 2 6,23,38. An auto-
mated AR detection algorithm and six 6-hourly reanalysis datasets (Table S1) with varying spatial resolutions
(ERA-interim: 0.125° × 0.125° and 1.5° × 1.5°, ERA-5: 0.25° × 0.25°, CFSR: 0.5° × 0.5° and 1.5° × 1.5°, MERRA-2:
0.5° × 0.625° during the period of 1979–2018, 1979–2018, 1979–2015, 1980–2019, respectively) were used to
identify ARs around New Zealand. Detected landfalling ARs from each dataset were used to compare the char-
acteristics of landfalling ARs and provide a general view of landfalling ARs in the country.
The assessment of AR impact on rainfall totals and daily rainfall intensity was based on daily rainfall records
from 654 rain gauges with a mean length of 19 years from 1979 to 2018. Rain gauge locations are shown in
Fig. 5. If an AR event coincides with a rainfall event (> 0 mm) within the same day at a rain gauge site, that day
was labelled a “wet” AR day for that site, and that rain was considered to be associated with the AR. Note that
ERA-interim ARs (with 0.125° × 0.125° spatial resolution) were used to assess the AR impact on rainfall in this
study as using higher-resolution for this type of AR impact assessment whenever possible is r ecommended25. A
more detailed description of the datasets, AR detection method, and methods to quantify ARs’ impact on rainfall
totals and daily rainfall intensity for each 654 rain gauge is provided in the Methods section.
Results
Climatology of ARs over New Zealand. This section presents the climatology of ERA-interim ARs and
characteristics of the detected landfalling ARs at a 0.125° × 0.125° horizontal grid resolution over New Zealand
from 1979 to 2018. Results from other databases are shown in the supplementary materials, where the spatial
resolution of the other datasets examined is lower than that of ERA-interim. Note that the analysis in this section
only represents ARs at some moment of their life cycle as the temporal resolution of all reanalysis datasets is 6 h.
The frequency of AR days and the coefficient of variation (CV) of AR days for each grid cell are shown in
Fig. 1. Generally, there are 70 to 90 days per year with AR occurrence across New Zealand, and the South Island
experiences more AR days than the North Island (Fig. 1a). The frequency of AR days is higher in warm seasons
than in cool seasons, and the South Island experiences more AR days than the North Island in summer, yet
fewer AR days in winter (Fig. 1b–e). The interannual variation for seasonal AR frequency (0.2–0.4) is notably
higher than the annual scale (generally less than 0.1), and cool seasons experience larger variation compared
with warm seasons (Fig. 1f–j). Coarsening the ERA-Interim and CFSR spatial resolution from 0.125° × 0.125° to
1.5° × 1.5° and 0.5° × 0.5° to 1.5° × 1.5°, respectively, results in slight differences in AR frequency and the CV of AR
frequency over New Zealand. However, the seasonal pattern of AR frequency remains similar (see Figs. S1–S3) .
Geometric characteristics, mean landfalling AR direction and AR landfall frequency, and seasonal landfall-
ing AR intensity and mean landfalling AR direction are shown in Fig. 2 (ERA-Interim) and Figs. S4–S6 (ERA-5,
CFSR, and MERRA-2, respectively). The number of detected landfalling ARs and the mean percentage of monthly
landfalling AR frequency is shown in Tables S1 and S2, respectively. The statistical characteristics of the land-
falling AR length, mean direction, and length/width ratio generally agree with each other among the datasets,
and all histograms are positively skewed (Figs. 2a,b,d and S4–S6a,b,d). Overall, the long and narrow feature of
landfalling ARs is notable, the median of the length and the length/width ratio is about 5730 km (over 4700 km)
and 8.9 (~ 8.4) for ERA-Interim (Fig. 2a,b) and other datasets (Figs. S4–S6a,b), respectively. In some cases, ARs
can be longer than 10,000 km with a length/width ratio greater than 20. Coarsening the ERA-Interim and CFSR
spatial resolution from 0.125° × 0.125° to 1.5° × 1.5° and 0.5° × 0.5° to 1.5° × 1.5° results in less landfalling ARs. For
example, the number of detected landfalling ARs reduced from 17,876 to 4,057 and 12,904 to 3445, respectively
(Table S1). Furthermore, datasets with coarser grid cells tend to reduce the occurrence of detected landfalling
ARs regardless of the reanalysis dataset (Table S1).
Landfalling ARs commonly have a northwest direction, the median of the mean direction is about 121.5°
(~ 123°) for ERA-Interim (Fig. 2d) and other datasets (Figs. S4–S6d). Moreover, ARs commonly approach the
west side of New Zealand from a northwest direction, and in some cases from a northeast direction on the east
side (Figs. 2e and S4–S6e). Summer landfalling ARs are generally stronger than those in winter (Figs. 2c and
S4–S6c). The frequency of landfall along the west coasts is notable throughout the country, especially central-
eastern and northern parts of the North Island, and southern parts of the South Island, with only small differ-
ences over southern parts of the North Island among the four datasets (Figs. 2f and S4–S6f). The seasonal pattern
of landfalling AR occurrence is slightly different among the six datasets. However, the mean percentage of the
Scientific Reports | (2021) 11:5869 | https://doi.org/10.1038/s41598-021-85297-0 2
Vol:.(1234567890)
www.nature.com/scientificreports/

                                  Figure 1.  The climatology of AR frequency over New Zealand. (a) Annual frequency of AR days on each grid
                                  cell per year. (b–e) Difference between seasonal AR frequency and its seasonal mean frequency on each grid cell
                                  per year. (f–j) Annual and seasonal coefficients of variation of AR frequency for each grid cell. Note that months
                                  of seasons are: Spring (SON), Summer (DJF), Autumn (MAM), Winter (JJA).

                                  occurrence in summer (30%) and spring (29%) is greater than in autumn (23%) and winter (20%), and the dif-
                                  ferences for the mean percentage of the monthly occurrences are all less than 3% (Table S2).

                                  Contribution of ARs to rainfall totals.          This section examines the impact of detected ERA-interim ARs
                                  (at a 0.125° × 0.125° horizontal grid resolution) on rainfall totals and the frequency of wet AR days across New
                                  Zealand. Average annual and seasonal rainfall totals are shown in Fig. 3a–e. Generally, higher rainfall totals
                                  occur on the western side of the mountain ranges and mountain peaks across New Zealand. The highest annual
                                  and seasonal rainfall totals are recorded on the west side of the mountain range in the South Island (the South-

Scientific Reports |   (2021) 11:5869 |                https://doi.org/10.1038/s41598-021-85297-0                                                  3

                                                                                                                                             Vol.:(0123456789)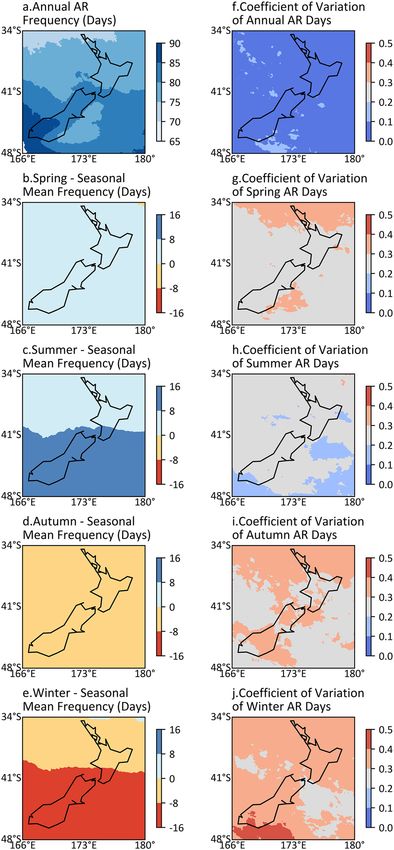
www.nature.com/scientificreports/

                                            Figure 2.  Histograms of detected landfalling ARs’ length (a), Length/width ratio (b), Landfalling AR mean
                                            direction (d), where blue vertical lines indicate the median value in each histogram. (c) Mean landfalling
                                            AR direction (angular coordinate) and seasonal landfalling AR intensity (radial coordinate) at landfall. (e)
                                            Landfalling ARs mean direction at landfall. (f) Proportional map of AR landfall frequency at landfall. Note that
                                            months of seasons are: Spring (SON), Summer (DJF), Autumn (MAM), Winter (JJA).

                                            ern Alps). Seasonality in rainfall totals is notable for the North Island, being highest in the winter and lowest in
                                            summer.
                                               The average fraction of annual and seasonal rainfall totals linked with ARs for each rain gauge are shown
                                            in Fig. 3f–j. The frequency of wet AR days is shown in Fig. 3k–o. The annual and seasonal fraction of rainfall
                                            totals linked with ARs is mostly over 50% except during winter on the west side of mountain ranges, mountain
                                            peaks, and northern North Island. For these areas, the highest fractions are recorded in summer (75–86%) and
                                            the lowest recorded in winter (15–40%). The seasonal frequency of wet AR days in these areas ranges from 5 to
                                            31 days, with the highest frequency in summer and lowest in winter (Fig. 3k–o).

          Scientific Reports |   (2021) 11:5869 |                https://doi.org/10.1038/s41598-021-85297-0                                                    4

Vol:.(1234567890)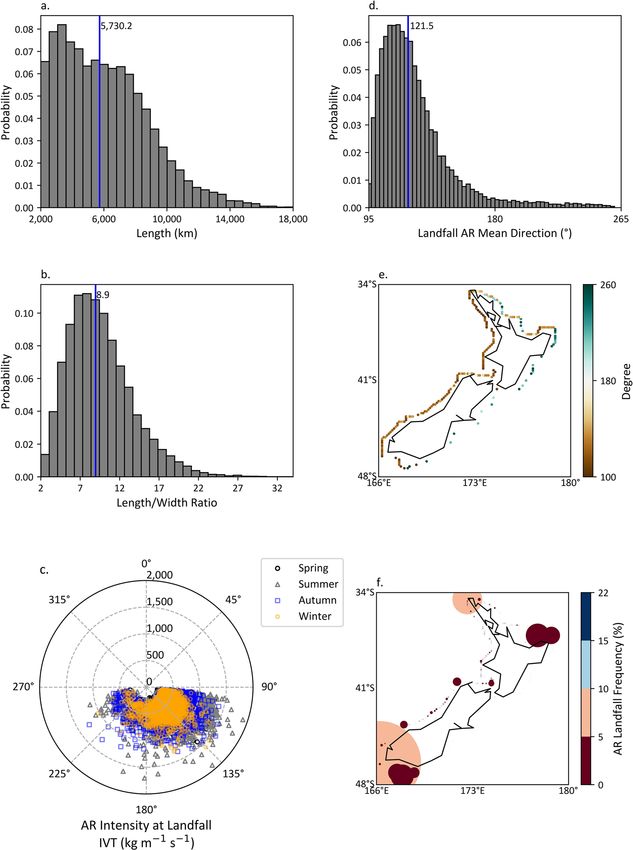
www.nature.com/scientificreports/

                                  Figure 3.  Maps of annual and seasonal rainfall totals, percentage of rain totals linked with ARs, and the
                                  frequency of wet AR days per year for each site. (a–e) Average annual and seasonal rainfall totals. (f–j) Annual
                                  and seasonal average percentages of rain totals linked with ARs. (k–o) Annual and seasonal frequency of wet AR
                                  days per year. Note that months of seasons are: Spring (SON), Summer (DJF), Autumn (MAM), Winter (JJA).

Scientific Reports |   (2021) 11:5869 |               https://doi.org/10.1038/s41598-021-85297-0                                                5

                                                                                                                                           Vol.:(0123456789)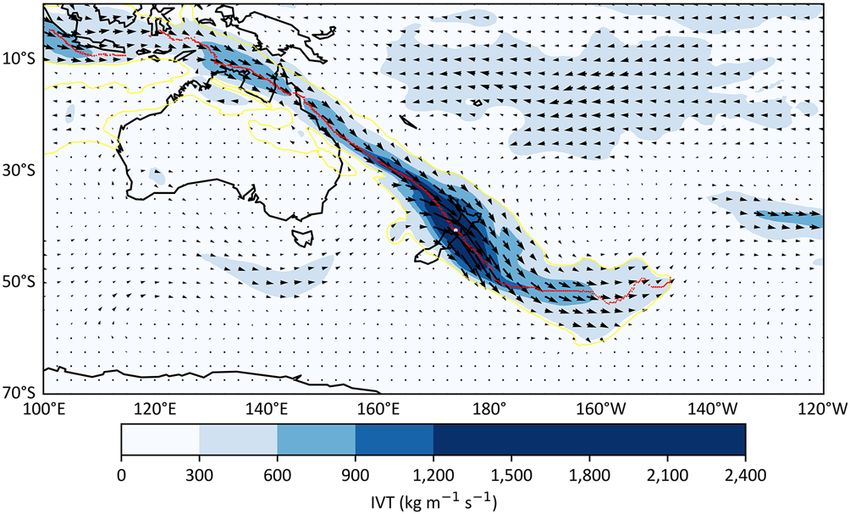
www.nature.com/scientificreports/
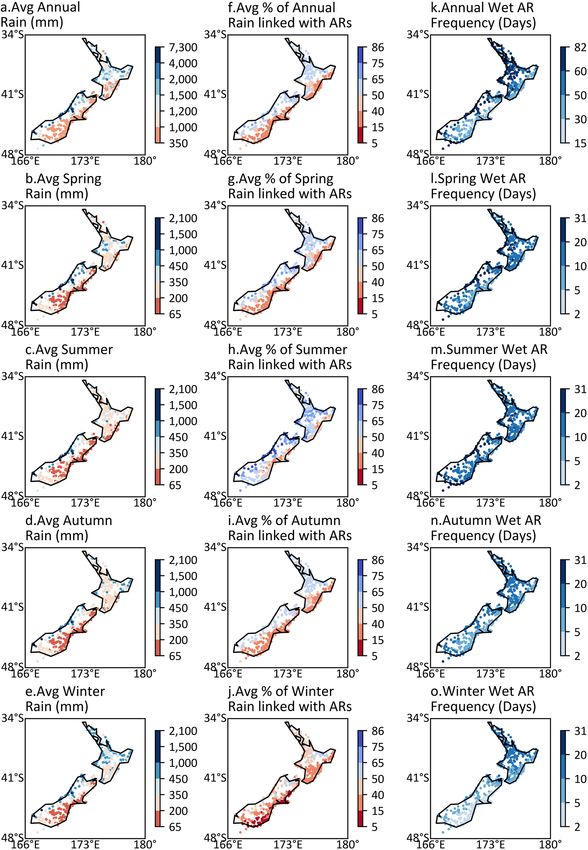
Impact of ARs on extreme rainfall events. The ratio of the median daily AR rainfall over non-AR
rainfall at the annual and seasonal scales are shown in Fig. 4a–j. Interestingly, AR storms are found to produce
greater than 2 times more daily rainfall than non-AR storms at most stations, and significantly greater than three
times for the west side of mountainous areas and northern New Zealand. The ratios in winter are also notably
high, particularly for some stations where the ratio can be over 20.
The connection of the most intense rainy days between ARs is explored by considering those days where
rainfall exceeds the 90th percentile values of the series of daily rainfall. Figure 4k–o show the annual and seasonal
fractions of those intense rainy days associated with ARs at each station. Generally, 50–98% of extreme rainfall
events are associated with AR conditions on the west side of mountainous regions and northern New Zealand,
depending on the season. The highest fraction for each station in these areas occurs in summer, whereby some
exhibit values over 90% and 80% in the South and North Island, respectively.
Discussion
The investigation of the impact of ARs on rainfall in this study is a major step toward understanding the hydrol-
ogy and extreme rainfall events in New Zealand. In this study, the impact of ARs on rainfall was evaluated
using a high-resolution atmospheric reanalysis dataset and a network of station rainfall data, combined with an
automated AR detection algorithm introduced by Guan and Waliser38. Overall, ARs are found to have a strong
hydrological impact over western areas of mountain ranges and mountain peaks, and northern New Zealand.
Note that the discussion on the impact of ARs on rainfall only focuses on these areas.
New Zealand is an AR-highly impacted country15,16,38. The filamentary synoptic feature is notable whereby the
median length of landfalling ARs is more than 5000 km (over 4700 km) for ECMWF products (other reanalysis
datasets used), and the median length/width ratio is over 8 for all reanalysis datasets (Figs. 2 and S4–S6). How-
ever, it should be noted that coarser spatial resolution datasets tend to reduce the number of detected landfalling
ARs. For example, coarsening the ERA-Interim and CFSR spatial resolution results in a notable reduction in
the number of detected landfalling ARs (Table S1). This is also true for reanalysis datasets with coarser spatial
resolution regardless of the reanalysis dataset (Table S1). Specifically, datasets with coarser spatial resolution
might lead to the decreased occurrence in the comparably long landfalling ARs, because, for instance, the prob-
ability of landfalling ARs with length greater than 10,000 km in CFSR and MERRA-2 (coarser spatial resolution)
is markedly less than in ERA-Interim and ERA-5 (higher spatial resolution) (Figs. 2a and S4–S6a). As a result,
the median length of landfalling ARs for coarser spatial resolution is less than that of higher spatial resolution.
The sensitivity analysis results in the geometric characteristics of landfalling ARs generally agree with Guan
and Waliser38, as they found that coarsening the spatial resolution of the same reanalysis products can lead to a
decreased occurrence of detected elongated ARs and shift the histogram of length/width ratio to left. Landfalling
ARs generally have a northwest direction, but some exhibit a northeast direction along some coasts (Figs. 2e and
S4–S6e). Characteristics in the landfalling AR direction across New Zealand generally agree with results in Guan
and Waliser38. Additionally, landfalling ARs are generally more frequent and stronger in summer (DJF) than
in winter (JJA) (Figs. 2c and S4–S6c, Table S2). Most landfall occurs along the west coasts through the country
(Figs. 2e,f and S4–S6e,f), the frequency of landfall is relatively high over the central-eastern and northern parts
of the North Island, and southern parts of the South Island (Figs. 2f and S4–S6f).
Overall, 50–65% of the annual and 40–86% of seasonal rainfall totals accumulated only within approximately
30–82 and 5–31 wet AR days respectively (Fig. 3), depending on the location of the rain gauge and season. This
indicates that AR storms in these regions play a key role in water resources, and particularly true for the western
coast of the Southern Alps where 50–65% of annual rainfall totals (nearly 7000 mm) accumulated within 60–82
wet AR days. Additionally, the highest AR contribution occurs in summer (DJF), which is also the season that
the western coast of the Southern Alps receives the highest amount of rainfall and the season that landfalling
AR occurrence and intensity is relatively high (Figs. 1, 2, 3 and S4–S6, Table S2). The results suggest that AR
seasonality and orography largely determine the water availability in this region.
Rainfall in the country is strongly influenced by the interaction between the orography and the prevailing
airflows40,41. As a result, the western areas of the country’s mountain ranges receive higher rainfall a mounts19,26.
North Island rainfall is relatively high in winter (JJA) as the frontal systems’ occurrence increases when the
country is covered more by the westerly wind belt37. However, the belt moves further south during the summer
(DJF) months and leads to lower rainfall in the North I sland19,37. Consequently, the seasonal pattern of rainfall
in the two islands differs19. Further study on the landfalling AR physical processes related to global circulation
features and source of ARs around New Zealand is needed.
AR storms are more intense than non-AR storms all year round and found to produce 2–20 times the non-AR
rainfall depending on the rain gauge location and season (Fig. 4). Particularly, cool-season daily rainfall intensity
related to AR storms is more intensive compared with non-AR rain in most of New Zealand. The connection
between the extreme rainfall events and ARs are notably high, ranging from 50% to 98% depending on the rain
gauge locations and seasons (Fig. 4). Indeed, the percentage is over 90% in some areas on the west side of the
Southern Alps in summer (DJF). As ARs are often related to fronts, the impact of ARs on extreme rainfall events
in this study agrees with Catto and P fahl10, although the 99th threshold was used in their study.
Further, results in this study suggest a potential connection between hydrological droughts and floods in
northern New Zealand and where the orography dominates the weather progression in the country (Figs. 2f
and S4–S6f). Droughts and floods are the most costly and damaging natural hazards in New Zealand42. Under
the changing climate, the frequency and magnitude of floods are likely to increase as a result of the increased
frequency and intensity of extreme rainfall in New Zealand43. Climate change is expected to also lead to increases
in the frequency of droughts in vast areas of the North Island44, including regions where ARs are the major con-
tributor to water resources. Moreover, climate change is suggested to result in a 60% and 20% increase in the AR
Scientific Reports | (2021) 11:5869 | https://doi.org/10.1038/s41598-021-85297-0 6
Vol:.(1234567890)www.nature.com/scientificreports/
Figure 4. Maps of the average annual and seasonal AR/Non-AR rain ratio and the average percentage of the
highest 10% rainy days linked with ARs, and histograms of AR/Non-AR rain ratio. (a–e) Annual and seasonal
mean ratio of AR/Non-AR daily rainfall totals for each site. (f–j) Histograms of annual and seasonal mean ratio
of AR/Non-AR daily rainfall totals. Red vertical lines in histograms locate the ratio 1, and blue vertical lines
indicate the median values. (k–o) Annual and seasonal average percentage of the highest 10% rainy days linked
with ARs. Note that months of seasons are: Spring (SON), Summer (DJF), Autumn (MAM), Winter (JJA).
frequency and strength in the southern midlatitudes, respectively39. Therefore, further work on investigating the
connection between hydrological hazards and ARs focusing on regions exposed to both ARs and these hazards
is needed for a better assessment of climate change impact on natural hazards.
Methods
Reanalysis and station rainfall data. It is common to employ more than one dataset to assess the robust-
ness of AR detection techniques. Datasets used to identify ARs are the European Centre for Medium-Range
Weather Forecasts (ECMWF) Interim (ERA-interim)45 and the most recent reanalysis dataset version ECMWF,
Scientific Reports | (2021) 11:5869 | https://doi.org/10.1038/s41598-021-85297-0 7
Vol.:(0123456789)www.nature.com/scientificreports/
namely the ERA-5 reanalysis p roject46. Atmospheric reanalysis data between 1979 and 2018 from ERA-interim
and ERA-5 at 0.125° × 0.125° and 0.25° × 0.25° horizontal grid resolution were retrieved, respectively. Data used
are 6-hourly specific humidity and zonal wind and meridional wind components at 20 vertical pressure levels
(300 hPa to 1000 hPa), and land-sea mask. Additionally, detected ARs based on ERA-Interim, the Climate Fore-
cast System Reanalysis47 (CFSR), and the Modern-Era Retrospective Analysis for Research and Applications48,
Version 2 (MERRA-2) were retrieved from a global AR database38. Note that the AR detection period based
on ERA-Interim, CFSR, and MERRA-2 is 1979–2018, 1979–2015 and 1980–2019, respectively, with a 6-hourly
temporal resolution at 1.5° × 1.5°, 0.5° × 0.5°(and 1.5° × 1.5°), and 0.5° × 0.625° horizontal grid resolution, respec-
tively. Table S1 summarised all the information about the datasets employed. The integrated water vapour trans-
port (IVT) intensity at each grid cell was calculated in an Eulerian f ramework22,25,49 as:
IVT = IVT 2x + IVT 2y (1)
1
300hPa
IVT x = qu dp (2)
g 1000hPa
1
300hPa
IVT y = qv dp (3)
g 1000hPa
where q, u , and v are specific humidity (kg kg-1), zonal and meridional vectors (m s-1), respectively; g is the
gravitational acceleration (9.81 m s−2), and dp (Pa) is the pressure difference between two adjacent atmospheric
pressure levels. Note that all parameters in Eqs. (2) and (3) were collected at discrete atmospheric pressure
levels from the selected datasets. According to Guan and W aliser38, the median length of global 1997–2014
ARs is about 3,665.1 km. For the ARs detected in the Southern Hemisphere, ARs commonly have a northwest
direction with a median degree of 120.6°, and the median latitude of the AR equatorward end, centroid, and the
poleward end is 28.5°S, 41.1°S, and 49.5°S respectively. Considering that the longitude length of a degree at 49.5°S
is approximately 72 km and the first eastward meridian line across New Zealand is at about 166°E. Therefore,
data retrieved over the 0–70°S and 100°E–120°W domain is considered adequate (166°E–100°E = 66°, 66° × 72
km/° = 4725 km > 3665.1 km).
Station-based daily rainfall totals were obtained from New Zealand’s national climate database web system
hosted by the National Institute of Water and Atmospheric Research (NIWA). Note that the periods of records
differ among sites, and the observation times of the day are 2100 UTC (2000UTC) during the wintertime (sum-
mertime). Sites with less than 10 years of daily rainfall records between (September–August) 1979 to 2018 and
completeness less than 100% were excluded because the lack of daily rainfall data could potentially lead to under-
or overestimations in the hydrological impacts of ARs. Given these conditions, a total of 654 stations with the
minimum, maximum, and mean length of 10, 39, and 19 years respectively were selected over the whole country.
Figure 5 shows rain gauge locations.
AR detection method. CFSR and MERRA-2 ARs were obtained from a global AR d atabase38. ERA-interim
and ERA-5 ARs were detected based on the AR detection algorithm introduced in Guan and W aliser38. In the
algorithm, IVT and IVT threshold (monthly 85th percentile within a 5-month window centred at that month)
for each grid cell and the land-sea mask from the two datasets are the inputs. Note that the land-sea mask values
were adjusted only to contain grid cells represent New Zealand landmasses (1 s represent New Zealand land-
masses, 0 s refer to others). Briefly, criteria of the AR detection algorithm include the IVT intensity at each grid
cell within a contiguous region being above the IVT threshold and a fixed limit (IVT > 100 kg m−1 s−1) for that
grid cell, the appreciable poleward direction of the AR (IVTy > 50 kg m−1 s−1), and the length of an AR greater
than 2000 km with a length/width ratio greater or equal to 2. Outputs from the algorithm include the variables
of shape, axis, and landfall location of the ARs in NetCDF files and detailed characteristics of landfalling ARs in
text files. The AR shape variable was used to compute the AR area, the axis was used to calculate the AR length,
and the width was calculated as the area divided by the length. The landfall location was marked as the first grid
cell that the AR axis intersects the coastlines alone the IVT direction and that AR was labelled as a landfall-
ing AR. The detailed description of the AR detection procedure and criteria of this technique are in Guan and
Waliser38. Figure 6 shows one of the strongest detected ARs passing New Zealand.
AR frequency and AR impacts on rainfall. The AR frequency was calculated as the average number of
days per year that an AR was detected for each grid cell. The calculation was based on the shape of detected ARs.
For example, at least one of the four reanalysis time steps per day meeting the AR detection criteria for it to be
counted as an AR day21. Seasonal AR frequency is expressed as the anomalies from the mean seasonal AR days.
The coefficients of variation (CV) for annual and seasonal AR days were calculated to evaluate the interannual
variation of AR frequency. The mean monthly percentage of landfalling AR occurrence was computed as the
mean of the number of landfalling ARs detected for that month over each year within the period of each dataset.
Consider a given station with daily rainfall records (measured at 2000 UTC or 2100 UTC) on 15 June 2000.
To determine if the rainfall should be associated with an AR, the first step is to search for AR conditions (based
on AR shape) at the four grid points that enclosed the station site between 2000 UTC (2100 UTC) 14 June 2000
and 2000 UTC (2100 UTC) 15 June 2000. If any of the four ERA-interim time steps that AR conditions (based on
AR shape) were found in the 4 grid points, the daily rainfall (> 0 mm) recorded between this period is considered
Scientific Reports | (2021) 11:5869 | https://doi.org/10.1038/s41598-021-85297-0 8
Vol:.(1234567890)www.nature.com/scientificreports/
Figure 5. A map of New Zealand showing the location of 654 rain gauges.
Figure 6. An example of detected AR by the detection algorithm at UTC 2010-12-27 18:00:00. The outputs of
the algorithm include the shape boundary (yellow), axis (red), landfall location (white). Colour shading area
and vectors refer to the AR IVT magnitude (kg m −1 s−1) and direction, respectively. This case was one of the
strongest ARs between 1979 and 2018. The landfall location is at (174°E, 40.625°S) with the IVT magnitude
of 2176 kg m−1 s−1 and 145° direction. The mean AR IVT magnitude and direction is 397 kg m −1 s−1 and 123°,
respectively. The length and width is 13,236 km and 1216 km, respectively.
to be AR-generated rainfall, and that day herein considered as a wet AR day. Unlike previous studies that any of
the four grid points that AR conditions were present21 and rainfall in the next day17,21,50 (e.g., here the 16 June
2000, if any) considered as AR-precipitation event, only AR conditions presented at 4 grid points and rainfall
occurred in the same day were considered as AR-generated rainfall in the present study.
Due to positive skewness in the daily rainfall data (not shown), daily rainfall intensity under AR and non-AR
conditions were compared by the median daily r ainfall21 (calculated separately for days with and without AR
conditions at each station, and the ratio was subsequently obtained). Further, the fraction of annual and seasonal
highest 10% rainfall events that are attributed to ARs were also investigated.
Scientific Reports | (2021) 11:5869 | https://doi.org/10.1038/s41598-021-85297-0 9
Vol.:(0123456789)www.nature.com/scientificreports/
Data availability
Data used in this study were obtained freely online: ERA-Interim: https://apps.ecmwf.int/datasets/data/interim-
full-daily. ERA-5: https://cds.climate.copernicus.eu/cdsapp#!/dataset/reanalysis-era5-pressure-levels?tab=overv
iew. CFSR: https://rda.ucar.edu/. MERRA-2: https://gmao.gsfc.nasa.gov/reanalysis/MERRA-2/. Daily rainfall:
https://cliflo.niwa.co.nz/.
Code availability
The Python code and Excel VBA code used to compute AR frequency and quantify AR impacts on rainfall are
available from the corresponding author upon request.
Received: 17 December 2020; Accepted: 26 February 2021
References
1. Ralph, F. M., Dettinger, M. D., Cairns, M. M., Galarneau, T. J. & Eylander, J. Defining, “atmospheric river”: How the glossary of
meteorology helped resolve a debate. Bull. Am. Meteorol. Soc. 99, 837–839 (2018).
2. Newell, R. E., Newell, N. E., Zhu, Y. & Scott, C. Tropospheric rivers? A pilot study. Geophys. Res. Lett. 19, 2401–2404 (1992).
3. Newell, R. E. & Zhu, Y. Tropospheric rivers: A one-year record and a possible application to ice core data. Geophys. Res. Lett. 21,
113–116 (1994).
4. Zhu, Y. & Newell, R. E. Atmospheric rivers and bombs. Geophys. Res. Lett. 21, 1999–2002 (1994).
5. Zhu, Y. & Newell, R. E. A proposed algorithm for moisture fluxes from atmospheric rivers. Mon. Weather Rev. 126, 725–735 (1998).
6. Ralph, F. M., Neiman, P. J. & Wick, G. A. Satellite and CALJET Aircraft Observations of Atmospheric Rivers over the Eastern North
Pacific Ocean during the Winter of 1997/98. Mon. Weather Rev. 132, 1721–1745 (2004).
7. Ralph, F. M., Neiman, P. J. & Rotunno, R. Dropsonde Observations in Low-level jets over the northeastern pacific ocean from
CALJET-1998 and PACJET-2001: Mean vertical-profile and atmospheric-river characteristics. Mon. Weather Rev. 133, 889–910
(2005).
8. Stewart, R. E., Szeto, K. K., Reinking, R. F., Clough, S. A. & Ballard, S. P. Midlatitude cyclonic cloud systems and their features
affecting large scales and climate. Rev. Geophys. 36, 245–273 (1998).
9. Catto, J. L., Jakob, C., Berry, G. & Nicholls, N. Relating global precipitation to atmospheric fronts. Geophys. Res. Lett. 39, 1–10
(2012).
10. Catto, J. L. & Pfahl, S. The importance of fronts for extreme precipitation. J. Geophys. Res. Atmos. 118, 10791–10801 (2013).
11. Ralph, F. M., Cordeira, J. M., Neiman, P. J. & Hughes, M. Landfalling atmospheric rivers, the sierra barrier jet, and extreme daily
precipitation in Northern California’s upper sacramento river watershed. J. Hydrometeorol. 17, 1905–1914 (2016).
12. Ramos, A. M., Trigo, R. M., Liberato, M. L. R. & Tomé, R. Daily precipitation extreme events in the iberian peninsula and its
association with atmospheric rivers*. J. Hydrometeorol. 16, 579–597 (2015).
13. Lamjiri, M. A., Dettinger, M. D., Ralph, F. M. & Guan, B. Hourly storm characteristics along the U.S. West Coast: Role of atmos-
pheric rivers in extreme precipitation. Geophys. Res. Lett. 44, 7020–7028 (2017).
14. Gimeno, L. et al. Major mechanisms of atmospheric moisture transport and their role in extreme precipitation events. Annu. Rev.
Environ. Resour. 41, 117–141 (2016).
15. Waliser, D. & Guan, B. Extreme winds and precipitation during landfall of atmospheric rivers. Nat. Geosci. 10, 179–183 (2017).
16. Paltan, H. et al. Global floods and water availability driven by atmospheric rivers. Geophys. Res. Lett. 44, 10387–10395 (2017).
17. Dettinger, M. D., Ralph, F. M., Das, T., Neiman, P. J. & Cayan, D. R. Atmospheric rivers, floods and the water resources of California.
Water 3, 445–478 (2011).
18. Rutz, J. J. & Steenburgh, W. J. Quantifying the role of atmospheric rivers in the interior western United States. Atmos. Sci. Lett. 13,
257–261 (2012).
19. Tait, A. B. & Fitzharris, B. B. Relationships between New Zealand rainfall and south-west Pacific pressure patterns. Int. J. Climatol.
18, 407–424 (1998).
20. Lavers, D. A. & Villarini, G. The contribution of atmospheric rivers to precipitation in Europe and the United States. J. Hydrol.
522, 382–390 (2015).
21. Viale, M., Valenzuela, R., Garreaud, R. D. & Ralph, F. M. Impacts of atmospheric rivers on precipitation in Southern South America.
J. Hydrometeorol. 19, 1671–1687 (2018).
22. Blamey, R. C., Ramos, A. M., Trigo, R. M., Tomé, R. & Reason, C. J. C. The influence of atmospheric rivers over the South Atlantic
on winter rainfall in South Africa. J. Hydrometeorol. 19, 127–142 (2018).
23. Neiman, P. J., Ralph, F. M., Wick, G. A., Lundquist, J. D. & Dettinger, M. D. Meteorological characteristics and overland precipita-
tion impacts of atmospheric rivers affecting the West Coast of North America based on eight years of SSM/I satellite observations.
J. Hydrometeorol. 9, 22–47 (2008).
24. Lavers, D. A. & Villarini, G. The nexus between atmospheric rivers and extreme precipitation across Europe. Geophys. Res. Lett.
40, 3259–3264 (2013).
25. Nayak, M. A. & Villarini, G. A long-term perspective of the hydroclimatological impacts of atmospheric rivers over the central
United States. Water Resour. Res. 53, 1144–1166 (2017).
26. Salinger, M. J. New Zealand climate: I. Precipitation pattern. Mon. Weather Rev. 108, 1892–1904 (1980).
27. Wratt, D. S. et al. The New Zealand southern alps experiment. Bull. Am. Meteorol. Soc. 77, 683–692 (1996).
28. Kerr, T., Owens, I. & Henderson, R. The precipitation distribution in the Lake Pukaki catchment. J. Hydrol. N. Zeal. 50, 361–382
(2011).
29. Purdy, J. C. & Austin, G. L. The role of synoptic cloud in orographic rainfall in the Southern Alps of New Zealand. Meteorol. Appl.
10, 355–365 (2003).
30. Henderson, R. D. & Thompson, S. M. Extreme rainfalls in the Southern Alps of New Zealand. J. Hydrol. 38, 309–330 (1999).
31. Chappell, P. R. The Climate and Weather of Auckland. (2013). https://niwa.co.nz/static/AucklandClimateWEB.pdf.
32. Dravitzki, S. & McGregor, J. Extreme precipitation of the Waikato region, New Zealand. Int. J. Climatol. 31, 1803–1812 (2011).
33. Trenberth, K. E. Storm tracks in the Southern Hemisphere. J. Atmos. Sci. 48, 2159–2178 (1991).
34. Numaguti, A. Dynamics and energy balance of the Hadley circulation and the tropical precipitation zones: Significance of the
distribution of evaporation. J. Atmos. Sci. 50, 1874–1887 (1993).
35. Salinger, M. J. & Griffiths, G. M. Trends in New Zealand daily temperature and rainfall extremes. Int. J. Climatol. 21, 1437–1452
(2001).
36. Holton, J. R. & Staley, D. O. An introduction to dynamic meteorology. Am. J. Phys. 41, 752–754 (1973).
37. Watts, I. E. M. The relations of New Zealand weather and climate: An analysis of the westerlies. N. Z. Geog. 3, 115–129 (1947).
38. Guan, B. & Waliser, D. E. Detection of atmospheric rivers: Evaluation and application of an algorithm for global studies. J. Geophys.
Res. Atmos. 120, 12514–12535 (2015).
Scientific Reports | (2021) 11:5869 | https://doi.org/10.1038/s41598-021-85297-0 10
Vol:.(1234567890)www.nature.com/scientificreports/
39. Espinoza, V., Waliser, D. E., Guan, B., Lavers, D. A. & Ralph, F. M. Global Analysis of climate change projection effects on atmos-
pheric rivers. Geophys. Res. Lett. 45, 4299–4308 (2018).
40. Griffiths, A. Drivers of extreme daily rainfalls in New Zealand. Weather Clim. 31, 24 (2011).
41. Jiang, N., Griffiths, G. & Lorrey, A. Influence of large-scale climate modes on daily synoptic weather types over New Zealand. Int.
J. Climatol. 33, 499–519 (2013).
42. Scarsbrook, M. & Pearson, C. Water supply, floods and droughts: Te Ara Encyclopedia of New Zealand. (2008). https://teara.govt.
nz/en/water-resources/page-1.
43. NIWA. Preparing for future flooding : a guide for local government in New Zealand. (2010).
44. Clark, A., Mullan, B., Porteous, A. & Clark, A. Scenarios of Regional Drought under Climate Change Prepared for Ministry of Agri-
culture and Forestry. (2011).
45. Dee, D. P. et al. The ERA-Interim reanalysis: Configuration and performance of the data assimilation system. Q. J. R. Meteorol.
Soc. 137, 553–597 (2011).
46. Hersbach, H. The ERA5 Atmospheric Reanalysis. AGUFM 2016, NG33D-01 (2016).
47. Saha, S. et al. The NCEP climate forecast system version 2. J. Clim. 27, 2185–2208 (2014).
48. Gelaro, R. et al. The modern-era retrospective analysis for research and applications, version 2 (MERRA-2). J. Clim. 30, 5419–5454
(2017).
49. Lavers, D. A., Villarini, G., Allan, R. P., Wood, E. F. & Wade, A. J. The detection of atmospheric rivers in atmospheric reanalyses
and their links to British winter floods and the large-scale climatic circulation. J. Geophys. Res. Atmos. 117, 1–13 (2012).
50. Rutz, J. J., Steenburgh, W. J. & Ralph, F. M. climatological characteristics of atmospheric rivers and their inland penetration over
the Western United States. Mon. Weather Rev. 142, 905–921 (2014).
Acknowledgements
The authors thank the National Institute of Water and Atmosphere Research (NIWA) for providing access to the
New Zealand meteorological data from the National Climate Database, thank the European Centre for Medium-
Range Weather Forecasts (ECMWF) for providing access to the ERA-interim and ERA-5 datasets, thank the
National Aeronautics and Space Administration (NASA) providing access to the Modern-Era Retrospective
analysis for Research and Applications, Version 2 (MEAAR-2) dataset, and thank the National Center for Atmos-
pheric Research (NCAR) providing access to the Climate Forecast System Reanalysis (CFSR) dataset. The AR
data and the AR detection code were provided by Bin Guan via https: //ucla.box.com/ARcata log. Development of
the AR detection algorithm and databases was supported by NASA. The authors would also like to acknowledge
the constructive comments from all reviewers to improve this paper.
Author contributions
J.S. contributed all of the data analysis, results and figures interpretation, and the manuscript text and supple-
mentary document writing. A.Y.S. and E.W. contributed the concept for the study, provided guidance on analysis,
interpretation of results and figures results, and manuscript revision.
Competing interests
The authors declare no competing interests.
Additional information
Supplementary Information The online version contains supplementary material available at https://doi.
org/10.1038/s41598-021-85297-0.
Correspondence and requests for materials should be addressed to J.S.
Reprints and permissions information is available at www.nature.com/reprints.
Publisher’s note Springer Nature remains neutral with regard to jurisdictional claims in published maps and
institutional affiliations.
Open Access This article is licensed under a Creative Commons Attribution 4.0 International
License, which permits use, sharing, adaptation, distribution and reproduction in any medium or
format, as long as you give appropriate credit to the original author(s) and the source, provide a link to the
Creative Commons licence, and indicate if changes were made. The images or other third party material in this
article are included in the article’s Creative Commons licence, unless indicated otherwise in a credit line to the
material. If material is not included in the article’s Creative Commons licence and your intended use is not
permitted by statutory regulation or exceeds the permitted use, you will need to obtain permission directly from
the copyright holder. To view a copy of this licence, visit http://creativecommons.org/licenses/by/4.0/.
© The Author(s) 2021
Scientific Reports | (2021) 11:5869 | https://doi.org/10.1038/s41598-021-85297-0 11
Vol.:(0123456789)You can also read