Retrofitting Rural Dwellings in Delta Region to Enhance Climate Change Mitigation in Egypt
←
→
Page content transcription
If your browser does not render page correctly, please read the page content below
Environmental and Climate Technologies
2021, vol. 25, no. 1, pp. 136–150
https://doi.org/10.2478/rtuect-2021-0009
https://content.sciendo.com

        Retrofitting Rural Dwellings in Delta Region
      to Enhance Climate Change Mitigation in Egypt
                                                  Ahmed ABOUAIANA*

    Department of Planning, Design, and Technology of Architecture, La Sapienza University of Rome,
                                    via Flaminia 00169, Rome, Italy

     Abstract – The current rural dwelling pattern in the Delta in Egypt consumes much energy to
     achieve dwellers' thermal comfort, increasing greenhouse gas emissions contributing to
     climate change threatening the region's coastal parts. Therefore, this study highlights the
     potential of retrofitting the existing rural house utilizing pervasive construction technologies
     in diminishing energy consumption and carbon dioxide emissions as a climate change
     mitigation strategy. The current modern rural house and the construction typologies were
     characterized. This study selected a typical modern rural dwelling located in Al-Gharbia
     Governorate in the Delta region. The suggested retrofitting strategies were applied to the
     external building envelope. The impact on the annual energy consumption of cooling and
     heating loads was evaluated using an Energy Performance Assessment Tool (Design Builder).
     An optimal envelope configuration was suggested, then an economic assessment and an
     investigation to the local acceptance were provided. The results showed that using the
     commonly used construction techniques as a retrofitting strategy can plummet the energy
     consumption and CO2 emissions by one-third worthy of mentioning that the locals have
     shown a lack of interest in the investment in retrofitting their buildings as well as the economic
     model showed that the investment is not profitable. Further studies can be made by the author
     considering investigating different building typologies and engaging other stakeholders.

     Keywords – Economic analysis; energy efficiency; energy simulation tools; modern rural
     house; passive envelope; social acceptance

1. INTRODUCTION
  The rural Egyptian village is being reformed due to socio-economic and political aspects,
which produced modern rural dwelling pattern with new walls and roofing configuration
layers instead of the traditional ones [1]–[5]. These new-fangled building envelopes play a
vital role in transferring the thermal load to/from inner spaces, which led to high annual
energy consumption due to using cooling and heating systems such as fans and air
conditioners to fulfil thermal comfort inside indoor spaces. Consequently, it increases
greenhouse gas emissions contributing to climate change.
  Globally, climate change has many indirect negative impacts at many levels, such as
migration waves, crop productivity reduction, water sensitivity, increases in malnutrition and
unemployment rates, and such ecological systems [6]–[10]. In Egypt, it is threatening the
Delta region because its coastal areas are the most vulnerable in the world due to sea-level
rise [11], and its area of land is declining rapidly [12]. However, Egypt contributes less than

* Corresponding author.
E-mail address: ahmed.abouaiana@uniroma1.it
©2021 Ahmed Abouaiana.
This is an open access article licensed under the Creative Commons Attribution License (http://creativecommons.org/   136
licenses/by/4.0).
Environmental and Climate Technologies
____________________________________________________________________________ 2021 / 25
0.7 % of the total global carbon dioxide (CO2) emissions [13]. It is the uppermost density
region and the only agricultural region in Egypt.
Regarding the existing physical planning regions, Egypt has seven regional units, and each
one consists of three levels, Governorates, District, and Villages and Satellites.
The Delta one of these regions that consist of five governorates, 106 districts and cities,
and 1404 villages [14], with a total area of 12357.4 km2 (2.94) million ‘feddans†‘
representing about 1.22 % of the total area of Egypt. It has about 16.5 million inhabitants
consists of (66 % rural and 34 % urban), representing 21 % of Egypt's total population. The
total number of residential buildings is about 3.17 million buildings, represent 94 % of entire
buildings. The average annual electricity consumption per inhabitant in Egypt is
2020 kWh [15]. Table 1 shows residential buildings by type and by (urban/rural) of the Delta
region.
TABLE 1. BUILDINGS DISTRIBUTION BY (TYPE) & (RURAL/URBAN) IN DELTA REGION [16]
Total Buildings Residential buildings by type
House/ Apartment Skyrise Villa Chalet Country House
Rural 2 488 366 1 808 810 0 3924 860 212 085
Urban 678 756 1 017 226 250 4241 4374 15 279
Generally, energy consumption goes hand in hand with CO2 emissions in a positive
correlation [17] and [18], as well as energy consumption contains a nearly similar part of CO2
emissions [19]. Reference [20] defined mitigation as ‘a human intervention to reduce the
sources or enhance the sinks of greenhouse gases.’ In this realm, the buildings sector has an
essential role in mitigating climate change impact [21]. In this context, passive improvements
of the building envelope are considered essential strategies to enhance energy efficiency and
thermal comfort [22] and [23].
Locally, Egypt pays considerable attention to the energy efficiency issue; for instance, it is
one of the prime strategical goals of the 2030 National Sustainable Development Vision [24].
The Egyptian Residential Buildings' Energy Codes (ERBEC) has been established in 2006,
which provides the minimum requirements to improve energy efficiency in existing and new
residential buildings for different climatic zones in Egypt [25]. The local rating system Green
Pyramid Rating System (GPRS) was launched to assess buildings' sustainability, as well as
improving the building envelope is one of its seven parts [26].
Based on these facts and potentials, this study proposes an optimal external envelope design
using the pervasive construction materials and technologies as guidelines to reduce energy
consumption and to mitigate climate change in the existing rural houses in Delta region.
References [1] and [2] determined the prevailing housing typology in the Delta region. It
has been built during the last four decades, surrounded by agricultural areas or urban mass.
The range of footprint area is between 80 and 160 m2; the average floor height is 2.90 meters.
It consists of two or three floors; it consists of a hall, three rooms, a bathroom, a kitchen, a
staircase, a terrace, and, sometimes, a farmyard. Furthermore, the average room area is
14.00 m2. In terms of construction, the roof is constructed of reinforced concrete slab, while
the walls are constructed of red brick 12 and 25 cm, elevation finished by cement plaster. The
average window to wall ratio (WWR) is 11 %. Windows are made of single clear glass 3 mm
with a wooden frame and shading screen.
†
Feddan is unit of area used in Egypt, it equals 4200 m2.
137Environmental and Climate Technologies
____________________________________________________________________________ 2021 / 25
2. METHODOLOGY
The methodology is divided into four phases. Firstly, a set of simulation runs was conducted
for different passive configurations of the wall, roof, and windows using the available
construction materials to investigate their impact on the annual cooling and heating energy
consumption and CO2 emissions. Secondly, an economic assessment for the different design
variables was carried out. Then a comparison between the cost of refurbishment and the
reduction in the consumption for all scenarios. Three retrofitting strategies (minor, optimum,
and significant) were suggested based on the previous steps. A profitability analysis follows
this. Moreover, a structured questionnaire was distributed among the dwellers to examine
their awareness and acceptance of the refurbishing process. Finally, Multi-objective criteria
were identified.
3. ORIGINAL CASE PARAMETERS
A west-oriented room in a typical rural dwelling pattern located in Nawag Village, Gharbiya
Governorates, was selected. Room dimensions are 3.40×4.30 m. The interior room height is
2.90 m.
The external wall area is 11.20 m that consists of (2 cm plaster, 12 cm red brick and
2 cm plaster). The external roof area is 14.60 m that consists of a reinforced concrete slab of
15 cm thickness and 2 cm plaster from outside to inside. While the window makes up a single
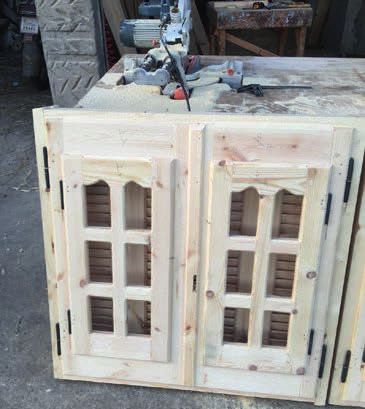
clear 3 mm glass with a wooden frame and a traditional wooden shading screen ‘Sheesh’ and
the WWR is 11 %. The building relies on the air conditioning (split unit) for summer cooling.
Fig. 1 depicts the traditional ‘Sheesh’ during manufacturing.
4. SIMULATION MODEL ALGORITHMS
The above-mentioned parameters were examined using the validated simulation tool,
Design Builder version 4.5, as seen in Fig. 2, these tools also significantly optimize energy
consumption in the design stage [27] and [28]. A climatic weather file data of Delta was
selected. The artificial lighting and the electrical appliances were neglected. The occupancy
density is 0.17 people/m2. The setpoint and the setback degrees of cooling and heating are
25° and 28° C, and 21° and 12° C. The study assumed that air conditioning was used for
winter heating. The inner partitions and floor are considered adiabatic surfaces. The
simulation model is available on reference [29].
Fig. 1. The Traditional ‘Sheesh’.
138Environmental and Climate Technologies
____________________________________________________________________________ 2021 / 25
Fig. 2. The Simulation Model Extracted Room Design Builder.
A set of passive retrofitting variables were proposed and applied on:
− opaque parts: based on different thermal properties R-value of construction materials
and used insulation;
− transparent parts: based on different thermal properties and solar heat gain coefficient
SHGC of glazing types. Table 2 summarizes the suggested design variables.
TABLE 2. THE PROPOSED DESIGN VARIABLES
Design Variables Description
Wall types Redbrick (12×25×38 cm) thickness, and a mud-brick wall 40 cm thickness
Wall insulation Insulated cored red brick 25 cm and (EPS), thickness from 1–10 cm
Window Glazing type Single Clear Glass (3 mm, and 6mm), and double Clear Glass 6 mm with 13 mm Air
WWR 10 %, 20 % and 30 %
Shading Screen Shading screen (SC) used, and without (SC)
Roof type Reinforced concrete (RC) slab 15 cm thickness, and RC slab with cement tiles 5 cm thick
Roof insulation RC slab and cement tiles 5 cm with various foam insulation thicknesses from 1–10 cm
4.1. External Wall Types’ Influence
Firstly, four simulation runs were carried out, one for the base case (red brick 12 cm). The
other three retrofitting alternatives are 25 cm red brick, 38 cm red brick, and 40 cm mud brick,
considering that the roof is an adiabatic surface. Simultaneously, the window consists of a
single clear glass 3 mm, wooden frame and shading screen with WWR 10 % with a U-Value
of 5.894 W/m²K. Table 3 shows the U-Value of different wall section types extracted from
Design Builder.
TABLE 3. THE U-VALUE OF THE DIFFERENT WALL CONSTRUCTION TYPES IN W/M²K
Wall Construction layers from outer to inner U-Value
0.02 m cement plaster + 0.12 m red brick +0.02 m cement plaster (Base Case) 2.545
0.02 m cement plaster + 0.25 m red brick +0.02 m cement plaster 1.826
0.02 m cement plaster + 0.38 m red brick +0.02 m cement plaster 1.424
Mud-brick wall 40 cm 0.665
The base case results have recorded 319 kWh of energy consumption and 193 CO2
emissions. While altering the wall type to red brick (25 cm and 38 cm) decreased the energy
consumption and the emissions by 16 % and 27 %, respectively, compared to the base case,
utilizing a mud-brick wall reduced the consumption and emissions significantly by 44 %.
139Environmental and Climate Technologies
____________________________________________________________________________ 2021 / 25
Fig. 3 illustrates the simulation results of the annual electricity consumption and CO 2
emissions of different wall types due to cooling and heating loads.
Annual Electricty Consumption and CO2 Emissions of
The Diffrent Wall Types
Electricity Consumption, kWh
350 250
300
CO2 Emissions, kg
200
250
200 150
150 100
100
50
50
0 0
RedBrick RedBrick RedBrick MudBrick
12 cm 25 cm 36 cm 40 cm
Electricty Consumption CO2
COEmissions
2 Emissions
Fig. 3. Annual Electricity Consumption and CO2 Emissions for Wall Section Pre and Post Retrofitting.
4.2. Walls' Insulation Thicknesses Influence
Secondly, to evaluate the impact of the different insulation thicknesses as retrofitting
solutions, different wall section types on the annual electricity and CO2 emissions of cooling
and heating loads. A set of ten simulation runs took place. The cases consist of a cored red
brick wall of 25 cm with a variable EPS insulation 1 to 10 cm. The roof is an adiabatic surface,
while the window consists of a single clear glass 3 mm, wooden frame, and shading screen
with WWR 10 % with a U-Value of 5.894 W/m²K for wall section before and after
retrofitting. Table 4 shows the U-Value of the interventions.
TABLE 4. THE U-VALUE OF THE DIFFERENT WALL INSULATION THICKNESSES IN W/M²K)
Base EPS insulation thickness (added to cored red brick wall 25 cm)
case
1 cm 2 cm 3 cm 4 cm 5 cm 6 cm 7 cm 8 cm 9 cm 10 cm
2.545 1.273 0.966 0.778 0.651 0.560 0.491 0.437 0.394 0.359 0.329
The results showed that adding a layer of 1 cm EPS to the cored 25-cm red brick reduced
one-third of consumption and emissions compared to the base case, by adding layers of 2, 3,
and 4 cm EPS decreased more 12 %, 9 %, and 7 % respectively. While adding (5 and 6) cm
of the EPS decreased another 5 % and 4 %. It is evident that with every additional 1 cm
insulation, the consumption rate decreases gradually to reach almost the same results. Thus,
a layer of 5 cm insulation can be considered as the optimal thickness. Fig. 4 shows the total
annual energy consumption and CO2 emissions of the wall sections pre- and post-retrofitting
using different insulation thicknesses.
140Environmental and Climate Technologies
____________________________________________________________________________ 2021 / 25
Annual Electricty Consumption and CO2 Emissions
Electricity Consumption, kWh
400 250
CO2 Emissions, kg
300 200
150
200
100
100 50
0 0
Base 1 cm 2 cm 3 cm 4 cm 5 cm 6 cm 7 cm 8 cm 9 cm 10 cm
Case
Electricty Consumption CO2Emissions
CO2 Emissions
Fig. 4. Total Electricity Consumption and CO2 Emissions Results for Wall Construction Layers Simulation Runs.
4.3. Roof Insulation Influence
Thirdly, in order to evaluate the impact of the roof on the energy consumption and CO 2
emissions. The simulation examined a set of twelve roof scenarios; the first is the base case
before retrofitting, consisting of (2 cm cement plaster and 15 cm reinforcement concrete slab).
In the second, two layers of 5 cm cement tiles and 5 cm mortar were added, while in the other
ten solutions, layers of foam insulation with varies thicknesses from 1 cm to 10 cm. Table 5
shows the U-Value of all scenarios pre and post retrofitting.
TABLE 5. ROOF INSULATION THERMAL PROPERTIES (U-VALUE IN W/M²K)
EPS insulation line thickness
Base case 0.909 5 cm 0.407
N/A 0.828 6 cm 0.369
1 cm 0.628 7 cm 0.338
2 cm 0.586 8 cm 0.312
3 cm 0.511 9 cm 0.289
4 cm 0.453 10 cm 0.270
The results showed that adding cement flooring tiles on a cement mortar to the
reinforcement concrete slab reduced only 3 % compared to the base case. Moreover, adding
1, 2, and 3 cm of foam reduced more 12 %, 10 %, 9 %, respectively, while by adding 4 cm,
the consumption dropped by 13 % compared to the previous values. It is evident that with
every additional 1 cm insulation, the consumption rate reduces progressively to reach nearly
results. Therefore, a layer of 4 cm insulation can be considered as the optimal thickness. Fig. 5
illustrates the total annual energy consumption and CO2 emissions of the roof sections before
and after retrofitting using cement flooring tiles with insulation and without.
141Environmental and Climate Technologies
____________________________________________________________________________ 2021 / 25
Annual Electricty Consumption and CO2 Emissions
200 120
Electricity Consumption, kWh
CO2 Emissions, kg
100
150
80
100 60
40
50
20
0 0
Electricty Consumption CO2
COEmissions
2 Emissions
Fig. 5. Total Electricity Consumption and CO2 emissions for Roof Construction Layers Simulation Runs.
4.4. Fenestration Influence
Three simulation runs were carried out to assess the impact of different glazing types on
the annual electricity and CO2 emissions of cooling and heating loads. The first is for the
window, using a single clear glass 3 mm thickness with a wooden frame and without a shading
screen; the others are single clear glass 6 mm thickness, and double clear glass 6 mm with
13 mm air in-between. Considering the roof is an adiabatic surface, WWR 10 %, and the wall
section is 12 cm red brick. Table 6 shows the U-Value and the Solar Heat Gain coefficient
(SHGC) of the different glazing types.
TABLE 6. ROOF INSULATION THERMAL PROPERTIES (U-VALUE IN W/M²K)
3 mm Single clear glass 6 mm Single clear glass 6 mm Double clear glass / 13 mm Air
SHGC 0.861 0.819 0.703
U-Value 5.894 5.778 2.665
The single clear glass 3 mm achieved the highest consumption and CO2 emissions by
393 kWh and 238 kg. By using the single clear 6 mm glass has no impact on both energy
consumption and emissions. While using 6 mm double clear glass with 13 mm air, reduced
energy and emissions by 14 %.
In contemplation of assessing the impact of different WWR 10 %, 20 %, and 30 %, one
using a local shading screen ‘sheesh’ and the other without shading screen on the annual
electricity consumption CO2 emissions. A set of six simulation runs were implemented.
Considering the roof is an adiabatic surface, the wall section is 12 cm red brick, and the
glazing type is 3 mm single clear glass.
To assess WWR 10 %'s impact on the electricity consumption and CO2 emissions, the base
case with shading screen recorded 393 kWh and 238 kg. While adding the shading screen
decreased 19 % of the energy consumption and the CO2 emissions.
By altering WWR to 20 %, the energy consumption and CO2 emissions recorded 522 kWh
and 316 kg, respectively, with an increase of 25 % in energy consumption and CO2 emissions
than the same circumstances of WWR 10 %. Meanwhile, by adding a shading screen to WWR
20 %, the energy consumption and CO2 emissions dropped by 34 %.
Eventually, by changing WWR to 30 %, the energy consumption and CO2 emissions
recorded the highest results by 661 kWh and 401 kg, respectively, with an increase of 41 %
142Environmental and Climate Technologies
____________________________________________________________________________ 2021 / 25
in energy consumption and CO2 emissions in the same circumstances of the WWR 10 %.
While adding shading screen to WWR 30 % reduced the energy consumption and CO2
emissions by 44 %. Fig. 6 summarizes the results of the six simulation runs of different WWR
and shading screen strategies.
Annual Electricty Consumption and CO2 Emissions
700 450
600 400
CO2 Emissions, kg
Electricity Consumption, kWh
500 350
300
400 250
300 200
200 150
100
100 50
0 0
Electricty Consumption COEmissions
CO2 2 Emissions
Fig. 6. Total Electricity Consumption and CO2 emissions for the Different WWR and Shading Screens Scenarios.
4.5. Discussion of Simulation Results
A group of design variables for building envelope was investigated separately. In order to
optimize the building envelope, a suggested retrofitting solution is recommended that can
decrease the annual energy consumption and CO2 emissions efficiently.
Firstly, for the wall section, altering the original wall to 25 cm red brick reduced annual
CO2 emissions and energy consumption by 16 %; it is considered a minor renovation. While
adding an insulation layer of the EPS 5 cm to the cored wall decreased the consumption by
one-half. The higher insulation values decreased energy almost likely; thus, it is considered
the optimum thickness. Finally, the maximum reduction was achieved (136 kWh) using a
layer of EPS 10, which beheld the major renovation.
Likewise, adding cement flooring tiles and mortar to the original roof configurations
reduced the energy by 4 % for the roof. Withal adding a layer of 5 cm foam thickness lessened
the consumption by 38 %, the higher insulation values almost likely decreased, so it beheld
the optimal strategy ‡. In contrast, the uppermost reduction attained by utilizing 10 cm foam
by 78 kWh, which is considered the major one.
Finally, the original window configuration (3 mm single clear glass, WWR 10 %, and
Shading Screen) recorded the lowest energy consumption results, so it is considered the
optimal configuration in all scenarios.
In the final analysis, four simulation runs were conducted, one for the base case's entire
envelope and the others for the recommended (minor, optimal, and significant) refurbishment
scenarios. The base case results recorded 442 kWh energy consumption and 268 kg CO2.
Table 7. summarizes the energy and CO2 consumptions of the proposed bare and optimum
wall and roof layers configurations.
‡
Another factor supports applying 5 cm thickness of the insulation materials to the wall and the roof. The majority of the
local suppliers provide it as a typical insulation solution, regardless of the essential needs and technical studies.
143Environmental and Climate Technologies
____________________________________________________________________________ 2021 / 25
TABLE 7. ENERGY CONSUMPTION AND CO2 EMISSIONS PRE AND POST ENVELOPE RETROFITTING
Different Design Variables of the Envelope Different Retrofitting Saving compared to the
Scenarios Consumption Base Case
Wall Window Roof Energy CO2 Energy CO2
Base Case
3 mm Sgl Clr +
Red brick 12 cm RC + Cement Tiles 442 kWh 268 kg N/A N/A
SC+WWR10 %
Scenario 1
3 mm Sgl Clr +
Red brick 25 cm RC + Cement Tiles 318 kWh 192 kg 28 % 28 %
SC+WWR10 %
Scenario 2
Cored red brick 25 cm 3 mm Sgl Clr + RC+ Cement Tiles +
206 kWh 125 kg 34 % 34 %
+ EPS 5 cm SC+WWR10 % 5 cm Foam
Scenario 3
Cored red brick 25 cm 3 mm Sgl Clr + RC+ Cement Tiles +
170 kWh 103 kg 40 % 40 %
+ EPS 10 cm SC+WWR10 % 10 cm Foam
5. ECONOMIC ASSESSMENT
Regarding the local market and reference [30], the conventional envelope's
supply-and-apply price for the wall and roof was identified. Firstly, for the wall, the cost of
red bricks (0.25×0.12×0.06 m), the 1000 red brick costs about 2000 Egyptian Pounds (EGP),
the 1000 brick gives 17 m2. Thus, the meter square costs about 120 EGP and 90 EGP for two
layers of 2cm cement plaster thicknesses, so the meter square costs around 210 EGP.
While estimating the cost of retrofitting solution of 5 cm EPS insulation layer; the meter
cubic costs around 1550 EGP, which gives twenty slices of 5cm-thick sheets, so the meter
square costs 75 EGP. To conclude, the entire retrofitted wall consists of a cored wall with
5 cm EPS in-between costs about 495 EGP. The differentiation between the cost of the wall
before and after retrofitting is 285 EGP.
Secondly, the cost of 1 m2 wooden window thickness 2.54 cm (1 inch) is 1750 EGP as seen
in Fig. 1, the price includes glass, accessories, and the painting.
Thirdly, the cubic meter of reinforcement concrete (RC) slab costs about 3500 EGP. The
slab thickness equals 0.15 m, and the entire roof's room area is 14.6 m2, which equals 2.2 m3
of a reinforced concrete slab. To estimate the price of the retrofitted roof, adding 5 cm
concrete tiles on a 5 cm mortar costs 100 EGP, in addition to 85 EGP for 5 cm foam; thus,
the differentiation between the original roof and the retrofitted solution is 185 EGP.
Fourthly, the cost of electricity consumption reduction based on the electricity price was
determined. The tariff of 1 kWh in Egypt varies from 0.38 to 1.40 EGP based on the seven
consumption segments, for instance, the cost of the kWh costs 0.48 EGP in the third segment,
which ranges between 0 and 200 kWh monthly. The base case's real monthly consumption is
collected from the owner's electricity bills, and it is between 201 and 350 kWh – the fourth
segment. Table 8 summarises the cost of the suggested retrofitting variables.
Table 8 shows the price of annual savings due to different retrofitting scenarios. The cost
variation between retrofitting scenarios (1, 2, and 3) and the base case are 1320, 2157, and
3094 EGP, respectively, which is considered the cash of investment. In parallel, the cost of
the annual saving in energy for these scenarios compared to the base case's consumption are
124, 236, and 272 kWh, as seen in Table 9, which costs 122, 231, and 267 EGP, considering
the consumption segment Tarif 0.98 EGP.
144Environmental and Climate Technologies
____________________________________________________________________________ 2021 / 25
TABLE 8. THE SUPPLY-AND-APPLY PRICE OF THE ENVELOPE BEFORE AND AFTER RETROFITTING
Item Unit Quantity Unit Price, EGP Total, EGP
Base Case
12 cm red brick wall m2 10 210 2100
RC Slab + 2 cm cement plaster m 3
2.2 3500 7700
Windows Sgl Clr 3 mm + SC (WWR 10 %) m2 1.20 1700 2040
TOTAL 11 840
Scenario 1
25 cm red brick Wall + EPS 5 cm m2 10 320 3200
Roof + Tiles m 3
2.2 3600 7920
Windows Sgl Clr 3 mm + SC (WWR 10 %) m2 1.20 1700 2040
TOTAL 13 160
Scenario 2
Wall+ EPS 5 cm m2 10 385 3850
Roof + Cement Tiles+ Foam 5 cm m 3
2.2 3685 8107
Windows Sgl Clr 3 mm + SC (WWR 10 %) m2 1.20 1700 2040
TOTAL 13 997
Scenario 3
25 cm red brick Wall + EPS 10 cm m2 10 460 4600
Roof + Tiles+ Foam 10 cm m3 2.2 3770 8294
Windows Sgl Clr 3 mm + SC (WWR 10 %) m 2
1.20 1700 2040
TOTAL 14 934
Many studies discussed the financial and economic analysis to provide a multicriteria
optimization of the retrofitting process using different techniques and approaches, such as
[31]–[35]. Net Present Value (NPV) model is one of 25 commonly used models in building
energy evaluation [36].
NPV is the present value of anticipated cash inflows associated with the project less the
present value of the project's expected cash outflows, discounted at the appropriate cost of
capital, it is used to assess such a project's profitability §, represented by Eq. (1) [37].
CFt
∑
N
, (1)
t =0 (1 + r )t
where:
CFt the expected net cash flow at time t represents the investment amount in retrofitting
the envelope (annual saving due retrofitting);
N the estimated life of the investment;
r the discount rate (opportunity cost of capital). In this study r equals the annual
interest rate of 0.825 % regarding the Central Bank of Egypt [38].
If the results give a negative value, it means the project is not profitable and vice versa;
positive values mean it is profitable in a particular year. Table 9 summarises the equation
parameters.
§
For example, the value of 1000 EGP now does not equal its value after one year due to several aspects such as inflation,
risk, and interest rate.
145Environmental and Climate Technologies
____________________________________________________________________________ 2021 / 25
TABLE 9. VARIATION'S COST OF RETROFITTING AND THE ANNUAL SAVING OF ELECTRICITY
Scenario Retrofit cost’s Annual saving Consumption Annual saving positive results’
variation compared due to Retrofitting Segment Tarif of due to Retrofitting achieving year of
to the base case the kWh (CFt) NPV
Scenario 1 1320 EGP 124 kWh 0.98 EGP 122 EGP The 29th Year
Scenario 2 2157 EGP 236 kWh 0.98 EGP 231 EGP The 19th Year
Scenario 3 3094 EGP 272 kWh 0.98 EGP 267 EGP The 40th Year
By applying the equation [39] for the first scenario, the initial investment is 1320 EGP, and
the cash flow is 122 EGP; the results showed the profitability would be achieved in the
twenty-ninth year. In the second scenario, the initial investment is 2157 EGP, and the annual
cash flow is 231 EGP; the profitability would be achieved in the nineteenth year. Then, at the
initial cost of 3094 EGP and cash flow, 267 EGP achieved profitability in the fortieth year.
6. DWELLERS INVOLVEMENT
In a similar context, the architect Hassan Fathy in his role model of Al Gourna Village
development in the 1960s, emphasized the importance of engaging locals in retrofitting and
development processes because the inhabitants did not accept these strategies [40]. Many
studies discussed the social acceptance for different related-energy retrofitting technical
solutions in many contexts to measure inhabitants satisfaction [41]–[44] or clients
expectations [45].
To investigate the acceptance of the proposed retrofitting strategies, Lasaifar Al-Balad
village in Kafr El-Shiekh Governorate was selected for many reasons. It represented a typical
village pattern out of 1404 villages in the Delta region. It has the same dwellings typology,
and, finally, the author examines other factors within his Ph.D. thesis.
A sample of 31 inhabitants ** represented 31 families was selected. Personal meetings with
four of them were implemented as a pilot test stage to adapt and ensure the clearness of the
questions. A structured questionnaire (Google Form) [46] was distributed to two private
groups of the village on Facebook. The investigation was implemented in the third week of
January 2021.
The questionnaire was divided into two groups. Firstly, the close-ended, to identify the
sample dwellers characteristics and dwellings typology. Secondly, a mix of closed-ended and
the open-ended part to assess their awareness about the climate change issue, examine the
liaison between houses and thermal comfort in summer and winter, inspect their acceptance
of retrofitting process in terms of the technical and economic perspectives, eventually, an
optional question to examine their point of view.
The results of detecting the sample can be seen in Fig. 7, where the pie charts tell us that
most dwellings are located on the urban mass. The three-story buildings have prevailed by
43%, followed by the two-floor and more than three-floor by 29 % and 18 %, and 10 % has
one floor. 57 % of the buildings are for one extended family. Their units are distributed on
the ground, in-between, and the last floor equally. Most of them with an average area between
70 and 150 m2, while 22 % have a range between 200 and 250 m2. The bulk is relying on
cooling devices in summer; namely, fans and air conditioning by 90 % and 10 %
correspondingly, on the contrary, 76 % do not utilize such device for winter heating while
24 % are using heaters and only 6 % use air conditioning for heating.
**
Regarding the official census 2006 the number of inhabitants is 8589.
146Environmental and Climate Technologies
____________________________________________________________________________ 2021 / 25
The graphs in Fig. 8 tell us that respondents preponderance lacked awareness of climate
change issues by 71 % bar a few linked it is to the agriculture waste and the garbage. In
comparison, 29 % identified climate change. In terms of thermal comfort, one-third feel
comfort in their dwellings, 15 % responded moderately, and one-half expressed a lack of
comfort in summer and winter. It is worth mention that 6 % recognized the relationship
between the unit’s position and thermal comfort, namely moderate on the ground floor and
scorching and cold on the last floor in terms of the exposed roof to climatic conditions.
In connection with technical retrofitting acceptance, the minority responded by the
probability, while 87 % agreed. The acceptance dropped to 48 % in the economic realm, while
one-third declined to invest in retrofitting, and 22 % responded ‘Maybe.’ In the optional
question, two of those who answered ‘Maybe’ highlighted the private sector's importance in
funding this kind of project. Then, they can pay long-term monthly installments instead of
the initial cost. Only one respondent proposed ‘what needed is unifying is elevation’s colours
integrated with the photovoltaic cells and to cover the open sewage canals to reduce their
negative impacts’.
Positioning Unit Area, m2 Floor Location Floor’s Number Building Type
AgricultureEnvironmental and Climate Technologies
____________________________________________________________________________ 2021 / 25
7. CONCLUSIONS
This study investigated the impact of using available construction materials in the building
envelope on the annual operating energy consumption and CO2 emissions of an existing
typical dwelling typology in the Delta region. A set of passive retrofitting strategies were
conducted on a west-oriented room in a typical modern dwelling in the Delta Region using
an energy performance assessment tool, Design Builder.
Three suggested retrofitting strategies were provided and evaluated from technical and
price perspectives. The results have been proven that altering the envelope to another
configuration without insulation, namely (25 cm red brick and adding cement flooring tiles)
lessened energy consumption and CO2 emissions by 28 %. While adding 5 cm of insulation
in the roof and wall reduced 34 %, eventually doubling the insulation layer decreased the
highest amount by 40 %.
The existing window configuration recorded the lowest energy consumption; moreover, the
‘Sheesh’ is considered an energy-efficient solution because consumption's variation between
the WWR 10–20 % and 20–30 % is neglectable. That sheds light on conventional materials'
role in increasing energy efficiency notably.
Regarding the economic analysis, the NPV model proved the investment in the three
refurbishment strategies is unprofitable; however, the second scenario achieved profitability
in the shortest period by 19 years, followed by the first and third scenarios: 29 and 40 years,
respectively. Thus, the second scenario can be considered the most efficient one. What
highlighted the importance of considering is the beyond-technical solutions.
Regarding the on-site investigation, a group of population samples with a different
characteristics responded to an online questionnaire. One-third showed a significant
awareness level towards climate change. The results supported the study’s argument that
existing dwellings patterns in the Delta region do not meet thermal comfort requirements.
The majority agreed to refurbish their buildings from a technical standpoint, vice-versa from
the economic perspective, which reflected a potential of locals’ acceptance to such
development in the Delta region.
Another prospective benefit would be considered based on the low amount of consumed
energy 200–350 kWh monthly, compared to the urban context, namely, harvesting renewable
energy that would drastically reduce energy consumption and CO 2 emissions.
To conclude, the study provided multi-objective optimization criteria, from technical,
financial, and social perspectives based on utilizing pervasive construction materials in the
local market that can provide retrofitting guidelines to existing buildings to mitigate climate
change. The author believes that further optimizing studies to widen the subject would be
beneficial to examine different rural building typologies, including early design stages and
new construction, and involve decision-makers.
REFERENCES
[1] Abouaiana A. A. A. Principles for Existing Rural House Sustainability in Delta Region (With Special Reference to
Energy Efficiency). Master of Science thesis, Cairo University, 2016. https://doi.org/10.13140/RG.2.2.21412.71044
(In Arabic)
[2] Allam A. K., Amer I. A. Rural housing in the Egyptian village. The Anglo Egyptian Bookshop, 2001. (In Arabic)
[3] Mahgoub Y. The Transformation of Rural Settlements and Dwellings in Egypt. 2016.
https://doi.org/10.13140/RG.2.1.4826.1204
[4] Mahgoub Y. The Transformation of Traditional Rural Settlements in Egypt. Presented at the 2nd International Symp.
On Built. Environ. New Millenn. Defin. Princ. Prof. Pract. Amasya, Turkey, 2001.
[5] Elsaid M. A. Planning for sustainable rural development in Egypt. Cairo: Ain Shams University, 2007.
148Environmental and Climate Technologies
____________________________________________________________________________ 2021 / 25
[6] Smith J. B., et al. Egypt’s economic vulnerability to climate change. Climate Research 2014:62:59–70.
https://doi.org/10.3354/cr01257
[7] Abutaleb K. A. A., et al. Climate Change Impacts, Vulnerabilities and Adaption Measures for Egypt’s Nile Delta.
Earth Systems and Environment 2018:2:183–192. https://doi.org/10.1007/s41748-018-0047-9
[8] Aboulnaga M. M., Elwan A. F., Elsharouny M. R. Urban Climate Change Adaptation in Developing Countries.
Springer, 2019. https://doi.org/10.1007/978-3-030-05405-2
[9] Conway D., Hulme M. The impacts of climate variability and future climate change in the Nile Basin on water
resources in Egypt. International Journal of Water Resources Development 1996:12(3):277–296.
https://doi.org/10.1080/07900629650178
[10] Smith J., et al. Potential impacts of climate change on the Egyptian economy. Cairo, 2013.
[11] Masria A., et al. Coastal zone issues: A case study (Egypt). Procedia Engineering 2014:70:1102–1111.
https://doi.org/10.1016/j.proeng.2014.02.122
[12] El-Nahry A. H., Doluschitz R. Climate change and its impacts on the coastal zone of the Nile Delta, Egypt.
Environmental Earth Sciences 2010:59:1497–1506. https://doi.org/10.1007/s12665-009-0135-0
[13] Crippa M., et al. Fossil CO2 and GHG emissions of all world countries. Luxembourg: Publications Office of the
European Union 2019:105:1867–1877. https://doi.org/10.2760/687800
[14] General Authority for Urban Planning. Development Strategy for the Governorates of the Republic: Delta Region
(Dakahlia, Damietta, Kafr El-Shiekh, Monufia and Gharbia). Egypt: GOPP, 2008.
[15] Central Agency for Public Mobilization and Statistics. Annual Bulletin of Electricity and Energy Statistics 2015/2016.
Egypt: CAPMAS, 2017.
[16] Abdelhamid E., Shaker A. N. Egypt Population, Housing, and Establishments Census 2017. Egypt: CAPMAS, 2017.
[17] Arouri M. E. H., et al. Energy consumption, economic growth and CO2 emissions in Middle East and North African
countries. Energy Policy 2012:45:342–349. https://doi.org/10.1016/j.enpol.2012.02.042
[18] Sozer H. Improving energy efficiency through the design of the building envelope. Building Environment
2010:45(12):2581–2593. https://doi.org/10.1016/j.buildenv.2010.05.004
[19] Mardiana A., Riffat S. B. Building Energy Consumption and Carbon dioxide Emissions: Threat to Climate Change.
Journal of Earth Science & Climatic Change 2015:3:1–3. https://doi.org/10.4172/2157-7617.s3-001
[20] Edenhofer O., et al. Climate Change 2014: Mitigation of Climate Change. Contribution of Working Group III to the
Fifth Assessment Report of the Intergovernmental Panel on Climate Change. Cambridge University Press, 2014.
[21] Ürge-Vorsatz D., et al. Mitigating CO2 emissions from energy use in the world’s buildings. Building Research and
Information 2007:35:379–398. https://doi.org/10.1080/09613210701325883
[22] Santamouris M., Asimakopoulos D. Passive cooling of buildings. Earthscan, 1996.
[23] Al-Homoud M. S. The Effectiveness of Thermal Insulation in Different Types of Buildings in Hot Climates. Journal
of Building Physics 2004:27(3):235–247. https://doi.org/10.1177/1097196304038368
[24] El-Megharbel N. Sustainable Development Strategy: Egypt's vision 2030 And Planning Reform. Egypt: Ministry of
Planning, 2015.
[25] HBRC. Egyptian Code for Improving the Efficiency of Energy Use in Buildings, Part 1: Residential Buildings,
ECP306-2005. Arab Republic of Egypt: Ministry of Housing, 2008. (In Arabic)
[26] Ministry of Housing, Utilities and Urban Development. Egyptian Green Pyramid Rating System, For New Buildings
and Major Renovation. Arab Republic of Egypt: MHUC, 2018.
[27] Schlueter A., Geyer P. Linking BIM and Design of Experiments to balance architectural and technical design factors
for energy performance. Automation in Construction 2018:86:33–43. https://doi.org/10.1016/j.autcon.2017.10.021
[28] Faenø T., et al. Building Performance Simulation tools for planning of energy efficiency retrofits. Proceedings of the
10th Nordic Symphosium on Building Physics, 2014.
[29] Abouaiana A. Abouaiana_ECT_2021_Simulation_Model. 2021. https://doi.org/10.13140/RG.2.2.27517.59361
[30] Ministry of Housing, Utilities and Urban Communities. Building Materials Price Bulletin, December 2020. Arab
Republic of Egypt: MHUC, 2020. (in Arabic)
[31] Fan Y., Xia X. A multi-objective optimization model for energy-efficiency building envelope retrofitting plan with
rooftop PV system installation and maintenance. Applied Energy 2017:189:327–335.
https://doi.org/10.1016/j.apenergy.2016.12.077
[32] Verbeeck G., Hens H. Energy savings in retrofitted dwellings: economically viable? Energy and Buildings
2005:37(7):747–754. https://doi.org/10.1016/j.enbuild.2004.10.003
[33] Kaynakli O. A review of the economical and optimum thermal insulation thickness for building applications.
Renewable and Sustainable Energy Reviews 2012:16(1):415–425. https://doi.org/10.1016/j.rser.2011.08.006
[34] Albadry S., Tarabieh K., Sewilam H. Achieving net zero-energy buildings through retrofitting existing residential
buildings using PV panels. Energy Procedia 2017:115:195–204. https://doi.org/10.1016/j.egypro.2017.05.018
[35] Mata É., Kalagasidis A. S., Johnsson F. Cost-effective retrofitting of Swedish residential buildings: effects of energy
price developments and discount rates. Energy Efficiency 2015:8:223–237. https://doi.org/10.1007/s12053-014-9287-1
[36] Remer D. S., Nieto A. P. A compendium and comparison of 25 project evaluation techniques. Part 1: Net present
value and rate of return methods. International Journal of Production Economics 1995:42:79–96.
https://doi.org/10.1016/0925-5273(95)00104-2
149Environmental and Climate Technologies
____________________________________________________________________________ 2021 / 25
[37] Schweser K. Schwesernotes 2019 Level I Cfa® Book 1: Ethical And Professional Standards And Quantitative Methods.
USA: Kaplan Inc., 2018.
[38] Egyptian Central Banks key rates. Interest rates fall in Egypt [Online]. [Accessed 17.01.2021]. Available:
https://countryeconomy.com/key-
rates/egypt#:~:text=Interest%20rates%20fall%20in%20Egypt,or%20a%20possible%20deflationary%20situation
[39] Calculat Stuff. Net Present Value [Online]. [Accessed 17.01.2021]. Available:
https://www.calculatestuff.com/financial/npv-calculator
[40] Fathy H. Architecture of The Poor: Experience in Rural Egypt. Cairo: American University in Cairo, 1989. (In Arabic)
[41] Tzortzopoulos P., et al. Evaluating social housing retrofit options to support clients’ decision making—SIMPLER BIM
protocol. Sustainability 2019:11(9):2507. https://doi.org/10.3390/su11092507
[42] Synnefa A., et al. Transformation through renovation: An energy efficient retrofit of an apartment building in Athens.
Procedia Engineering 2017:180:1003–1014. https://doi.org/10.1016/j.proeng.2017.04.260
[43] Becchio C., Bottero M.C., Corgnati S.P., Dell’Anna F. Evaluating Health Benefits of Urban Energy Retrofitting: An
Application for the City of Turin. In: Bisello A., Vettorato D., Laconte P., Costa S. (eds) Smart and Sustainable
Planning for Cities and Regions. Springer, Cham., 2018. https://doi.org/10.1007/978-3-319-75774-2
[44] Balest J., Vettorato D. Social Acceptance of Energy Retrofit in Social Housing: Beyond the Technological Viewpoint.
Smart and Sustainable Planning for Cities and Regions. Springer International Publishing, 2018.
[45] Larroumet A. Training guide. Social Acceptance Developing dialogue with your stakeholders: Applying social
acceptance tools to avoid barriers in biobased projects, 2018.
[46] The questionnaire [Online]. [Accessed 24.01.2021]. Available:
https://docs.google.com/forms/d/e/1FAIpQLSdOYTUcvkUEJXdMvsmshTWTQrnasvDASZScWlSbh_gV39a7hQ/vi
ewform?fbclid=IwAR0VYabmIl4LX16lbtrRNp7ikIwRsTkRQIQPjsT9jiddelI1OSkh291jMbE
(In Arabic)
150You can also read