CLIMATE CHANGE RELATED REGULATION - The Risks and Opportunities of Climate Change - First State ...
←
→
Page content transcription
If your browser does not render page correctly, please read the page content below
LANGDONWITHERS | SEN0089 ASIA Climate Change Whitepaper 2 P4a            April 28, 2020 10:53 am

            The Risks and Opportunities
            of Climate Change

            CLIMATE CHANGE
            RELATED REGULATION

                                                                 Part 2
                                                                 2019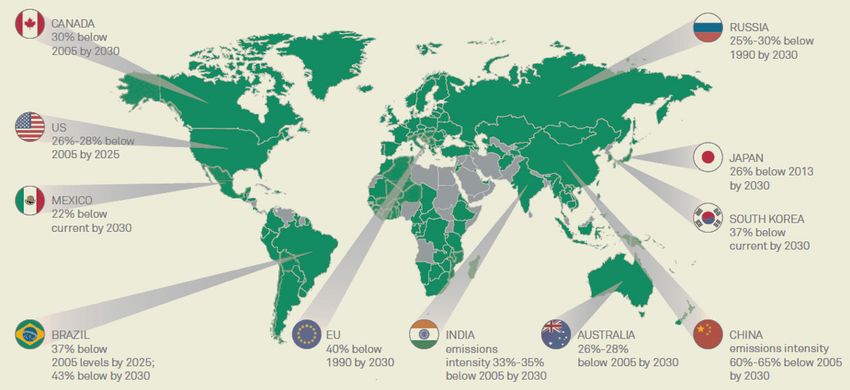
LANGDONWITHERS | SEN0089 ASIA Climate Change Whitepaper 2 P4a                                                                                                 April 28, 2020 10:53 am

            The Risks and Opportunities of Climate Change | Part 2                                                                  Climate Change Related Regulation

            Key Points:                                                                 Chart 1: Total climate change laws and policies
            In response to increasing legislation and policy, major economies have
            started regulating carbon and energy using a variety of approaches. Pg. 2
            Companies are responding to increased climate related regulation by
            introducing measures such as internal carbon pricing. Pg. 4
            Regulatory risks associated with climate change will have differing
            implications for investors depending on factors including investment
            approach, asset class and time horizons. Pg. 5

            Overview
            Following on from our first paper on the physical impacts of climate
            change, part two in our five part series focuses on the regulatory risks
            associated with carbon emissions and related policies like efforts to
            reduce air pollution.
            Legislation and other policy measures to curb emissions are being
                                                                                        Source: Climate Change Laws of the World, Grantham Research
            introduced around the world to curb emissions and have accelerated in       Institute 2017.
            recent years. Since 1997, there has been a 20x increase in the number
            of climate change laws and policies. By the end of 2017, there were over    As part of the agreement, 195 countries have made commitments
            1,200 climate change laws and policies across 140 countries1, at global,    (Intended Nationally Determined Contributions or INDCs) to limit
            national, state, local and sectoral levels.                                 their greenhouse gas emissions and assist developing countries with
                                                                                        the transition to a low carbon economy and to manage the physical
            The Paris Agreement in December 2015 was a significant milestone            impacts of a changing climate.
            as it established clear objectives and a legally binding framework
            for addressing climate change for all countries. The objective of the       The commitments made to date and a five year review framework
            agreement is to hold the increase in the global average temperature to      (designed to increase ambition over time), will drive the increasing
            well below 2°C above pre-industrial levels and to pursue efforts to limit   coverage and scope of climate change regulation to meet individual
            the temperature increase to 1.5°C above pre-industrial levels.              countries’ INDCs. Chart 2 shows countries (in green) who have targets
                                                                                        with examples from key countries.

            Chart 2: Examples of country pledges to reduce emissions after 2020

            Source: BlackRock and Bloomberg New Energy Finance, 2015.

                                                                                        1 Source: CarbonBrief: https://www.carbonbrief.org/mapped-climate-
                                                                                        change-laws-around-world
            2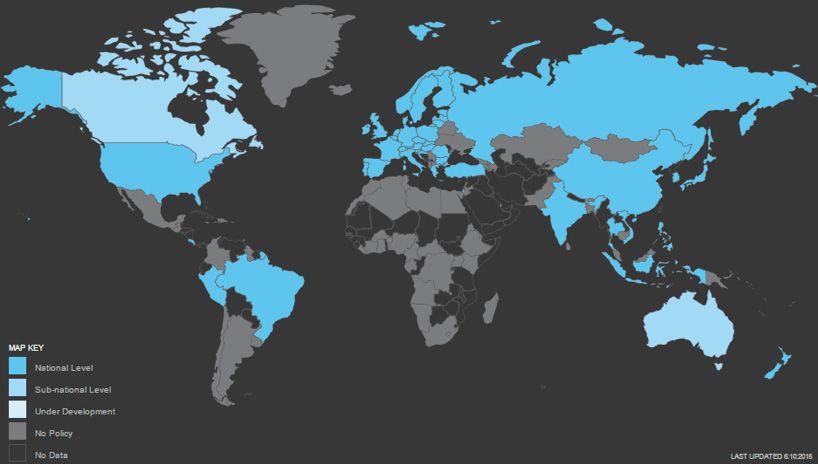
LANGDONWITHERS | SEN0089 ASIA Climate Change Whitepaper 2 P4a April 28, 2020 10:53 am
The Risks and Opportunities of Climate Change | Part 2 Climate Change Related Regulation
Forms of domestic 1. Carbon Pricing
regulation Carbon pricing, a market based mechanism, is the most widely discussed and promoted
regulatory approach to addressing climate change, often in combination with energy efficiency
Most major economies have started regulating standards and/or renewable energy targets. Carbon pricing has been increasingly adopted by
carbon and related issues like air pollution. A countries since the EU scheme was established in 2005 as it’s generally considered the most
number of approaches have been undertaken efficient, scalable and transparent regulatory approach.
with mixed success. Policy responses include:
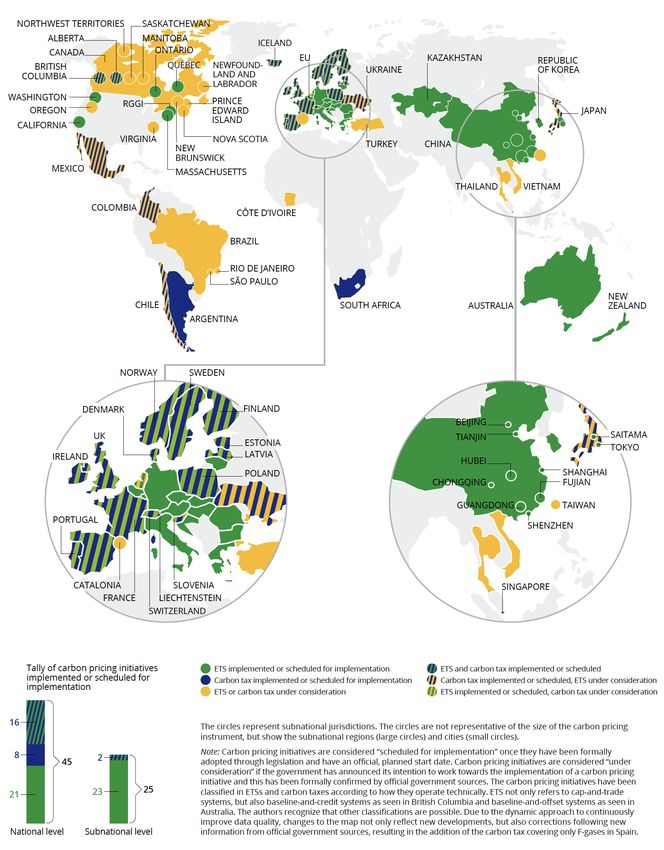
In 2018 45 countries and more than 25 cities/states have implemented an emissions trading
1. Carbon pricing (emissions trading or scheme or a carbon tax using prices ranging from under US$1 per tonne of CO2e1 to US$140 a
direct taxes) tonne. While prices are not necessarily comparable between carbon pricing initiatives (because
2. Emissions standards (carbon and of differences in the sectors covered and allocation methods applied), these programs were
other related pollutants e.g. mercury, valued at US$82bn (up 56% from 2017) and cover 20% of global GHG emissions2. Chart 3 shows
particulate matter etc) the countries and types of initiatives implemented while Chart 4 shows the percentage of global
3. Energy efficiency and renewable energy emissions covered over time.
incentives (renewable energy targets, There are various issues with the implementation of trading schemes as well as the maintenance
feed-in tariffs, direct subsides) of effective prices. For example in the EU scheme, the over allocation of permits in the face of
4. Forest and farming programs slowing economies following the global financial and European debt crises resulted in extended
5. Other initiatives including removal of fossil periods of depressed carbon prices. Lessons from these issues are increasingly being learnt as new
fuel subsidies, disclosure requirements schemes are implemented. For example, China introduced regional pilot programs in 2013 to test
and changes to approval processes the framework and build confidence in the market ahead of a national scheme to be launched by
Carbon regulation has seen significant 2020.
advancements globally. Countries who are not
providing investment and business certainty Chart 3: Countries/states with carbon pricing mechanisms
through low-carbon regulatory frameworks
may be placing their domestic businesses and
economies at a competitive disadvantage by
perpetuating regulatory uncertainty.
Carbon pricing, emissions standards, energy
efficiency and renewable energy incentives are
directly relevant to most companies and the
main subject of this paper. However, forest and
farming and the removal of fossil fuel subsidies
also have the potential for significant sector
specific impacts.
Source: Ecofys/Worldbank 2017.
3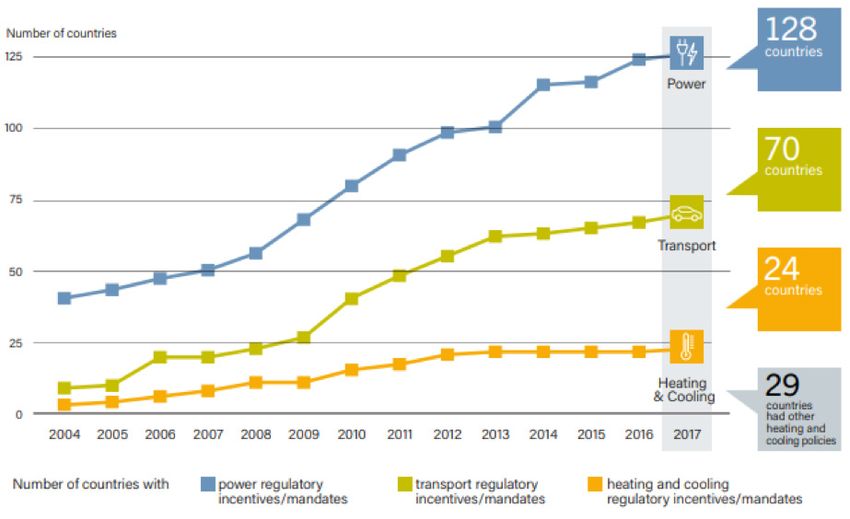
LANGDONWITHERS | SEN0089 ASIA Climate Change Whitepaper 2 P4a April 28, 2020 10:53 am
The Risks and Opportunities of Climate Change | Part 2 Climate Change Related Regulation
Chart 4: Number of carbon pricing initiatives (Globally) Emission standards mostly target transport and stationary energy
while energy efficiency standards mostly relate to buildings, industry,
Share of global annual GHG emissions 51 appliances and lighting. The UK, Canada, the US and China have all
20%
introduced emissions performance standards for new power generation
facilities. These standards are driving technological development and
46 47 50 fuel switching across markets. They have also forced the closure of
15%
38 41 generators which are too expensive to upgrade.
37
32 In 2014, Chinese Premier Li Keqiang said the government would “declare
10% war” on pollution in his speech to the National People’s Congress.
24
China’s 13th Five-Year Plan includes hard targets for specific pollutants as
Number of implemented initiatives
16 19 21 well as for overall ambient air quality improvements. To control carbon
5% 9 10 15
emissions, China has promised to peak carbon emissions by 2030 and
has also set a cap on energy consumption, at five billion tonnes of coal
2 4 5 6 7 8
0% equivalent in 2020.
1990 1995 2000 2005 2010 2015 2020 Coal consumption in China peaked in 2013 and has since been falling
(on average) in part due to the introduction of pollution control
Source: Ecofys/Worldbank 2017. measures which restrict steel and aluminium production in the winter.
In 2015 China’s state planner banned the burning of coal with ash
2. Emissions standards and energy efficiency content of more than 16 per cent or sulphur content of more than 1
measures per cent. This was part of an effort to fight air pollution in populous and
Energy efficiency standards are sometimes legislated but often include prosperous eastern cities.
government led or supported programs. These programs aim to In May 2017, Indian Prime Minister Nerendra Modi also introduced a
increase disclosure, standards and changes to procurement practices number of initiatives to be achieved by 2030 including reducing energy
to drive change in the market. Green building and appliance ratings are emissions intensity by 30-35%.
examples of these. Charts five and six show the countries and states Transport is another important area for emissions standards given it
who have implemented emission standards and energy efficiency represents 23% of global emissions growing at 2.5% per annum.1 Over
programs. 70% of light vehicles sold globally in 2014 were subject to emissions
standards.2
Chart 5: Countries/States with emissions standards
Schemes like these can pose both regulatory and stranded asset risks
depending on the capital intensity and life-cycle of a manufacturer’s
asset base.
Emissions standards and the risks of non-compliance came to
international attention with the Volkswagen emissions scandal where
the company installed software designed to defeat emission tests.
Reports have estimated the cost of the scandal to Volkswagen could
reach US$35bn.3
The aviation industry is also subject to national emissions standards
as well as a new scheme introduced by the International Civil Aviation
Organization (ICAO). The new Carbon Offsetting and Reduction
Scheme for International Aviation (CORSIA) aims to keep CO2 emissions
from international aviation rising after 2020.
Source: The Climate Institute, 2017. 3. Renewable energy incentives and targets
Encouraging greater renewable energy deployment is a key policy tool
Chart 6: Countries/States with energy efficiency programs in many countries for reducing emissions. Chart 7 (over page) shows the
global growth in renewable energy incentives between 2004 and 2017
with a range of measures including targets, feed-in tariffs, direct tenders
and mandates.
While incentives have been critical in growing the penetration of
renewable energy technologies, falling costs have seen wind and solar
become competitive with traditional high carbon energy sources.
Renewable installations have been greater than new fossil fuel
installations since 2013 with 2015 being the first year where over half of
new installations were renewable (Chart 8 – over page).
Source: The Climate Institute, 2017.
1 Source: IEA.
2 Source: Climate Change Authority (Aust).
3 Source: http://fortune.com/2018/09/08/volkswagen-vw-diesel-
scandal/.
4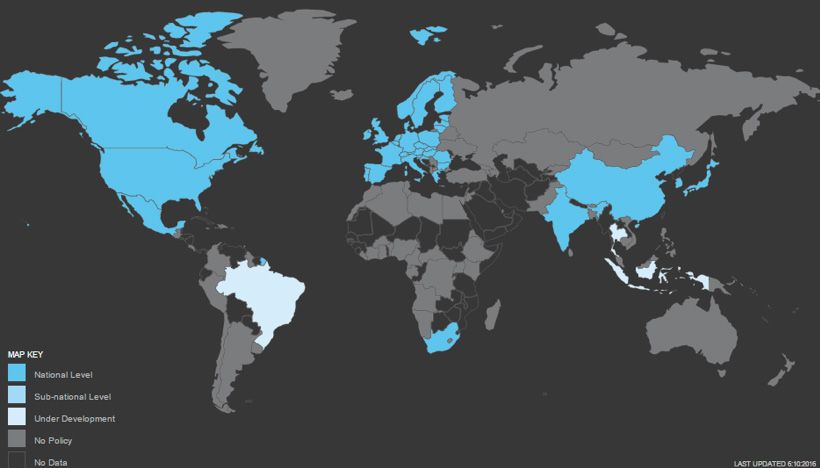
LANGDONWITHERS | SEN0089 ASIA Climate Change Whitepaper 2 P4a                                                                                                   April 28, 2020 10:53 am

            The Risks and Opportunities of Climate Change | Part 2                                                                    Climate Change Related Regulation

            Chart 7: Growth in renewable energy incentives.                             on the risks of carbon liabilities being passed down the supply chain or
                                                                                        changing end demand for products and services. These issues will be
                                                                                        covered under transition and stranded asset risks in the next paper in
                                                                                        this series.
                                                                                        Climate and carbon risks affect sectors to varying degrees. Energy,
                                                                                        materials, some industrial and utility companies have the highest
                                                                                        direct carbon intensity and therefore the largest regulatory exposure
                                                                                        to emissions compliance schemes. The property and financial services
                                                                                        sectors are also exposed to these risks due to the life cycle emissions of
                                                                                        buildings and the potential for changing credit risk and asset values in
                                                                                        the lending and investment portfolios of financial institutions.
                                                                                        These issues also present significant opportunities for companies
                                                                                        providing solutions from clean technology and more energy efficient
                                                                                        products along with competitive advantages for companies who are
                                                                                        early movers or provide complimentary products and services.

            Source: REN21 Policy Database 2017.                                         Internal carbon pricing
            Chart 8: New power capacity investments 2008 – 2015                         According to the Centre for Climate and Energy Solutions, companies
                                                                                        are increasingly setting an internal carbon price in anticipation of
                                                                                        regulation as a way to manage risk. This is being used in a range of ways
                                                                                        including:
                                                                                        – risk assessment in scenario planning,
                                                                                        – applying higher hurdle rates for capital investment decisions,
                                                                                        – assisting the business case for emissions or energy reduction
                                                                                          measures,
                                                                                        – helping support the business case for low-carbon products and
                                                                                          services.
                                                                                        Internal carbon pricing generally takes one of three forms.
                                                                                        – An internal carbon fee as a monetary value on each ton of carbon
                                                                                          emissions may be applied throughout an organisation. The fee
            Source: Bloomberg New Energy Finance 2017.
                                                                                          creates a dedicated cost/revenue stream to fund the company’s
            While popular and broadly successful, sudden changes in regulation,           emissions reduction efforts. This has been observed to sit between
            particular for feed-in tariffs1 have caused some market uncertainty.          US$5-$20 per metric ton CO2e.
            Spain was one of the worst examples where retrospective changes
                                                                                        – A shadow price as a theoretical price on carbon to support long-
            to overly-generous feed-in tariffs in 2013 caused significant losses to
                                                                                          term business planning and investment strategies. The observed
            existing investors while creating a sovereign risk for future investment.
                                                                                          price range for companies using a shadow price is from $2-$893 per
            Germany saw a more successful scheme with its transparent and
                                                                                          ton CO2e. Most companies use a shadow price higher than current
            progressive decline in feed-in tariffs causing renewable energy
                                                                                          regulatory levels.
            investment to grow strongly in the country.
                                                                                        – An implicit price as a cost to reflect how much a company spends
            Another successful method for accelerating the deployment of                  to reduce greenhouse gas emissions and/or cost of complying
            renewable energy has been reverse auctions arranged by governments            with government regulations. For example, it can be the amount
            including India, Mexico, Brazil and China. In 2018 India announced it         a company spends on renewable energy purchases or compliance
            plans to tender for 500GW of renewable energy as part of its target to        with fuel economy standards. It helps companies identify and
            have 40% of electricity from non-fossil fuel sources by 2030.                 minimise these costs, and uses the information gained from this
                                                                                          to understand their own carbon footprint. For some companies,
            Company responses to increased climate                                        an implicit carbon price can set a benchmark before formally
            related regulations                                                           launching an internal carbon pricing program.
            Regulatory initiatives, like the examples above, are impacting operating
            costs, capital plans and the cost of capital across the value chain in a
                                                                                        Embedding a carbon price into business
            number of sectors and consequently impacting asset values. These            strategy
            changes have been particularly prominent for energy related companies       Key findings of a 2016 report by CDP2 provides insights into the growing
            although other sectors are also affected. Regulatory risk can potentially   yet still wide variability ways companies are responding to carbon
            impact organisations at three points.                                       pricing signals. This highlights the importance for investors to fully
            – Emissions from the company’s own operations (Scope 1 emissions),          understand how these initiatives are impacting (or not) capital allocation
            – Indirect emissions from the company’s use of energy and heat              decisions.
              (Scope 2 emissions),
            – Emissions linked to other key inputs or the use of the company’s
              goods and services (Scope 3 emissions).
            Companies generally focus on communicating their direct liability to
            carbon emissions regulation, including their own emissions and the
            net cost of carbon permits they are required to hold under emissions
            trading schemes. These costs are important and are likely to grow over      1 A feed-in tariff is a premium rate paid for electricity fed back
            time, however many companies do not provide adequate information            into the electricity grid from a designated renewable electricity
                                                                                        generation source.
                                                                                        2 CDP was formerly called Carbon Disclosure Project.
            5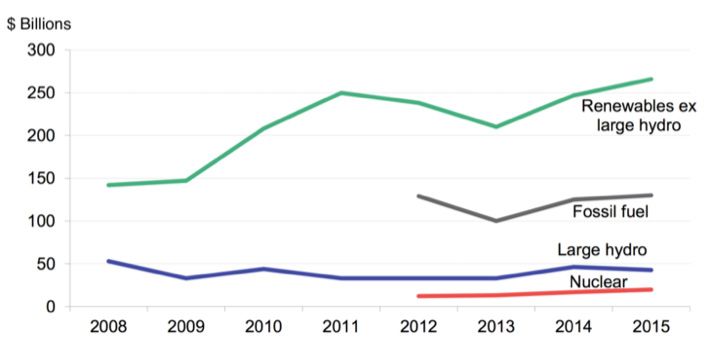
LANGDONWITHERS | SEN0089 ASIA Climate Change Whitepaper 2 P4a April 28, 2020 10:53 am
The Risks and Opportunities of Climate Change | Part 2 Climate Change Related Regulation
– While 370 companies in 14 high-emitting industries say they are are indirect and not consistently or comprehensibly reported. While
adopting carbon pricing, over 500 say they do not plan to do so. the chart shows that four sectors contribute the vast majority of direct
Approximately 400 of these are headquartered in countries who emissions, scope 3 emissions will be more relevant for some sectors and
are considering, are currently implementing or already have a price so should be considered when formulating carbon aware strategies.
on carbon. The number of companies potentially at risk is likely
to be even larger given the multinational nature of many of these Chart 10: Average Carbon Emissions by Sector
companies and the wider sectoral coverage of some carbon taxes.
millions
– 23 per cent more companies disclosed either their practice of 120
internal pricing carbon, or plans to do so, than in 2015.
– There is an increase in corporate carbon pricing, notably in Brazil, 100
China, India, Japan, Mexico, Republic of Korea and the US.
80
– Companies using an internal carbon price are seeing tangible
impacts such as shifting investments to energy efficiency measures,
60
low-carbon initiatives, energy purchases and the development of
low-carbon product offerings. 40
– Although largely undisclosed, internal carbon price levels vary by
region from less than $1 to more than $800. 20
– Internal carbon pricing was greatest amongst utilities and energy
sector companies. 0
Utilities
Energy
Materials
Industrials
Telecom
Services
Consumer
Staples
Consumer
Discretionary
Communication
Services
Industrial
Information
Technology
Financials
Real Estate
Health Care
Chart 9: Companies setting an internal price of carbon
by sector.
Ave Emissions Scope 1 & 2 Ave Emissions Scope 3
Source: MSCI/CFSGAM.
Investors can employ various strategies to manage regulatory risks
including:
1. Incorporation of carbon costs for individual assets
or companies.
While on the surface incorporating a carbon cost into valuation models
is relatively straight-forward, an understanding of market dynamics and
a company’s ability to pass through costs or reduce emissions should
be considered. In addition other regulatory interventions for related
issues like air pollution should also be considered. For some companies
regulation around carbon and other pollutants may put them at a
relative advantage, particularly those who have acted early to reduce
emissions or whose business model allows them to benefit from
Note: The total number of companies that responded to the survey is regulatory tailwinds.
shown in parentheses for each sector.
Source: CDP, 2016.
2. A
ssumptions related to other capital/operating
In the annual CDP survey in 2017, 57 per cent of respondents currently expenditure
use internal carbon pricing, and 3 per cent of those have also A critical risk for investors is how companies decide to invest capital and
committed to the UN Global Compact’s Business Leadership Criteria on the life cycle of carbon intensive capital assets. While transition risks and
Carbon Pricing and/or the World Bank’s Statement on Putting a Price on stranded assets are covered in the next paper in this series, changing
Carbon. carbon regulations can accelerate these risks.
For example, early closures of coal-fired power generators to avoid the
Investment implications cost of upgrades when pollution standards change can dramatically
Various factors will influence the ability to account for and act on the shift the financial position of some companies. Additional costs
regulatory risks associated with climate change. These include the associated with early closures like a lack of balance sheet recognition for
investment approach (e.g. active vs passive, growth vs quality etc), asset site remediation should also be considered.
class and time horizon of the investor. Conversely many companies can achieve significant savings through
The risks associated with the regulation of emissions are more straight- energy efficiency and investment in lower cost clean energy
forward to factor in by investors in their investment analysis than alternatives.
physical risks but is not without challenges.
Investors can also use their influence with companies to encourage
and then measure the progress of efforts to rapidly reduce emissions.
Given the serious risks posed by climate breakdown highlighted in
our first paper, action by companies and investors will be important
contributions in the global effort to keep temperature increases well-
below 2°C.
Chart 10 shows the average emissions by sector for scope 1 and 2
emissions. These are normally included in footprint analysis and directly
attributable to the firm. The chart also shows scope 3 emissions which
6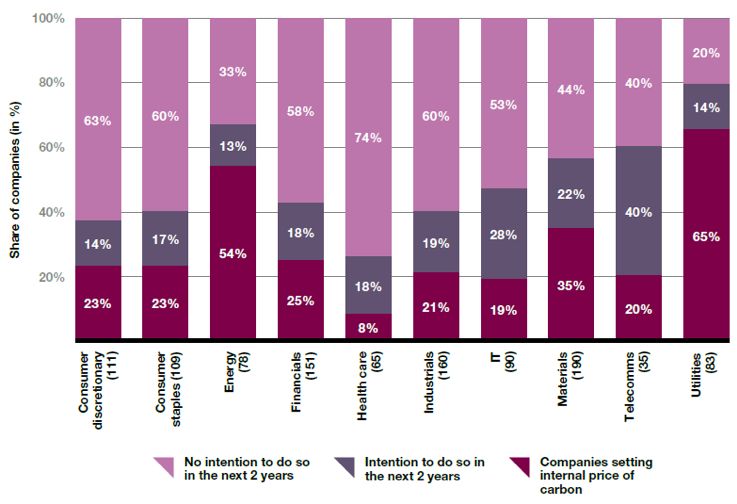
LANGDONWITHERS | SEN0089 ASIA Climate Change Whitepaper 2 P4a                                                                                                     April 28, 2020 10:53 am

            The Risks and Opportunities of Climate Change | Part 2                                                                      Climate Change Related Regulation

            3. A
                ssessing supply chain risks                                               5. E
                                                                                               ngagement with company management
            Some companies will be better able to pass on the costs of carbon                 and boards
            regulation than others. Understanding whether a company or an                  As with all aspects of climate change risk and opportunity, engagement
            asset is likely to have costs passed on to it or is able to pass costs on is   with companies is a critical area of work for investors. Collaborative
            a normal dimension of supply chain analysis which can be extended              initiatives such as the Climate Action 100+ along with individual
            to carbon regulations, albeit with some important differences. These           engagement efforts offer important opportunities for investors to
            considerations are covered in more details in the following paper on           better understand the issues and encourage improved performance
            transition and stranded asset risks.                                           from companies.
            4. Portfolio construction                                                     Encouraging disclosure in line with the TCFD, which covers, governance,
                                                                                           strategy, risk management and metrics and targets, is a good starting
            In addition to incorporating carbon regulation into company analysis
                                                                                           point for ensuring appropriate systems are in place.
            and valuations, some investment strategies now incorporate specific
            emission reduction targets. For example, smart beta strategies have            Given the urgency of the emissions reduction challenge, asking
            been developed which reduce carbon exposure while aiming to                    companies to set science based reduction targets as part of a transition
            maintain overall portfolio risk and return characteristics.                    plan and monitoring their performance against those will set a clear
                                                                                           baseline for ongoing engagement.
            These carbon reduction strategies have increased in popularity in recent
            years because they provide an explicit and measureable reduction               Proxy voting for listed equities is also an important engagement tool
            at the portfolio level in a risk aware and cost efficient manner. This         given the increasing number of shareholder resolutions being put to
            measurability allows for rigorous ongoing monitoring of portfolios             company general meetings requesting improved disclosure and other
            against the reduction targets.                                                 actions related to climate change.
            However care must be taken, whether through smart beta or any other            Investors might wish to question the suitability of directors who are on
            strategy with explicit carbon footprint reduction targets.                     the record as dismissing or denying climate change. Not “believing” in
                                                                                           climate change does not absolve a director from their duty to show due
            One issue is that around half of companies globally do not disclose
                                                                                           care and diligence in managing the risks. Risks related to director duties
            emissions and so are estimated by third party providers based on
                                                                                           is covered in the fourth paper in this series.
            industry averages which lifts some companies while dragging others
            down. This underlies the importance of engagement on initiatives such          6. Advocacy and engagement with regulators and
            as the Taskforce for Climate-Related Financial Disclosure (TCFD) and CDP
            to continue to improve company disclosure.                                        other stakeholders
            A singular focus on emission reductions also risks missing and in some         With all aspects of climate change risk and opportunity, investor
            cases unintentionally increasing exposures to other climate change             advocacy with regulators and other stakeholders is important for
            risks like stranded asset risks. For example some approaches will invest       developing a comprehensive climate change strategy.
            in pipelines and mining services companies rather than oil and gas             Policies which are transparent, long-term, consistent and scalable, like
            companies in an effort to maintain energy exposure with lower emissions        carbon pricing, make incorporation of carbon risks easier for investors.
            even though these companies may have less flexible business models.            Similarly, policy vacuums or repeated changes to policy frameworks
            Similarly some electric utilities may be excluded for higher emissions         increase uncertainty and risk which discourages investment or increases
            when they are often best placed to transition to a low carbon economy.         the return demands of investors to compensate.
            The increasing number of green bonds and other targeted investments            7. Climate change governance and risk disclosure
            also offer opportunities for investors in both mainstream and dedicated
            portfolios to allocate capital to the low carbon transition. A green              (inc voting)
            label does not guarantee ‘greenness’ however and so investors should           Investor governance and disclosure of these issues is important for
            consider how use of proceeds is managed, how any capital this frees up         providing information to clients and key stakeholders, but also for
            is to be deployed, what ongoing reporting is to be provided by issuers         sending a signal to the market. The TCFD has specific guidance for
            and what third party assurance (to frameworks like the Climate Bonds           asset owner and asset manager disclosure.
            Initiative) have been performed.
            While returns for green bonds have generally been in line with ‘non-
            green’ bonds, by including the regulatory tailwinds for low carbon assets
            and the need to mitigate physical climate change risks, investors may
            consider these assets to be lower risk and consequently more attractive
            on a risk return basis than non-green alternatives.
            Other asset classes from listed equities to unlisted assets also offer
            opportunities for targeted investments which are aligned with achieving
            emission reductions. These targeted investments can be made as part
            of a strategy which reduces exposure to higher carbon investments.

            7
LANGDONWITHERS | SEN0089 ASIA Climate Change Whitepaper 2 P4a April 28, 2020 10:53 am
The Risks and Opportunities of Climate Change | Part 2 Climate Change Related Regulation
The table below outlines these different approaches for managing the physical risks across asset classes with further description provided.
in assessing individual or groups
demand for goods and services
Assumptions related to capital/
and risk disclosure (inc voting)
Incorporation of physical risks
Climate change governance
Engagement with company
Advocacy and engagement
Assessing supply chain risks
with regulators and other
operating expenditure
Assumptions related to
Adaptation planning
Adaptation finance
Asset Class
management
stakeholders
of assets
Active Domestic Listed Equites X X X X X X X
Active Global Equities X X X X X X X
Passive Domestic Listed Equities X X X X
Passive International equities X X X X
Corporate debt X X X X X X X X
Corporate debt financials X X X X X
Sov/semi/supra Debt X X X X X X X
Private equity X X X X X X X X X
Unlisted property X X X X X X X X X
Unlisted Infrastructure X X X X X X X X X
High Level – external tools and forecasts
Medium Level – external tools and forecasts, proprietary models/frameworks
Deep level – external tools and forecasts, proprietary models/frameworks, specialist reports and advice
Conclusion Coming next, Part 3
Carbon and related pollution regulation has taken various forms In the next paper in this series we will cover transition and stranded
around the world and has grown significantly in the last several years. asset risks which come from the complex mix of physical, carbon and
Commitments made under the Paris Climate Change Agreement are other factors like technological change and consumer preferences,
likely to accelerate the adoption and ambition of policy measures being which are shifting the prospects for companies and is disrupting whole
deployed. industries.
Compared to physical risks, investors have a much greater ability to
incorporate carbon and related pollution regulations into company
analysis and valuations, portfolio construction and engagement.
However it’s important to note, the urgency of reducing emissions
cannot be divorced from the physical risks of climate change.
While the range of policy measures impacts some industries more
than others, knock on effects and the ability (or not) for companies to
pass on costs should also be considered when assessing the risks and
opportunities associated with these regulations. The TCFD provides
a solid framework for both investors and companies to test these
approaches
Good governance, transparency and positive advocacy around climate
change regulation are as important for investors as they are for the
companies invested in.
8LANGDONWITHERS | SEN0089 ASIA Climate Change Whitepaper 2 P4a April 28, 2020 10:53 am
The Risks and Opportunities of Climate Change | Part 2 Climate Change Related Regulation
Important Information
The information contained within this document is generic in nature and does not contain or constitute investment or investment product
advice. The information has been obtained from sources that First State Investments (“FSI”) believes to be reliable and accurate at the time
of issue but no representation or warranty, expressed or implied, is made as to the fairness, accuracy, completeness or correctness of the
information. Neither FSI, nor any of its associates, nor any director, officer or employee accepts any liability whatsoever for any loss arising
directly or indirectly from any use of this document.
This document has been prepared for general information purpose. It does not purport to be comprehensive or to render special advice.
The views expressed herein are the views of the writer at the time of issue and may change over time. This is not an offer document, and
does not constitute an investment recommendation. No person should rely on the content and/or act on the basis of any matter contained
in this document without obtaining specific professional advice. The information in this document may not be reproduced in whole or in part
or circulated without the prior consent of FSI. This document shall only be used and/or received in accordance with the applicable laws in the
relevant jurisdiction.
Reference to specific securities (if any) is included for the purpose of illustration only and should not be construed as a recommendation to buy
or sell the same. All securities mentioned herein may or may not form part of the holdings of First State Investments’ portfolios at a certain
point in time, and the holdings may change over time.
In Hong Kong, this document is issued by First State Investments (Hong Kong) Limited and has not been reviewed by the Securities & Futures
Commission in Hong Kong. In Singapore, this document is issued by First State Investments (Singapore) whose company registration number
is 196900420D. This advertisement or publication has not been reviewed by the Monetary Authority of Singapore. First State Investments is a
business name of First State Investments (Hong Kong) Limited. First State Investments (registration number 53236800B) is a business division
of First State Investments (Singapore). The First State Investments logo is a trademark of the Commonwealth Bank of Australia or an affiliate
thereof and is used by FSI under licence.
First State Investments (Hong Kong) Limited and First State Investments (Singapore) are part of the investment management business of First
Sentier Investors, which is ultimately owned by Mitsubishi UFJ Financial Group, Inc. (“MUFG”), a global financial group. First Sentier Investors
includes a number of entities in different jurisdictions, operating in Australia as First Sentier Investors and as FSI elsewhere.
MUFG and its subsidiaries are not responsible for any statement or information contained in this document. Neither MUFG nor any of its
subsidiaries guarantee the performance of any investment or entity referred to in this document or the repayment of capital. Any investments
referred to are not deposits or other liabilities of MUFG or its subsidiaries, and are subject to investment risk, including loss of income and
capital invested.
9You can also read