Climate change risk assessment in Baghdad: examining population vulnerability - IOPscience
←
→
Page content transcription
If your browser does not render page correctly, please read the page content below
IOP Conference Series: Materials Science and Engineering

PAPER • OPEN ACCESS

Climate change risk assessment in Baghdad: examining population
vulnerability
To cite this article: M F Abdulateef and H A S Al-Alwan 2021 IOP Conf. Ser.: Mater. Sci. Eng. 1067 012058

View the article online for updates and enhancements.

 This content was downloaded from IP address 46.4.80.155 on 10/07/2021 at 13:24
4th International Conference on Engineering Sciences (ICES 2020) IOP Publishing
IOP Conf. Series: Materials Science and Engineering 1067 (2021) 012058 doi:10.1088/1757-899X/1067/1/012058

Climate change risk assessment in Baghdad: examining
population vulnerability

 M F Abdulateef ¹, H A S Al-Alwan2
 ¹,2 Architectural Department, College of Engineering, University of Baghdad, Iraq
 Corresponding author’s email: archi.maryam89@gmail.com

 Abstract. Studying climate change risks has acquired increased importance and attention
 around the world in recent years. Every city has its special points of strength and vulnerability
 that define its specific level of climate change risk. The assessment of this level offers multiple
 advantages by not just defining potentially impacted areas but also identifying the highest
 priority areas for the development of sustainable solutions. In Baghdad, surface urban heat island
 (SUHI) has been noted as one of the main climate change impacts, yet a review of the related
 literature suggested that few studies have previously assessed the risk level of SUHI, particularly
 in terms of population impacts in the Baghdad areas. Accordingly, this research aimed to classify
 the various Baghdad areas according to population exposure to SUHI risks, and to define the risk
 level as a result of the overlay and the intersection of two main factor layers, intensity of and
 vulnerability to climate change impact. The research results thus identified areas with the highest
 level of risk to populations, which thus represent the highest priority areas for any adaptation
 efforts. Conducting this assessment constitutes a basic step in defining sustainable future
 adaptation strategies, as well as identifying areas with lower levels of SUHI risk, where measures
 may be carefully taken to sustain and improve current environmental performance, allowing for
 a more long-term focus on environmental quality.

1. Introduction
During the 20th century and the first decades of the 21st century, the world has witnessed a large and a
growing number of major changes; construction processes have multiplied, technology has spread
everywhere, and the innovations are constantly competing in terms of speed of discovery and
development. Not all of such changes have been positive, however, and some negative changes have
created dangerous threats to the future. At the top of the list of these threats is climate change, and its
highly negative impacts on life on Earth.
In general, climate change can be defined as any alteration in climate conditions over a long time,
whether these result from human intervention or natural changes [1]. On a global scale, several climate
change impacts have already been noticed: the second half of the 20th century, witnessed an increase in
global average temperature by 0.74 C°, a drop in ice cover by 40% and a rise in natural sea-level of
17cm [2]. This climate change is generally associated with the increase in long-lived greenhouse gases
(GHG) within the atmosphere, caused by anthropogenic activity, which have caused an unequivocal rise
in global temperature averages, leading the underlying climate change to often be called Global
Warming [3] [4] [5].
On the scale of areas such as a city or a neighbourhood, climate change can cause a wide range of local
risks. Climate change risk can be defined as “the potential for impacts where something of value is at
stake and where the outcome is uncertain”, referring to the likelihood of the occurrence of negative
impacts that may harm the social, environmental and physical resources [6]. In 2006, Mimura presented
five concepts defining climate change adaptation: risk avoidance, negative impact reduction, risk
 Content from this work may be used under the terms of the Creative Commons Attribution 3.0 licence. Any further distribution
 of this work must maintain attribution to the author(s) and the title of the work, journal citation and DOI.
Published under licence by IOP Publishing Ltd 1
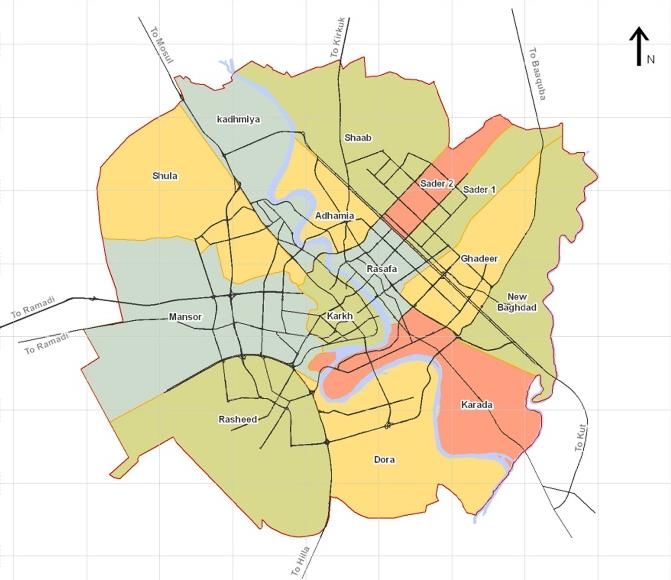
4th International Conference on Engineering Sciences (ICES 2020) IOP Publishing
IOP Conf. Series: Materials Science and Engineering 1067 (2021) 012058 doi:10.1088/1757-899X/1067/1/012058

sharing, risk acceptance, and exploitation of opportunities [7]. Many of these concepts are based on
dealing with risk before it occurs, thus involving prior action such as risk avoidance, while other
concepts are based on dealing with risk after it occurs, involving posterior actions such as exploitation
of opportunities [8]. According to some global adaptation-promoting organizations such as UNFCCC
and UNDP, assessing climate change risk must be considered one of the basic steps for planning a
successful climate change adaptation strategy [9] [10]. Accordingly, assessing the level of risk becomes
a necessity not just to define the potential negative impacts of climate change but also to determine the
most suitable solutions, and to reduce and even create benefit from the impacts.
At the scale of Baghdad city, an increase in temperature represents the most obvious impact of climate
change. During the second half of the 20th century and in the early 21st century, Baghdad, like all of
the governorates in Iraq, suffered from a warming pattern reflected in an increasing trend in annual
maximum, minimum, and mean temperatures. For example, the annual mean temperature increased by
3 °C in the period between 1995 and 2015 [11], and these increases in temperature are projected to
continue in future. Baghdad is thus set to become hotter over time [12].
Baghdad also suffers from a clear state of surface urban heat island (SUHI) [13] [14]. SUHI refers to
the temperature increase in urban built areas in comparison with surrounding rural areas [15]. By using
computer analysis based on GIS software, one Iraqi researcher pointed out that in winter 2001, a SUHI
differential existed between Baghdad’s built-up area and nearby green areas of about 12 °C: the built-
up area had the maximum value surface temperature of 30 °C, while the green area had the minimum
value of 18 °C [13]. In another analytic study conducted to verify Baghdad UHI intensity in the summer
of 2013, the results showed that, in general, the differences between Baghdad’s built-up areas and blue-
green areas had increased to about 15˚C [14].
On reviewing related previous studies [11] [13] [14] [16], however, limited research on the risk level
of SUHI in Baghdad areas was found. To develop a full understanding of climate change impacts, there
is a clear necessity to assess this risk locally; accordingly, this research aimed to assess the risk level of
SUHI in Baghdad areas. The results of this research are hoped to assist in defining those areas at higher
levels of risk, to offer clear starting points for sustainable adaptation plans, as these areas represent
higher priority regions that require accelerated and sustainable solutions.
2. Study Area Description
Geographically, Baghdad governorate lies to the right if the centre of Iraq, at latitude 33˚18' N and
longitude 44˚21' E, being elevated above the sea level by about 39 m (128 feet) [17]. The Tigris river
passes through the city from north to south, dividing the city in half. The eastern side is generally called
Al-Risafa, while the western side is Al-Karkh.
 The study area of this research was limited to boundaries of the Baghdad Mayoralty, which represents
most of the governorate’s urbanised entity, with an area of about 840 km². This area is divided into 14
municipalities, which in turn consist of many Mahalas (Figure 1) [18]. In 2010, the population living
within Baghdad Mayoralty was about 6,133,000. The ratio of the urbanised area in the region has
significantly increased over time; in 2006, it was about 60%, while in 2011, it was about 80% [18].

 2
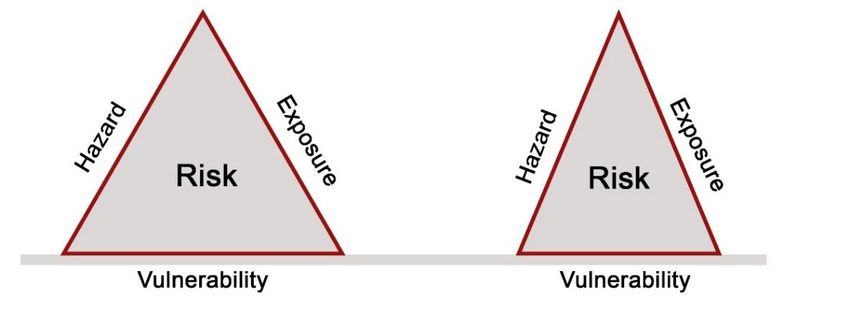
4th International Conference on Engineering Sciences (ICES 2020) IOP Publishing
IOP Conf. Series: Materials Science and Engineering 1067 (2021) 012058 doi:10.1088/1757-899X/1067/1/012058

 Figure 1. Municipalities of Baghdad city.
According to the Köppen climate classification, Baghdad has a hot desert climate (Köppen BWh), being
in one of the four divisions of the dry climate group (B) [19]. The hot desert climate pertains to areas in
the lower middle latitudes (between 20° to 33° north and south) under the subtropical ridge, which are
generally characterised by hot and arid conditions with strong sunshine [20].
Baghdad is one of the world hottest cities, and on hot days, the temperature can increase to nearly 50
°C. In July 2015, the city of Baghdad recorded its highest temperature ever at 51°C. Generally, summer
is longest season of the year, at about seven months ling, and there is little rainfall, with this being
limited only to winter seasons. For the rest of the year, conditions are dry, clear and sunny. In the
Baghdad climatic region, the average relative humidity is about 27%, so the city suffers from a clear,
dry climate [21] [22].
3. Methodology
In general, defining climate change risk depends on identifying place-related factors. In 1999, the
economic researcher David Crichton produced the “Risk Triangle” to represent risk as the area of a
triangle, with the three sides being hazard, exposure and vulnerability; thus, when any of these three
sides is reduced, the total area of risk is accordingly also reduced (Figure 2) [23]. This relationship can
be presented in the following way:

 = x Exposure x Vulnerability (1)

 A B

 Figure 2. The risk tringle.

 3
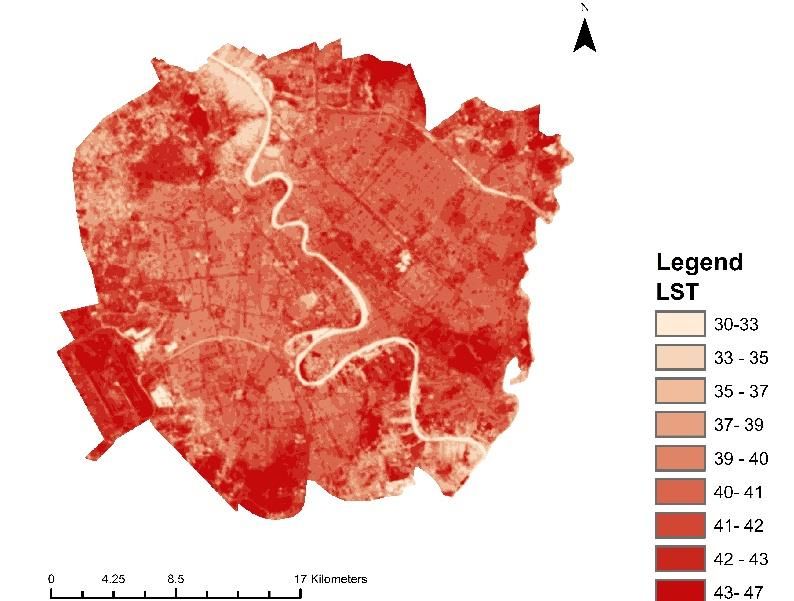
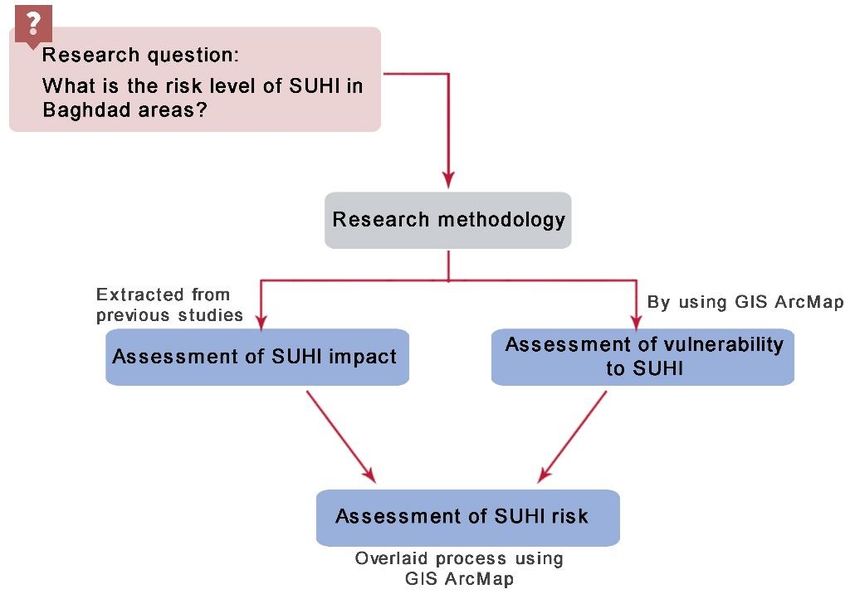
4th International Conference on Engineering Sciences (ICES 2020) IOP Publishing
IOP Conf. Series: Materials Science and Engineering 1067 (2021) 012058 doi:10.1088/1757-899X/1067/1/012058

 A- The three factors of the risk triangle.
 B- When any factor (here vulnerability) is reduced, the total area of the triangle is simultaneously
 reduced
In 2004, Downing and Patwardhan presented another relationship to assess climate change risk. They
considered exposure to be part of vulnerability rather than a separate component of risk. Accordingly,
they defined assessing exposure as a part of assessing vulnerability, creating another equation [24]:

 = ( ) ( ) (2)

In this research, the latter equation was used to determine those areas with higher risk in Baghdad,
allowing the two main factors, SUHI impact and vulnerability, to be assessed and overlaid to define the
relevant risk levels. GIS ArcMap 10.4.1 was used to conduct this process, with the research methodology
divided into three main steps as follows (Figure 3):
 - Step 1: Assessment of the impact of Surface Urban Heat Island in Baghdad.
 - Step 2: Assessment of Vulnerability to Surface Urban Heat Island in Baghdad.
 - Step 3: Identifying Risk Level by overlaying the results of steps 1 and 2.

 Figure 3. Research methodology.
3.1 Assessment of the Impact of Surface Urban Heat Islands
Assessing the impact of SUHI requires assessing the intensity of the phenomenon at a certain scale, in
this case Baghdad city. Assessment is conducted by comparing the surface temperature values between
the urban and rural areas of the selected study area [25] [26] [27], and in general, two methods can be
used to do this: using digital infrared radiation thermometers or employing computer processing of
satellite images [27] [28]. The second method, the remote sensing technique, is more reliable, as it
provides information about multiple places at a certain date, revealing the relationships between urban
surface temperature and land cover distribution. Assessing SUHI via computer processing can thus help
in observing the trends of SUHI development and distribution across study areas [28].
Using remote sensing techniques, an assessment of Baghdad SUHI was recently conducted [29] that
found that the intensity of Baghdad SUHI ranged between 30 °C in vegetated and water-covered areas
to about 47 °C in soil-covered and built-up areas (Figure 4). Accordingly, the research revealed a wide

 4
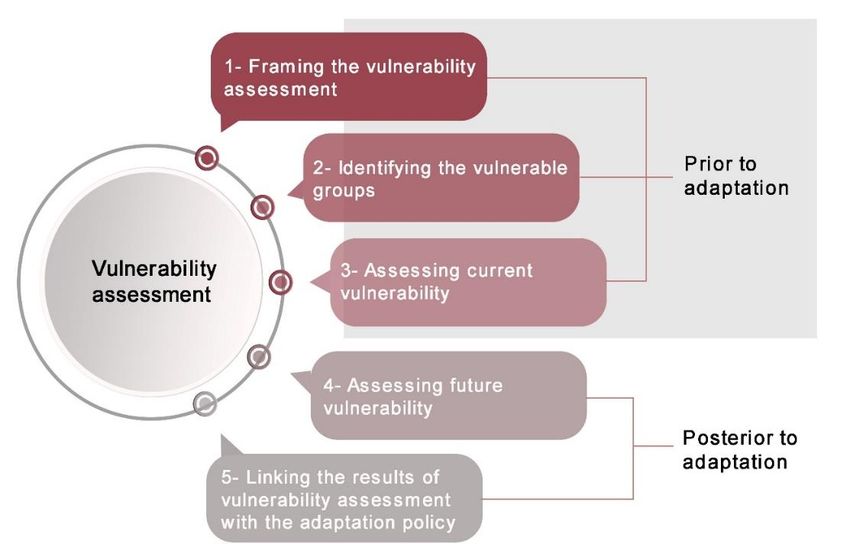
4th International Conference on Engineering Sciences (ICES 2020) IOP Publishing
IOP Conf. Series: Materials Science and Engineering 1067 (2021) 012058 doi:10.1088/1757-899X/1067/1/012058

variation in SUHI intensity between different areas of the city [29]. As this research was conducted
recently using a reliable measuring method, its results were employed to assess climate change risk in
Baghdad city for this study.

 Figure 4. Assessment of surface urban heat island in Baghdad, 24 July 2018.

3.2 Assessment of Vulnerability to Surface Urban Heat Islands
Assessing vulnerability is an essential part of the process in defining risk, as it defines those areas where
something of value, such as a population or ecosystems, may be exposed to significant climate change
impacts. However, although vulnerability is a widely used term in the field of climate change, there is
as yet no unified definition for this term [24]. The Intergovernmental Panel on Climate Change (IPCC)
has defined it as the propensity of a system to be negatively impacted; however, the term may also refer
to many other concepts such as sensitivity or susceptibility to harm [6].
Another definition of vulnerability was presented by Mimura et al., being the susceptibility of society
and natural systems to be negatively impacted by climate change; here, the term “society” refers to both
humans and their built physical capital. The lower the vulnerability, the less damage these systems may
experience [30], and in general, vulnerability is the opposite of site adaptive capacity; as the former
increases, the latter decreases [31].
Conducting a vulnerability assessment is thus an essential step in planning responses to both current and
future climate risks. In recent decades, several methods to assess vulnerability have thus been developed
in many sectors, including natural hazards, poverty analysis, and food security, and these methods offer
some good general methods for assessing climate change vulnerability [24].
In 2004, Downing and Patwardhan suggested a method to assess vulnerability to assist climate change
adaptation. This method involves undertaking five main activities to assess vulnerability before and after
adaptation. These are [24]
 - Activity 1: framing the vulnerability assessment by setting definitions, frameworks and
 objectives. This setting is thus intimately linked with the context of the project for which
 vulnerability is to be assessed.
 - Activity 2: identifying vulnerable groups by answering the questions of who is vulnerable, to
 what, why, and where. Vulnerability assessment thus usually covers populations, institutions,
 and places.
 - Activity 3: assessing current vulnerability by examining a combination of the socio-economic
 characteristics of al vulnerable groups.

 5
4th International Conference on Engineering Sciences (ICES 2020) IOP Publishing
IOP Conf. Series: Materials Science and Engineering 1067 (2021) 012058 doi:10.1088/1757-899X/1067/1/012058

 - Activity 4: assessing future vulnerability, which aims to calculate the rate of vulnerability after
 employing specific adaptation plans.
 - Activity 5: linking the results of vulnerability assessment with the adaptation policy,
 incorporating the outputs of current and future vulnerability assessments into the decision
 making for adaptation measures.
In this research, the first three activities are employed, as these offer a scientific approach to assessing
the current vulnerability of Baghdad to SUHI. As the latter two activities are about vulnerability after
the adoption of adaptation plans, however, these are beyond the research aim (Figure 5).
3.2.1 Framing vulnerability assessment (Activity 1).
Before selection of the framework to be used to measure vulnerability in Baghdad, the national or local
vulnerability frameworks already in use required review. However, previous related studies, such as
“The state of the environment in Iraq 2017”, have suggested that no standard framework has been
employed locally to assess vulnerability [16]. Accordingly, assessing vulnerability in Baghdad began
with setting out a conceptual vulnerability definition.
As the aim of this vulnerability assessment for the current research was to determine those areas at
higher risk of SUHI in Baghdad in order to plan a sustainable adaptation strategy, vulnerability was
defined as “The possibility of local systems and sectors in Baghdad to be adversely impacted by surface
urban heat island (SUHI)”, based on reviewing the related knowledge previously explored in 3.2.

 Figure 5. Method of Vulnerability Assessment (based on Downing and Patwardhan
 [24]).

The objective of assessing vulnerability for this work was thus defined as “determining suitable
sustainable adaptations to SUHI in Baghdad”. To achieve this objective, two main questions were thus
defined:
 o What systems are the most vulnerable to SUHI in Baghdad city?
 o Which systems in Baghdad city can most benefit from
 adaptation actions?
Activity one is summarised in table 1. After this activity was conducted, the theoretical framework of
the vulnerability assessment was clearly defined.

 6
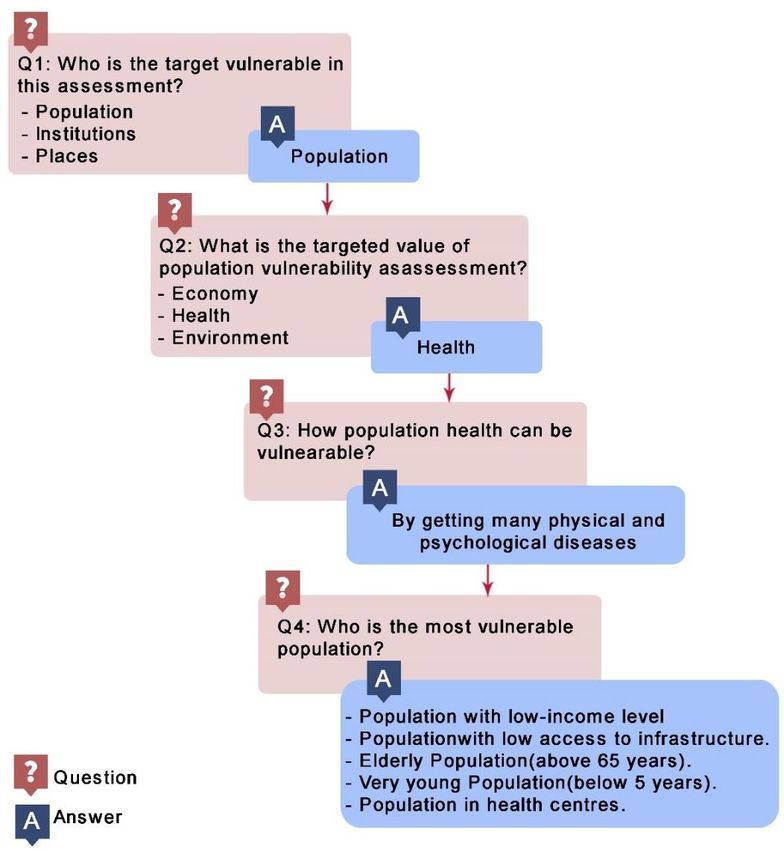
4th International Conference on Engineering Sciences (ICES 2020) IOP Publishing
IOP Conf. Series: Materials Science and Engineering 1067 (2021) 012058 doi:10.1088/1757-899X/1067/1/012058

 Table 1. Framing the vulnerability assessment.

 Vulnerability definition Vulnerability objectives Vulnerability questions
 The possibility of local Finding sustainable -What systems or sectors
 systems and sectors in adaptations to SUHI in are the most vu lnerable to
 Baghdad being adversely Baghdad SUHI in Baghdad?
 impacted by surface urban -Which system or sector in
 heat islands. Baghdad can benefit most from
 adaptation actions?
3.2.2 Identifying vulnerable groups (Activity 2).
Based on the clear definition and identified objectives developed in the vulnerability assessment, it was
necessary to determine which groups are vulnerable to SUHI and in which ways they may be negatively
impacted by it. As previously mentioned, the targets of vulnerability assessment can include
populations, institutions, and places. Generally, population is given the greatest importance, however.
Institutions, such as organisations, firms, and sectors may be significantly affected by climate change
however, both with regard to resources and costs. Places which include various aspects of natural capital,
such as land, ecosystems, and water, may also suffer from climate change impacts [24]. Water, for
example, is one of the sectors most vulnerable to climate change. Global warming, precipitation pattern
changes, extreme evapotranspiration, and the heterogenous concentration of world population have all
caused significant shifts in water quantity and quality. In quantitative terms, climate change causes water
shortages associated with an increase in use, especially in arid and semi-arid regions [32], while from a
qualitative perspective, climate change causes many significant physical and chemical changes in water
body composition, such as lowering the level of dissolved oxygen, increases in pollutant concentrations,
and the loss of many aquatic species [33].
As populations are generally deemed the most important target [24], this assessment gives them
centrality, particularly in terms of the impact of SUHI on health levels. Human systems are thus the
target vulnerable systems examined to assess the risk of SUHI in Baghdad, and assessing the
vulnerability of institutions and places (natural and physical systems) is left for future research.
SUHI has a series of health consequences as well as environmental and economic impacts [34]. The
impacts of urban heat islands can be devastating for those who are living in tropical and arid climates,
especially in summer. Climate discomfort, especially for those working outdoors, causes many diseases,
including heat stress and skin burns. In some extreme cases, especially in tropical regions, death may
ensue [35]. In hot, dry climates, these risks are significantly increased, with the main effects occurring
where significant temperature increases are combined with air humidity decreases, which may lead to
severe states of heat stress, especially if the wind speed is limited [36]. In addition, an increase in urban
temperature tends to cause an increase in cooling energy demand, leading to further GHG production,
as most current energy plants depend on fossil fuels [35]. For each degree increase in UHI, the energy
demand increases by 2 to 4% [37], increasing the total living costs in these cities in comparison with the
surrounding countryside.
In this study, health was set as a targeted value, and population vulnerability to SUHI in terms of health
thus assessed, leading to another question: who forms the most vulnerable population to SUHI in terms
of health? In 2015, Norton et al answered this question for hot, dry climates, as seen in Baghdad, with
the most vulnerable populations to SUHI in terms of health being [38]
 - Populations with low income levels.
 - Populations with low access to infrastructure.
 - Elderly populations (above 65 years).
 - Very young populations (below 5 years).
 - Sick populations, especially those in health centres.

 7
4th International Conference on Engineering Sciences (ICES 2020) IOP Publishing
IOP Conf. Series: Materials Science and Engineering 1067 (2021) 012058 doi:10.1088/1757-899X/1067/1/012058

Activity 2 is illustrated in figure 6; this activity allowed the groups most significantly influenced by
SUHI to be clearly defined in terms of the interests of this study.
3.2.3 Assessing current vulnerability (Activity 3).
To assess the vulnerability of human systems to SUHI in Baghdad, relevant data were required to be
collected and analysed. In the process of collecting data, quality criteria were adopted that resulted in
the collection of data from local governmental agencies and international organisations. Data about the
relevant vulnerable groups was sought at the district scale, yet a review of governmental studies and
publications suggested that that this type of data has not been updated recently, making its adoption
futile. Accordingly, in this study, data at the municipality scale was used to assess city vulnerability to
SUHI, as the available relevant data was more recent as well as approved by recognised official
authorities.
Five groups of populations vulnerable to SUHI were identified. No data was available on group 2,
“Populations with low access to infrastructure” or group 3, “Elderly populations above 65 years old”.
Accordingly, these two factors were excluded from the current research. As areas with higher densities
are more vulnerable to SUHI [39], however, another factor was added in this study to assess vulnerability
in Baghdad, population density. Accordingly, data was collected in relation to four factors:
 • Population poverty level.
 • Population density.
 • The number very young residents (below 5 years).
 • The number of health centres.

 8
4th International Conference on Engineering Sciences (ICES 2020) IOP Publishing
IOP Conf. Series: Materials Science and Engineering 1067 (2021) 012058 doi:10.1088/1757-899X/1067/1/012058

 Figure 6.
 Identifying
 groups
 vulnerable to
 surface urban
 heat island in
 Baghdad.
Most of the data and
base maps used in
this study were
from the Baghdad

Comprehensive City Development Plan 2030 (CCDP), a study conducted by the Mayoralty of Baghdad
under the supervision of the World Bank; Khatib and Alami was the consulting company responsible
for developing and implementing the plan [40]. The Baghdad Comprehensive City Development Plan
2030 provides detailed information about Baghdad city’s current situation, and by offering a
comprehensive view, the plan offers basic guidelines for the city’s future growth and defines the basic
requirements for this.
The available data is summarised in Table 2, which also explains how this data was used to assess the
areas vulnerable to SUHI in Baghdad. After examination of the available information, enough data was
identified for each Baghdad municipality, including density, the number of young residents, and the
number of health centres. However, no data was available concerning poverty levels at municipality
level, causing this factor to also be excluded from the vulnerability assessment in this study.
Using GIS ArcMap 10.4.1, all available data about the vulnerable factors was mapped. GIS ArcMap
offers the potential to analyse data and arrange areas according to selected factors such as population
density and kindergarten number, as these are essential in defining the vulnerability rate of each area
This program also offers the ability to overlay such maps on the SUHI impact map (step 1) to assess the
risk level (step 2). Figure 7 shows the Baghdad municipalities and their vulnerability to SUHI. The
municipalities shown in darker colours have higher rates of vulnerability, and vice versa.

 Table 2: Data on vulnerability factors in Baghdad.

 9
4th International Conference on Engineering Sciences (ICES 2020) IOP Publishing
IOP Conf. Series: Materials Science and Engineering 1067 (2021) 012058 doi:10.1088/1757-899X/1067/1/012058

 factor Factor Name Available Data Possibility of using data
 no.
 1 Population poverty Maps of poor population and These maps cannot be used, as they offer
 level. poverty rate /Nahiya. data at the scale of Baghdad Nahiya,
 which is bigger than required; no
 guidelines are offered in these maps to
 extract the required data. Accordingly,
 this factor is excluded from this study.
 2 Population density Tables of municipality areas These tables were used in calculating PD:
 (PD) or (population per (A) and populations (P) PD= P/A
 area).

 3 The number of very Map of existing educational This map was used to calculate the
 young population facilities. number of kindergartens in each
 (below 5 years). municipality, which can be used as an
 indicator for the number of residents
 below the age of 5.
 4 The number of health Map of existing health This map was used to calculate the
 centres. facilities. number of hospitals and health centres in
 each municipality, to be used as an
 indicator for the level of sick population.

 10
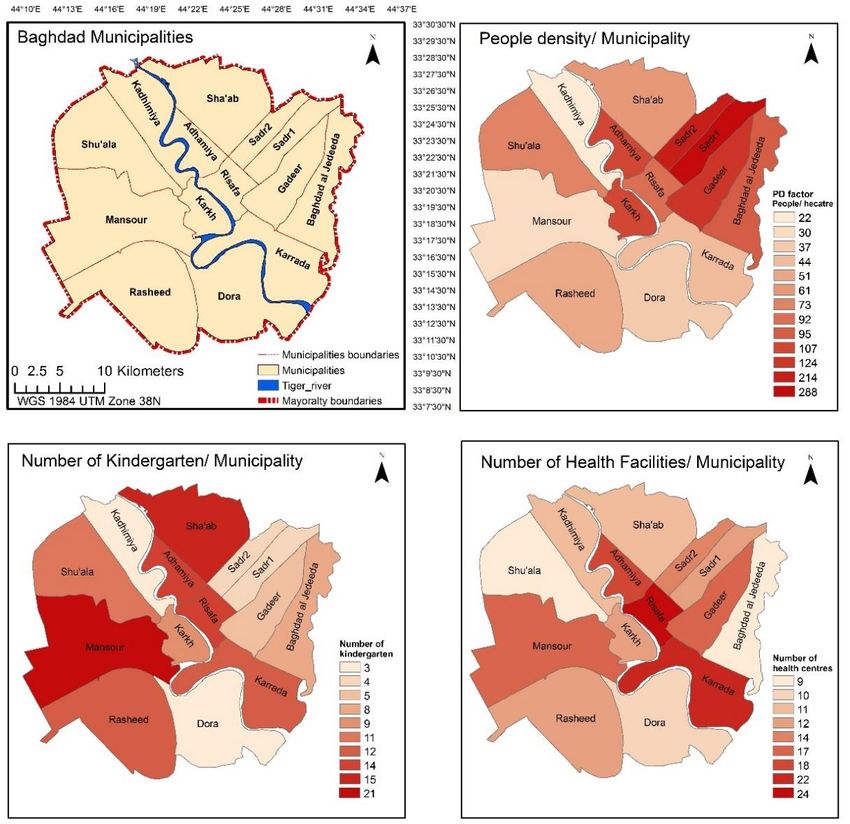
4th International Conference on Engineering Sciences (ICES 2020) IOP Publishing
IOP Conf. Series: Materials Science and Engineering 1067 (2021) 012058 doi:10.1088/1757-899X/1067/1/012058

 Figure 7. Maps of vulnerability factors in Baghdad.
In terms of population density (Figure 8), Sadr1 and Sadr2 represent the municipalities with the higher
rates, with 288 and 214 people/hectare, respectively. Kadhimiya and Mansour have the lowest rates,
with about 22 and 30 people/hectare, respectively. In general, the municipalities on the Al-Risafa side
of Baghdad are more densely populated than those on the Al-Karkh side. The differences between
population density values tend to increase gradually between neighbouring municipalities, however.

 350 288
 Number of people/ municipality

 300
 250 214
 200
 150 107 92 107 95 124
 100 61 51 73
 30 44 37 22
 50
 0

 Baghdad municipalities

 Figure 8. Population densities in Baghdad municipalities.

Using data about the number of kindergartens in each municipality as an indicator about the number of
very young residents reveals that both Sha'ab and Mansour have the highest values, with 21 and 15
kindergartens, respectively. The lowest value, 3, appears in both Kadhimiya and Dora municipalities
(Figure 9).

 25 21
 Kindergarten/ municipality

 20 15
 13 14
 15 12 12 11
 9 8
 10 5 4 4 3 3
 5
 0

 Baghdad municipalities

 Figure 9. Number of kindergartens in Baghdad municipalities.

In terms of the final factor, health centres in each municipality, Risafa appears in first place, with about
24 centres, while Shu'ala and Baghdad Al-Jedeeda being last with about nine centres (Figure 10). In
general, the number of health facilities on the Al-Risafa side is greater than on the Al-Karkh side.
The values for all vulnerability factors differ between Baghdad municipalities, with those being first
according to one factor often being last according to others. This confirms the importance of overlaying

 11
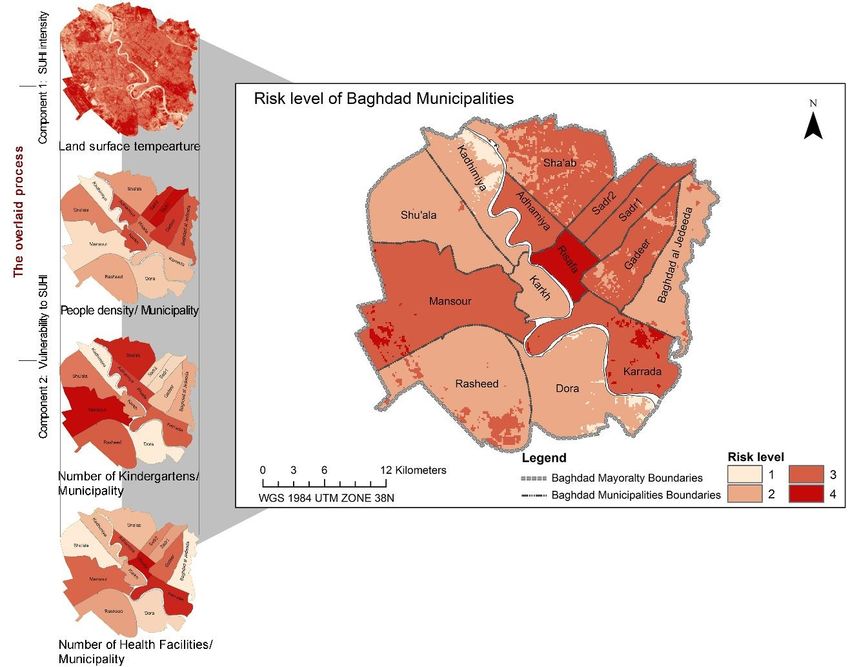
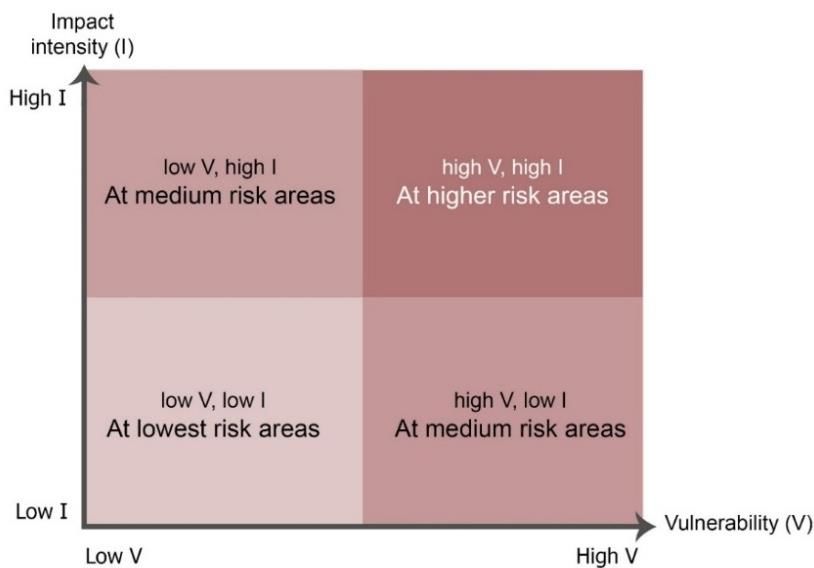
4th International Conference on Engineering Sciences (ICES 2020) IOP Publishing
IOP Conf. Series: Materials Science and Engineering 1067 (2021) 012058 doi:10.1088/1757-899X/1067/1/012058

maps of these factors to define those areas with higher risk rates, a process discussed in the next section
of this study.

 30 24
 Heath center/ municipality

 25 22
 17 18 17
 20 15 14
 15 12 12 12 11
 9 9 10
 10
 5
 0

 Baghdad municipalities

 Figure 10. Number of health centres in Baghdad municipalities.

3.3 Identifying Risk Levels
To identify risk levels, the two components of SUHI intensity (land surface temperature) (Figure 4) and
area vulnerability (population density, number of kindergartens, and number of health centres) (Figure
7) were overlaid. Areas with both higher SUHI impact and vulnerability represent higher risk and should
thus have priority in the adaptation process (Figure 11).
The overlaying process was achieved using GIS ArcMap to assist in producing a map of risk level and
defining those areas at higher and lower risk. Figure 12 shows the overlay process. SUHI risk is divided
into four levels. Level one, the lightest colours in the map, represents areas with a minimum value of
risk, while level four, which is shown by the darker colours, represents the maximum value of climate
change risk.

 12
4th International Conference on Engineering Sciences (ICES 2020) IOP Publishing
IOP Conf. Series: Materials Science and Engineering 1067 (2021) 012058 doi:10.1088/1757-899X/1067/1/012058

 Figure 11. Risk assessment levels.
 Figure 12. Maps of risk levels in Baghdad areas.
4. Results
The assessment of risk in Baghdad revealed that more than half of the city municipalities suffer from
high values of risk (level 3 and 4). Most of these municipalities are located on the Al-Risafa side of
Baghdad, which returns higher values of both SUHI intensity and most of the vulnerable factors.
Three areas with the highest value of risk (level 4) were identified: Risafa, the northeast of Karrada, and
the southwest of Mansour. These areas have higher rates of SUHI intensity and vulnerability ad urgently
require the application of sustainable adaptation measures due to the existence of various populations
susceptible to being harmed by the impacts of increasing temperature in these urban areas. These thus
represent the optimal locations for the first thrust of adaptation plans.
Reviewing Baghdad land use maps [18] showed that most areas with the highest levels of risk form
essential vital areas in Baghdad. Risafa, for example, includes the city’s major wholesale markets which
form the country’s largest commercial area. This area also contains the main universities and hospitals
that offer services at the city level. Such uses indicate a higher level of outdoor activities during the
daytime. Risafa also has high historical value, being a major destination for local and foreign tourists.
Secondary trade-offs should be conducted between areas with the highest levels of climate change risk
to shrink the options and define the areas with the highest need for sustainable adaptation strategy
application.
The lowest value of risk (level 1) was shown in the form of scattered small islands in both Dora and
Kadhimiya; these areas have not yet been fully urbanised and still have some wide green areas in the

 13
4th International Conference on Engineering Sciences (ICES 2020) IOP Publishing
IOP Conf. Series: Materials Science and Engineering 1067 (2021) 012058 doi:10.1088/1757-899X/1067/1/012058

form of palm groves. Measures should be taken to preserve the vulnerable factors in these areas by
implementing processes of protection, enrichment, and uplift oriented towards retaining and promoting
the remaining green areas to keep these areas safe from many of the adverse impacts of SUHI.
5. Conclusions
For sustainable results in the field of climate change adaptation to be developed, measures cannot be
adopted randomly; they must follow the logic and begin where there is the greatest necessity for a rapid
solution. Assessment of climate change risk should thus organise areas according to their need for urgent
sustainable adaptation strategies. Accordingly, this research aimed to assess the risk levels in Baghdad
as a first step towards developing a map to control the phenomenon of Surface Urban Heat Islands
(SUHI), which have been previously observed in the city. Using GIS ArcMap and local available data,
the factors of such a risk assessment were mapped, analysed, and overlaid, with results showing that the
higher levels of risk are found in Risafa, the northeast of Karrada, and the southwest of Mansour. These
areas have have higher values of both SUHI intensity and vulnerability, and continuing to accumulate
population and activities in these neighbourhoods will transform them into uninhabitable and
excessively overheated areas. Urgent plans are thus required to control and reduce the negative impacts
of SUHI in these areas; measures should also be taken to preserve those areas with the lower values of
risk is such a state, with no more urbanisation or housing development allowed until environmental
impacts are carefully studied. This accurate assessment of local risk should thus allow environment and
socio-economic revenues to be increased while lowering potential losses to a minimum.

6. References

[1] IPCC, “Climate Change 2001: Impacts, Adaptation and Vulnerability,” IPCC Third Assessment
 Report, Cambridge University Press, 2001 .
[2] J. Berthold and M. H. Wetterwik , Examining the Ecocity:- From Definition to Implementation,
 Sweden.: Bachelor of Science Thesis, 2013.
[3] E. W. Sulzman, The Carbon Cycle, USA: University Corporation for Atmospheric Research,
 2000.
[4] UNFCCC, “Climate Change: Impacts, Vulnerabilities and Adaptation in Developing Countries,”
 Climate Change Secretariat (UNFCCC), Bonn, Germany., 2007.
[5] UNFCCC, “Climate Action and Support Trends, Based on National Reports Submitted to The
 UNFCCC Secretariat,” https://unfccc.int, Bonn, Germany, 2019.
[6] IPCC, “Annex II: Glossary,” in In: Climate Change 2014: Synthesis Report. Contribution of
 Working Groups I, II and III to the Fifth Assessment Report of the Intergovernmental Panel on
 Climate Change, Geneva, Switzerland, 2014b, pp. 117-130.
[7] N. Mimura, “Perspectives and Issues of Adaptation as Responses to Global Warming,” Global
 Environmental Research, vol. 11, no. 1, pp. 103-110, 2006.
[8] O.-D. Cardona, M. . K. van Aalst , J. Birkmann, M. Fordham , G. McGregor , R. Perez, R. S.
 Pulwarty , S. F. E. Lisa and T. B. Sinh, “Determinants of Risk: Exposure and Vulnerability,” in
 Managing the Risks of Extreme Events and Disasters to Advance Climate Change Adaptation, A
 Special Report of Working Groups I and II of theIntergovernmental Panel on Climate Change
 (IPCC)., Cambridge, UK, and New York, NY,, Cambridge University Press, 2012, pp. 65-108.
[9] UNFCCC, “Assessing the Costs and Benefits of Adaptation Options: an Overview of
 Approaches,” http://unfccc.int/adaptation, Bonn, Germany, 2011.
[10] UNDP, Adaptation Policy Frameworks for Climate Change: Developing Strategies, Policies and
 Measures, Cambridge, UK: The Press Syndicate of The University of Cambridge, 2004.

 14
4th International Conference on Engineering Sciences (ICES 2020) IOP Publishing
IOP Conf. Series: Materials Science and Engineering 1067 (2021) 012058 doi:10.1088/1757-899X/1067/1/012058

[11] R. El-Sayed and Z. Al-Barazanji, “Mann–Kendall Trend Analysis of Surface Air Temperatures
 and Rainfall in Iraq,” IDŐJÁRÁS: Quarterly Journal of the Hungarian Meteorological Service,
 vol. 119, no. 4, p. 493–514, 2015.
[12] H. I. Abd AlKareem, “Assessing of Climate Change on Iraq using Meteonorm Weather
 Generator,” IOSR Journal of Applied Physics (IOSR-JAP), vol. 8, no. 6, pp. 55-61, 2016.
[13] A. M. Al-Lami, “Study of Urban Heat Island Phenomena for Baghdad City Using Landsat- 7,”
 Diyala Journal for Pure Science, vol. 11, no. 2, pp. 82-98, 2015.
[14] J. M. Ali, S. H. Marsh and M. J. Smith, “A Comparison Between London and Baghdad Surface
 Urban Heat Islands and Possible Engineering Mitigation Solutions,” Elsevier - Sustainabile
 Cities and Society, vol. 29, pp. 159-168, 2017.
[15] EPA, Reducing Urban Heat Islands: Compendium of Strategies, USA: EPA Publication
 available at (www.epa.gov, 2013.
[16] Iraqi Environmental Ministry, “'The state of the environment in Iraq 2017,” Iraqi Environmental
 Ministry, Baghdad, 2017.
[17] “www.latlong.net,” 2019. [Online].
[18] Khatib and Alami, “Baghdad Comprehensive Development Plan 2030, fourth stage, part 1,”
 Baghdad Municipality, 2014.
[19] G. J. v. Oldenborgh, “archive.is,” 2012. [Online]. Available: https://www.knmi.nl/over-het-
 knmi/about.
[20] W. Köppen, “Die Wärmezonen der Erde, nach der Dauer der heissen, gemässigten und kalten
 Zeit und nach der Wirkung der Wärme auf die organische Welt betrachtet, (translated paper
 published in 2011),” Meteorologische Zeitschrift, vol. 20, no. 3, p. 351–360, 1884.
[21] N. Salman, Towards Optimal Design Strategies in Hot-Arid Climate, A Comparative Study of
 Environmental and Socio-Cultural Performance of The Traditional and Modern Housing in
 Baghdad, IRAQ, Cardiff, Wales: Welsh School of Architecture, Cardiff University, 2016.
[22] S. Ridha, S. Ginestet and S. Lorente, “Effect of the Shadings Pattern and Greenery Strategies on
 the Outdoor Thermal Comfort,” International Journal of Engineering and Technology, vol. 10,
 no. 2, pp. 108-114, 2018.
[23] D. Crichton, “The Risk Triangle,” in Natural Disaster Management, London, Tudor Rose, 1999,
 pp. 102-103.
[24] T. E. Downing and A. Patwardhan, “Assessing Vulnerability for Climate Adaptation,” in
 Adaptation Policy Frameworks for Climate Change: Developing Strategies, Policies, and
 Measures , Cambridge, Cambridge University Press, 2004.
[25] EPA, Reducing Urban Heat Island: Compendium of Strategies, 2013.
[26] S. Zakhour, “The Impact of Urban Geometry on Outdoor Thermal Comfort Conditions in Hot-
 arid Region,” Journal of Civil Engineering and Architecture Research, vol. 2, no. 8, pp. 862-
 875, 2015.
[27] A. M. Al-Lami, “Study of Urban Heat Island Phenomena for Baghdad City using Landsat- 7,”
 Diyala Journal for Pure Science, vol. 11, no. 2, pp. 82-98, April 2015.
[28] S. E. D. M. El-Ojaly, “Spatial Structure and Its Effect on the Thermal Variation in Benghazi
 1984-2012,” Global Libyan Journal, vol. 4, 2015.
[29] M. F. Abdulateef and H. A. S. Al-Alwan, “Assessment of surface urban heat island intensity and
 its causes in the city of Baghdad,” in IOP Conference Series: Materials Science and
 Engineering, Baghdad, 2020.

 15
4th International Conference on Engineering Sciences (ICES 2020) IOP Publishing
IOP Conf. Series: Materials Science and Engineering 1067 (2021) 012058 doi:10.1088/1757-899X/1067/1/012058

[30] N. Mimura, H. Ando, S. Emori, T. Ochiai, K. Hitoshi, M. Tanaka, K. Nakata, T. Hasegawa, Y.
 Hijioka and K.-i. Fujita, “Approaches to Climate Change Adaptation,” The Committee on
 Approaches to Climate Change Adaptation, Japan, 2010.
[31] L. Schipper, W. Liu , D. Krawanchid and S. Chanthy , Review of Climate Change Adaptation
 Methods and Tools, MRC Technical Paper No.34, Vientiane: Mekong River Commission, ISSN:
 1683-1489, 2010.
[32] M. Beniston, “Climate Change and Its Impacts: Crowing Stress Factors for Human Societies,”
 International Review of The Red Crose, vol. 92 , no. 879 , pp. 557-568, 2010.
[33] EPA, The Effect of Climate Change on Water Resources and Program, Watershed Academy
 Web , 2009.
[34] M. Nuruzzaman, “Urban Heat Island: Causes, Effects and Mitigation - A Review,” International
 Journal of Environmental, vol. 3, no. 2, pp. 67-73, 2015.
[35] J. A. Voogt, “Urban heat islands: hotter cities,” America Institute of Biological Sciences..
[36] T. R. Oke, “The Urban Energy Balance,” Progress in Physical Geography, vol. 12, pp. 471-508,
 1988.
[37] H. Akbari, L. Gartland and S. Konopacki, Measured energy savings of light colored roofs:
 Results from three California demonstration sites: Lawrence Berkeley National Lab, Berkeley,
 CA (United States): Environmental Energy Technologies Div., 1998.
[38] B. A. Norton, A. M. Coutts, S. J. Livesley, R. J. Harris, A. M. Hunter and N. S. Williams,
 “Planning for cooler cities: A framework to prioritise green infrastructure to mitigate high
 temperatures in urban landscapes,” Landscape and Urban Planning, vol. 134, p. 127–138, 2015.
[39] A. Ramírez-Aguilar and L. C. L. Souza, “Urban form and population density: Influences on
 Urban Heat Island intensities in Bogotá, Colombia,” Urban Climate, vol. 29, p. 100497, 2019.
[40] Khatib and Alami, “Comprehensive development plan for the city of Baghdad 2030 : the basic
 report for the first phase, part 1,” Baghdad Municipality, Baghdad, 2008a.

 16
You can also read