Domestic cats' effect on urban wildlife-using citizen science and camera traps - Epsilon Archive for ...
←
→
Page content transcription
If your browser does not render page correctly, please read the page content below
Domestic cats’ effect on urban
wildlife
– using citizen science and camera traps

 Kajsa Johansson

Master’s thesis • 30 credits
Swedish University of Agricultural Sciences, SLU
Department of Wildlife, Fish, and Environmental Studies
Forest Science programme
Examensarbete/Master's thesis, 2021:3
Umeå 2021
Domestic cats’ effect on urban wildlife – using citizen science
and camera traps
Kajsa Johansson
Supervisor: Tim Hofmeester, Swedish University of Agricultural Sciences,
Department of Wildlife, Fish, and Environmental Studies
Assistant supervisor: Joris Cromsigt, Swedish University of Agricultural Sciences,
Department of Wildlife, Fish, and Environmental Studies
Examiner: Navinder Singh, Swedish University of Agricultural Sciences,
Department of Wildlife, Fish, and Environmental Studies
Credits: 30 credits
Level: Second cycle, A2E
Course title: Master’s thesis in Forest Science
Course code: EX0968
Programme/education: Forest Science programme
Course coordinating dept: Department of Wildlife, Fish, and Environmental Studies
Place of publication: Umeå
Year of publication: 2021
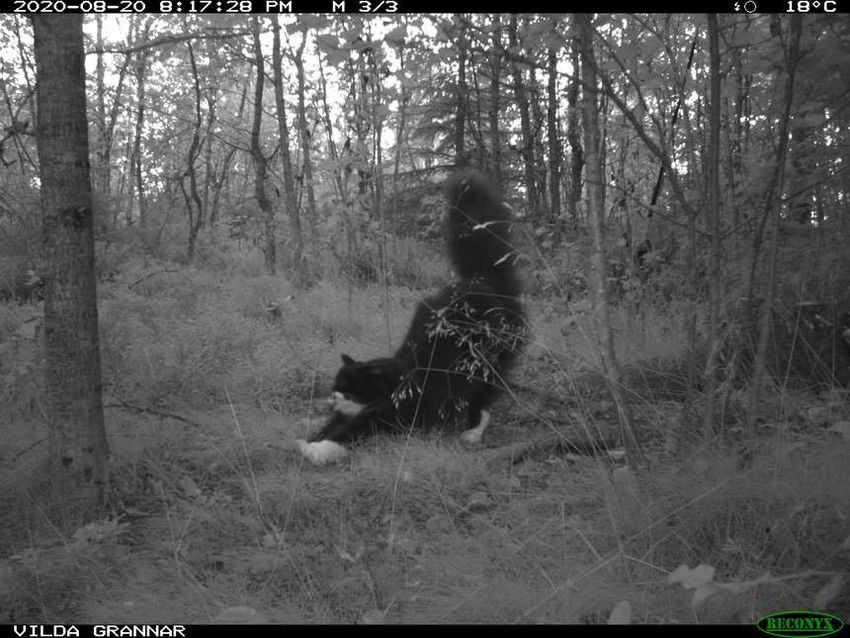
Cover picture: From camera trap
Title of series: Examensarbete/Master's thesis
Part number: 2021:3
Keywords: Domestic cat, Felis catus, camera traps, citizen science, visitation
frequency
Swedish University of Agricultural Sciences
Faculty of Forest Sciences
Department of Wildlife, Fish, and Environmental Studies
Approved students’ theses at SLU are published electronically. As a student, you
have the copyright to your own work and need to approve the electronic publishing.
If you check the box for YES, the full text (pdf file) and metadata will be visible
and searchable online. If you check the box for NO, only the metadata and the
abstract will be visible and searchable online. Nevertheless, when the document is
uploaded it will still be archived as a digital file.
   If you are more than one author you all need to agree on a decision. Read about
SLU’s publishing agreement here: https://www.slu.se/en/subweb/library/publish-
and-analyse/register-and-publish/agreement-for-publishing/.

☒ YES, I/we hereby give permission to publish the present thesis in accordance
with the SLU agreement regarding the transfer of the right to publish a work.

☐ NO, I/we do not give permission to publish the present work. The work will still
be archived and its metadata and abstract will be visible and searchable.
Abstract

 Europe has transformed from areas dominated by agricultural and rural to gradually becoming
urban communities. With the development in urban and suburban areas, more non-native species
have increased, especially domestic species, about 25% of all Swedish households obtain one or
more cats. Domestic cats (Felis catus) have contributed to extinction and endangerment of several
species of birds, mammals, and reptiles, and constitute a risk for species that are endangered or
threatened worldwide. However, the high density of domestic cats in urban areas indicates higher
predation on wildlife compared to rural areas with lower densities of domestic cats. Several earlier
studies around the world have found evidence that the domestic cat has a negative effect on wildlife,
especially avian species. In Sweden, very few studies have been done in the subject on wildlife and
its correlation to housing density and domestic cat visitation frequency. This thesis aims to
investigate if there is a correlation between wildlife visitation frequency, domestic cats and housing
density, using citizen science and camera traps. The data were collected in Umeå municipality,
northern Sweden and the analysis was tested on five wildlife species and one species groups using
a generalised linear mixed model and divided the domestic cat’s visitation frequency into two
categories high or low, testing for a nonlinear correlation. I found more Eurasian magpies in
locations with a low visitation frequency of domestic cats. In contrast to my expectation, songbirds
as a species group showed the opposite pattern, being more common in locations with more cats.
The results also show a positive correlation with housing density for both domestic cats and Eurasian
magpies. By knowing how the different species explore or avoid areas where the domestic cat has
higher visitation frequency can give support when planning to urbanise new areas, and before
creating more suburban areas have an insight on the wildlife living there and with the domestic cat
is coming to affect wildlife species if domestic cats get a high abundance in that area.

Keywords: Domestic cat, Felis catus, camera traps, citizen science, visitation frequency
Table of contents

List of figures ....................................................................................................................... 6

Abbreviations ....................................................................................................................... 7

1.      Introduction ................................................................................................................ 8

2.      Materials and method ................................................................................................ 11

         2.1.       Study area and camera trapping ....................................................................... 11
         2.2.       Classification ................................................................................................. 12
         2.3.       Analysis ........................................................................................................ 13
             2.3.1.          QGIS and housing density ...................................................................... 13
             2.3.2.          Statistical analysis ................................................................................. 14

3.      Result ........................................................................................................................ 15

         3.1.       Wildlife and domestic cat visitation frequency .................................................. 15
         3.2.       Housing density ............................................................................................. 19

4.      Discussion............................................................................................................... 20

References ....................................................................................................................... 24

Acknowledgements............................................................................................................. 27

Appendix 1 ......................................................................................................................... 28

Appendix 2 ......................................................................................................................... 29
List of figures
Figure 1: A map over the study area Umeå municipality, the red dots are camera
trap locations from the project- ‘Meet your wild neighbours’. ..............................11
Figure 2: Camera trap locations and their level of urbanization. Although the
analysis was done using a continuous scale for housing density, I divided housing
density into different urbanization classes for graphical purposes following Parsons
et al. (2018). The urbanization classes are “Urban (Abbreviations
EU European Union
GLMM Generalized Linear Mixed Model
PIR Passive infrared
SLU Swedish University of Agricultural Sciences
SMHI Swedish Meteorological and Hydrological Institute
UN United Nation
71. Introduction
Europe has transformed from areas dominated by agricultural and rural areas to
gradually becoming urban communities. Urban areas have always drawn people for
work employment and by 1950 at least half of the European population had a
permanent residence in urban regions according to the united nation (UN). It is
projected that by 2050 two-thirds of the world’s population will have permanent
residence in urban areas (Koceva et al. 2016). With more cities, scattering and
population number in the cities increasing have led to more people moving from
larger cities to suburban or pre-urban areas instead (Dijkstra et al. 2016).
Consequently, with new locations for suburban and pre-urban areas makes it more
difficult to separate the two areas from each other. What used to be forest and well-
functioning ecosystem, have been replaced with cities and villages to acclimate the
human population growth (Parsons et al. 2018). To preserve and increase
biodiversity in cities and reduce the destructive effects of urbanisation cities has
established so-called green spaces. The green spaces include native vegetation and
untouched surfaces and connecting the green spaces with corridors and domestic
gardens through urban areas increase wildlife movement (Gaston et al. 2007). The
countryside close to cities were urbanised and included in larger cities where green
areas used to be dominated has become smaller or not existing (Lilja 1994) this led
to a decreasing number of species and lower species richness in the urbanised areas.
With the development in urban and suburban areas, more non-native species have
increased, especially domestic species (McKinney 2002). Domestic cats (Felis
catus) ownerships is superior in urban regions and can develop extremely high cat
populations compare to rural regions (Hanmer et al. 2017).
The domestic cat is seen as an invasive species that has become one of the most
omnipresent and environmentally destructive species in the world (Loss & Marra
2017). Domestic cats have contributed to extinction and endangerment of several
species of birds, mammals, and reptiles, and constitutes a risk for species that are
endangered or threatened worldwide. Mainly the introduction of domestic cats on
smaller islands (Sims et al. 2008) has a negative effect on native species that are not
used to predators (Loss & Marra 2017). The domestic cat has a comparable behaviour
to the wildcat (Felis Silvestris Silvestris), and that comparable behaviour creates a
8prospective of negative correlation between domestic cats’ densities with avian
densities. However, the high density of domestic cats in urban areas indicates higher
predation on wildlife compares to rural areas with lower densities of domestic cats
(Sims et al. 2008). The number of prey for each domestic cat in urban areas is low,
although with high cat density the predation in urban areas is significant negative
on prey species (Baker et al. 2008). Ground dwelling birds have a higher predation
rate by the domestic cats regardless of species. Avian species visiting feeding
stations are more vulnerable to predation but visiting a garden is no increased risk
to become prey by the domestic cat (Pavisse et al. 2019). The domestic cat can have
a high population number in urban regions where they are not limited by prey
availability. Since the domestic cat is provided food and shelter by their owners the
domestic cat does not require predation to survive (Woods et al. 2003). With no
limitation in food and shelter, the domestic cat population can reach extremely high
densities (Tschanz et al. 2011) in urban regions compared to rural and wild regions
(Baker et al. 2008). The number of prey from domestic cats is hard to completely
know, but it is believed that each domestic cat has three times more prey compared
to the number of prey owners register (McDonald et al. 2015). The high densities
of domestic cat have created a concern to if the predation pressure will increase and
be too strong (Tschanz et al. 2011).
Sweden is not the most populated country in Europe, but it has the greatest rural
and urban growth of all the European Union (EU) members (Dijkstra et al. 2016).
Approximately 25% of all Swedish households obtain one or more cats and several
domestic cats are free-roaming cats. To help the domestic cat get a higher status in
Sweden’s society new animal welfare regulations have been introduced in June
2020. The regulations contain sharper rules on castration and sterilization on cats
allowed staying outside to minimize free-roaming cats (Jordbruksverket, 2020). In
Sweden, little research has been done on the domestic cat and their effect on
wildlife. Given that Sweden has a large population of domestic cats with and
without homes, they are becoming part of the Swedish ecosystem. Knowledge of
the interaction of the domestic cat with wildlife and urbanisation levels can
contribute to landscape planning (Hanmer et al. 2017) and understanding of the
position of the domestic cat in Swedish ecosystem.
Several articles around the world have tested the domestic cat predation and
correlation with urbanisation and have discovered a correlation between domestic
cats and urbanisation (van Heezik et al. 2010; Hanmer et al. 2017; Pavisse et al.
2019). Very few of these articles test the wildlife visitation frequency correlation
to domestic cats and only test the correlation with avian species (Sims et al. 2008;
Blancher 2013; Pavisse et al. 2019). Therefore, in this thesis, I study the domestic
cat effect on wildlife in different urbanised areas. The aim I have for this the is to
investigate (i) if wildlife visitation frequency has a correlation with cat visitation
9frequency in a garden and (ii) if the effects of domestic cats on distinct wildlife
groups differ among urbanisations. I hypothesise that (i) Wildlife visitation
frequency is lower in areas with high cat visitation frequency compared to areas
with low cat visitation frequency, and (ii) Domestic cats have a larger negative
effect on birds and smaller mammals and no effect on ungulates in more urbanised
areas compared to areas with lower urbanisation.
102. Materials and method
2.1. Study area and camera trapping
In this project, I used a combination of camera traps and citizen science to collect
data on cat density and wildlife presence in gardens around Umeå municipality,
sited in Västerbotten county, Sweden. Umeå municipality has had a strong
population increase and the total number of people living in Umeå municipality
2020 was 128 901. During the last five years, 2015–2020, have the population in
Umeå increased with approximately 1850 inhabitants per year (Umeå Kommun,
2020).
©OpenStreetMap ©Swedish University of Agricultural Sciences.
Figure 1: A map over the study area Umeå municipality, the red dots are camera trap locations
from the project- ‘Meet your wild neighbours’.
11The camera traps were part of a citizen science project ‘Meet your wild
neighbours’ by Swedish University of Agricultural Sciences (SLU). The project
investigated what wild animals are living in Umeå municipality. There was a total
of 147 participants in the project (Figure 1). The Meet your wild neighbours -project
started in the middle of September 2019 and ran until the beginning of November
2020. The participants had the camera traps for one month before returning the
camera but were allowed to participate several times during the project, and at most
one participant participated four times. The camera traps used in the project were
of the model Reconyx Hyperfire HC500 with a passive infrared (PIR) sensor. The
PIR sensors were set to trigger at the highest sensitivity (to detect the slightest
movement) and when the PIR sensor was triggered it took 3 images on ‘rapid-fire’
with no delay between triggers. To control the function of the cameras they were
set to take a time-lapse control image at midday (12:00) and midnight (24:00). The
setup for the cameras was following Parsons et al. (2018) method. All participant
in the project got the instruction to place the camera perpendicular and parallel to
the ground at a hight of 40 centimetres above ground (knee height), to increase
detection of smaller species (Parsons et al. 2018). The citizens were also asked to
place the camera in their garden or private land, and avoid facing the camera
towards public land, compost or supplement feeding stations.
2.2. Classification
To classify the images, I used an open-source web application called TRAPPER.
On TRAPPER, all the images were sorted after the participant's number and
coordinates. Classifying images in TRAPPER, I first define the observation type, if
it was an animal, human or vehicle on the images. If the image contained one or
more animals the species was classified by English and Latin name (Bubnicki et al.
2016). The total number of individuals of the same species in the image was
counted. In some images, the resolution was too blurry to identify the species or the
animal was too far away to determine the species and therefore classified as other.
I determined the species sex and age if it was possible to determine in the image.
Images taken less than 15 minutes apart could be classified in sequences, which
often happened if an animal stayed and triggered the camera trap several times in a
row (Bubnicki et al. 2016). The animal(s) in the image was counted only once,
although the individual(s) was leaving the image and reappearing again. For each
location, I also did an individual recognition of domestic cats, to get an idea of the
number of cats in each garden.
122.3. Analysis
2.3.1. QGIS and housing density
The locations from the camera traps were exported from TRAPPER into QGIS
(QGIS version 3.42, QGIS Development Team 2009). I used a layer provided by
Umeå municipality which includes all the buildings in the municipality. I created a
buffer zone around the camera trap locations (Figure 2) of 1 square kilometre, and
then calculated the number of houses within that buffer to get the housing density
for each location. This housing density was used as a proxy for urbanisation, similar
to previous studies (Parsons et al. 2018).
©OpenStreetMap
©OpenStreetMap©Swedish
©SwedishUniversity
UniversityofofAgricultural
AgriculturalSciences.
Sciences
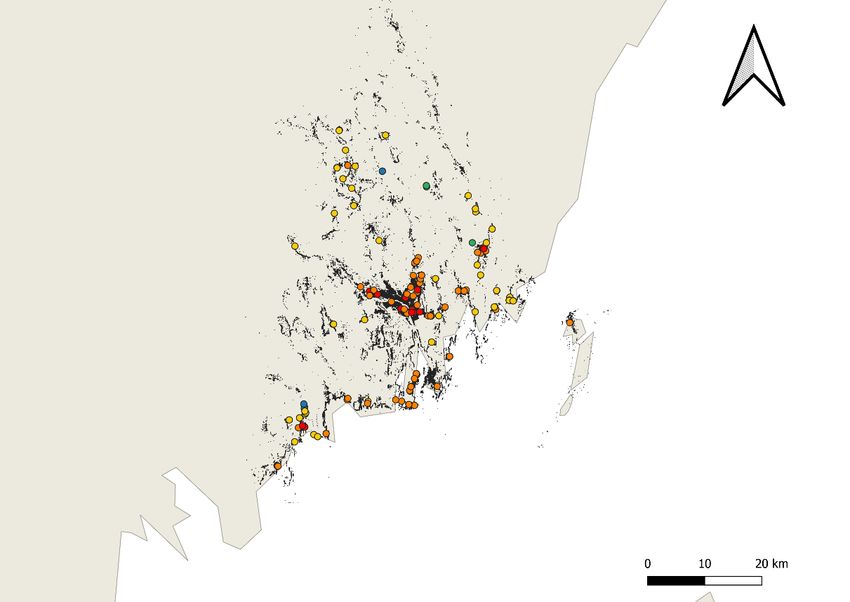
Figure 2: Camera trap locations and their level of urbanization. Although the analysis was done
using a continuous scale for housing density, I divided housing density into different urbanization
classes for graphical purposes following Parsons et al. (2018). The urbanization classes are “Urban
(2.3.2. Statistical analysis
To test both of my hypotheses in R studio (RStudio Team, 2020) using a
generalised linear mixed model (GLMM) (Kays et al. 2017; Parsons et al. 2018)
with a Poisson distribution, since I had count data and I added a log-link function
using the lme4 package (Bates et al. 2020) I added the log-link function (log10) on
the number of camera trapping days as an offset to the model to correct for
differences in camera effort. I did this since not everyone that participated had the
camera active for the whole month. As some participants deployed a camera
multiple times and in the same location, I added a random intercept per location to
correct for multiple measurements at the same location. I only tested species that
were recorded in a minimum of 15 locations, with the lowest number of 40 per site
to circumvent issues of zero-inflation or model convergence. Since the project Meet
your wild neighbours were operating between September 2019 and November
2020, camera images were distributed throughout all seasons. I tested for a
difference in visitation frequency in the winter season (1 November – 30 April)
compared to non-winter season (1 May – 31 October). The classifications of winter
and non-winter seasons derives from the Swedish meteorological and hydrological
institute (SMHI) definition of winter (SMHI, 2020). I did this to incorporate
potential differences in wildlife visitation frequency as a consequence of domestic
cats’ activity under the winter season. To test for a potential non-linear response to
domestic cats, I tested if wildlife visitation frequency differed between locations
with a high or low cat visitation frequency, where I separated for high and low
visitation frequency taking locations above or below the median cat visitation
frequency.
143. Result
3.1. Wildlife and domestic cat visitation frequency
The total number of cameras used was 111, out of 147, and the average number
of days a camera was active were 32 days (minimum = 17 days maximum = 78
days). I could not use all the camera traps as some of the participants failed to follow
the instructions. Cameras were not included if they were facing feeding stations,
compost areas or not placed horizontal, aimed too high or too low. Participants
living outside of Umeå municipality were not included in the analysis. The average
housing density was 412 (minimum= 0, maximum = 1,413) houses per square
kilometre, the majority of the locations were in suburban areas (Figure 3).
Figure 3:The number of locations classified in each urbanization gradient, using Parsons et al.
(2018) classification.
15The number of individual domestic cats per camera location ranged from 0 to 5
(average = 1.2). When testing the correlation between the domestic cat and housing
density, I found a positive correlation, beta = 2.0, p = < 0.001 (Figure 4).
Figure 4: Partial residual plot of the estimates Domestic cat visitation frequency increased with
housing density. The plot shows the prediction from the GLMM with a 95% confidence interval.
There were in total 47 mammal and bird species caught on the camera traps. I
tested five species and 1 group of species out of the 47 detected species (Table 1).
The species I tested in my models were: Eurasian magpie (Pica pica, 625
observations), great tit (Parus major, with 116 observations), mountain hare (Lepus
timidus, with 96 observations), red fox (Vulpes vulpes, with 58 observations), roe
deer (Capreolus capreolus, with 468 observations). To get sufficient data on
songbirds I tested them together as a combined species group with 281
observations.
Table 1: The number of total observations for the wildlife species tested in the model (GLMM)
Species Number of total observations
Eurasian magpie, Pica pica 625
Great tit, Parus major 116
Mountain hare, Lepus timidus 96
Red fox, Vulpes vulpes 58
Roe deer, Capreolus capreolus 468
Songbirds 281
Bohemian waxwing, Bombycilla garrulus 1
Brambling, Fringilla montifringilla 12
Chaffinch, Fringilla coelebs 3
Common blackbird, Turdus merula 21
Eurasian blue tit, Cyanistes caeruleus 2
16Species Number of total observations Eurasian jay, Garrulus glandarius 2 Eurasian tree sparrow, Passer montanus 5 European robin, Erithacus rubecula 25 Fieldfare, Turdus pilaris 52 Great tit, Parus major 116 Mistle thrush, Turdus viscivorus 2 Redwing, Turdus iliacus 2 Song thrush, Turdus philomelos 11 Spotted Nutcracker, Nucifraga caryocatactes 15 White wagtail, Motacilla alba 5 Yellowhammer, Emberiza citrinella 7 Testing the correlation of wildlife species and high or low domestic cat visitation frequency, I found a correlation with two species (Figure 5). Eurasian magpie had a higher visitation frequency in locations with below average cat visitations, beta = 0.88, p =
Figure 6: Eurasian magpies showed higher visitation frequency in locations with below average cat
visitation frequency. The plot shows the prediction from the GLMM with a 95% confidence interval.

Figure 7: Songbirds showed lower visitation frequency in locations with below average cat
visitation frequency. The plot shows the prediction from the GLMM with a 95% confidence interval.

                                                18
3.2. Housing density
Figure 8: Plot of the coefficient estimates and their 95% confidence interval of the correlation
between model species and housing density.
Since the domestic cat had a positive correlation with housing density, I was not
able to run a model with both domestic cat and housing density because of the
correlation. Instead, I tested the species correlation with housing density without
including domestic cats as a factor. I only detected a correlation between Eurasian
magpies and housing density (Figure 8). Eurasian magpie’s visitation frequency
increased with housing density, beta = 1.1, p = < 0.001 (Figure 9). For some
species, I found a difference between winter and non-winter season (Appendix 1).
Figure 9: A partial residual plot showing how Eurasian magpie visitation frequency increased with
housing density. The plot shows the prediction from the GLMM with a 95% confidence interval.
194. Discussion
I found that the visitation frequency of Eurasian magpies was higher in locations
with below average cat visitations (Figure 6). In contrast to my expectation, I found
the opposite pattern for songbirds (figure 7). For all other species, I did not find a
correlation with domestic cat visitations (Figure 5). When I tried to answer my
second research question, if the effects of domestic cats on distinct wildlife groups
differ among urbanisation levels, I found a positive correlation between domestic
cat visitation frequency and housing density (Figure 4). Because of this correlation,
I was not able to test for that question and instead I tested the species correlation
with housing density. The result for the model testing the correlation with housing
density, I found not only the domestic cat’s positive correlation but also that
Eurasian magpies had a positive correlation with housing density (Figure 8; Figure
9).
For all species apart from Eurasian magpies and songbirds, I did not discover a
correlation with high or low visitation frequency by domestic cats (Figure 4). The
reason may be that something else is more important and the species have a
correlation with for example availability to food or shelter (Duduś et al. 2014)
rather than a correlation with the domestic cats. Some avian species can correlate
with another avian species, even if the two avian species have different ecology
(Evans et al. 2009) can the competition between the species have a stronger
correlation than domestic cats presents in a garden or housing density. The fact that
I found that Eurasian magpies had a lower visitation frequency in locations with
above average cat visitations makes it possible to confirm my hypothesis that
wildlife visitation frequency is lower in areas with high cat visitation frequency
compared to areas with low cat visitation frequency. Corvid species (including the
Eurasian magpie) are more neophobic than other bird species, and sceptical to new
feeding places and are avoiding objects or other species they don’t have control
over (Greggor et al. 2016) and can therefore actively choose to avoid gardens with
high visitation frequency by domestic cats’, as they had problems with controlling
the domestic cats. Eurasian magpies have a positive correlation with housing
density it seems to be favourable for them to exist in more urban areas than in rural
or wild, despite the danger and predation risk (Yamaç & Kırazlı 2012). In urban
20areas the magpies has easier to predate on songbirds nests (Groom 1993) and are
not as limited by food as in rural or wild areas. Humans usually have a supplement
feeding station for songbirds where the Eurasian magpie also can find food.
Eurasian magpies have created co-existence with humans (Yamaç & Kırazlı 2012)
and, as a result, the positive correlation with housing density may be easier, as
humans are not a threat to magpies.
In contrast to my expectation, I found a higher visitation frequency of songbirds
in locations with above average cat visitations. An explanation for this can be
supplementing feeding stations provided by humans in gardens (Fattorini et al.
2018; Lee et al. 2019). Supplement feeding stations for avian species increases the
avian population in urban areas even if domestic cats are abundant in these areas
(Sims et al. 2008). The predation risk by domestic cats is higher on avian species
visiting feeding stations instead of only visiting a garden (Pavisse et al. 2019), and
with more songbirds visiting gardens where there is a high cat visitation frequency
perhaps can help in the future how we think when placing out feeding stations. For
example, avoid placing the feeding station in gardens where we know there is high
visitation frequency by cats to help the songbirds prevent predation. If the predation
of an individual domestic cat is low (Baker et al. 2008) can it help to investigate
how many domestic cats are in the area and adapt shelter and supplement food
positions to areas with fewer individuals of domestic cats.
In my analyses, I did not have sufficient data for every songbird species, so I
tested the model on them as a group and obtain an overview of the correlation with
high or low visitation frequency by domestic cats. Therefore, I do not know if there
is a difference between the species and visiting gardens with more cats. It is possible
that some of the species that are feeding on the ground are less in areas with high
visitation frequency since they have greater change on becoming prey (Pavisse et
al. 2019). By knowing how the different species explore or avoid areas where the
domestic cat has higher visitation frequency can give support when planning to
urbanise new areas, and before creating more suburban areas have an insight on the
wildlife living there and with the domestic cat is coming to affect wildlife species
if domestic cats get a high abundance in that area. Since the domestic cat has a high
abundance in urban areas (Tschanz et al. 2011), and even if the individual cat does
not have high predation the predation risk on wildlife, especially avian, species can
be affecting avian populations in urban areas negatively (Baker et al. 2008). New
animal welfare regulations in Sweden can hopefully help the domestic cat status in
society and lead to less free-roaming cats (Jordbruksverket, 2020). Minimize the
free-roaming cats can diminish the number of individuals needing to use predation
to survive and perhaps it can lead to less predation on smaller mammals, birds, and
reptiles in Sweden.
21Using citizen science and volunteers to collect the data, I was using in the
analyses, can be unreliable. Before starting with the analysis, I sorted out the
volunteers located outside of Umeå municipality, camera traps who was placed
upside down, or in some other way did not follow the instructions. Using citizen
science, it is important to give clear and easy instructions to follow, so data
collected from the citizens can be used later in the process. From the results, I saw
that most of the locations for the camera traps were in suburban areas in the
municipality (Figure 3). When looking into if urbanisation influenced wildlife and
domestic cats’ visitation frequency is creates difficulties to draw conclusions and
have a believable result since most of the camera traps were in the same
urbanisation level. If I have had a more distributed sampled area the results from
the analyses, I did would have been more reliable and easier to see if it is a
difference between wild and urban areas. Using citizen science, I get opportunistic
sampling and some areas of the municipality can be missed and not sampled, but it
is difficult to use another sampling method when asking volunteers to participate.
Another way of doing the sampling and be certain the whole municipality are
including could be to use random sampling (Fisher et al. 1943) instead to avoid bias
in a location on the data collection. One more bias can be when using volunteers
are that they are probably already interested in wildlife and know they have animals
in their garden before entering the project. This can affect the analyses and later the
results because fewer people not interested in wildlife or have seen wildlife in their
garden before do not volunteer to be a part of the project. Before I started with the
analyses all the images were classified and it is likely some images are classified as
incorrect species or missed in the classification process. If more of the same species
are classified incorrect can it affect the result I had from the data.
For the next step in the subject can investigate the relationship the domestic cats
have with other species in Sweden and see is there is a difference in the cities in
Sweden. As in other countries have found evidence on avian species richness
decreases with higher housing density and the domestic cats' increases with housing
density (Sims et al. 2008), and since the domestic cats predate on avian species
which reduced the number of avian individuals in a garden (Blancher 2013), can it
be interesting to explore if it the same in Sweden’s gardens. With exploring and
research what the domestic cats mainly predates on can give us knowledge on how
the domestic cats affect the ecosystems and direct or indirect not only with
predation but also the availability of food or shelter close to urban areas. Other
studies in the subject that could be interesting and informative is to research and
see what impacts except predation they affect wildlife, competing for food, shelter
or territory (Trouwborst & Somsen 2019).
22My conclusions are the domestic cats’ effect on wildlife is not as easy to
determent as earlier studies have indicated (Baker et al. 2008; Loss & Marra 2017).
The strong positive correlation domestic cats have to urban areas makes it hard to
determent the influence of only the domestic cats without the housing densities or
if it is something else that are the driving factor. To get a more understanding and
insight in how the domestic cats effect our wildlife species in Sweden I think it is
important with further studies.
23References
Baker, P.J., Molony, S.E., Stone, E., Cuthill, I.C. & Harris, S. (2008). Cats about
town: is predation by free-ranging pet cats Felis catus likely to affect urban
bird populations? Ibis, 150 (s1), 86–99. https://doi.org/10.1111/j.1474-
919X.2008.00836.x
Blancher, P. (2013). Estimated Number of Birds Killed by House Cats (Felis catus)
in Canada. Avian Conservation and Ecology, 8 (2).
https://doi.org/10.5751/ACE-00557-080203
Bubnicki, J.W., Churski, M. & Kuijper, D.P.J. (2016). trapper: an open source web-
based application to manage camera trapping projects. Methods in Ecology
and Evolution, 7 (10), 1209–1216. https://doi.org/10.1111/2041-
210X.12571
Dijkstra, L., Maseland, J., Europäische Kommission & Centre for Human
Settlements (red.) (2016). The state of European cities 2016: cities leading
the way to a better future. Luxembourg: Publications Office of the European
Union.
Duduś, L., Zalewski, A., Kozioł, O., Jakubiec, Z. & Król, N. (2014). Habitat
selection by two predators in an urban area: The stone marten and red fox
in Wrocław (SW Poland). Mammalian Biology, 79 (1), 71–76.
https://doi.org/10.1016/j.mambio.2013.08.001
Evans, K.L., Newson, S.E. & Gaston, K.J. (2009). Habitat influences on urban
avian assemblages. Ibis, 151 (1), 19–39. https://doi.org/10.1111/j.1474-
919X.2008.00898.x
Fattorini, S., Lin, G. & Mantoni, C. (2018). Avian species–area relationships
indicate that towns are not different from natural areas. Environmental
Conservation, 45 (4), 419–424.
https://doi.org/10.1017/S0376892918000048
Fisher, R.A., Corbet, A.S. & Williams, C.B. (1943). The Relation Between the
Number of Species and the Number of Individuals in a Random Sample of
an Animal Population. Journal of Animal Ecology, 12 (1), 42–58.
https://doi.org/10.2307/1411
Gaston, K.J., Fuller, R.A., Loram, A., MacDonald, C., Power, S. & Dempsey, N.
(2007). Urban domestic gardens (XI): variation in urban wildlife gardening
in the United Kingdom. Biodiversity and Conservation, 16 (11), 3227–
3238. https://doi.org/10.1007/s10531-007-9174-6
Greggor, A.L., Clayton, N.S., Fulford, A.J.C. & Thornton, A. (2016). Street smart:
faster approach towards litter in urban areas by highly neophobic corvids
and less fearful birds. Animal Behaviour, 117, 123–133.
https://doi.org/10.1016/j.anbehav.2016.03.029
Groom, D.W. (1993). Magpie Pica pica predation on Blackbird Turdus merula nests
in urban areas. Bird Study, 40 (1), 55–62.
https://doi.org/10.1080/00063659309477129
Hanmer, H.J., Thomas, R.L. & Fellowes, M.D.E. (2017). Urbanisation influences
range size of the domestic cat (Felis catus): consequences for conservation.
Journal of urban ecology, 3 (1). https://doi.org/10.1093/jue/jux014
24van Heezik, Y., Smyth, A., Adams, A. & Gordon, J. (2010). Do domestic cats
impose an unsustainable harvest on urban bird populations? Biological
Conservation, 143 (1), 121–130.
https://doi.org/10.1016/j.biocon.2009.09.013
Jordbruksverket, 2020 [text].
http://djur.jordbruksverket.se/amnesomraden/djur/olikaslagsdjur/hundaroc
hkatter/nyareglerforhundochkattagare.4.4317c7251725cbfacfb2e100.html
[2020-10-01]
Kays, R., Parsons, A.W., Baker, M.C., Kalies, E.L., Forrester, T., Costello, R.,
Rota, C.T., Millspaugh, J.J. & McShea, W.J. (2017). Does hunting or hiking
affect wildlife communities in protected areas? Journal of Applied Ecology,
54 (1), 242–252. https://doi.org/10.1111/1365-2664.12700
Koceva, M.M., Brandmüller, T., Lupu, I., Önnerfors, Å., Corselli-Nordblad, L.,
Coyette, C., Johansson, A., Strandell, H., Wolff, P. & Europäische
Kommission (red.) (2016). Urban Europe: statistics on cities, towns and
suburbs. 2016 edition. Luxembourg: Publications Office of the European
Union. (Statistical books / Eurostat)
Lee, M.-B., Peabotuwage, I., Gu, H., Zhou, W. & Goodale, E. (2019). Factors
affecting avian species richness and occupancy in a tropical city in southern
China: Importance of human disturbance and open green space. Basic and
Applied Ecology, 39, 48–56. https://doi.org/10.1016/j.baae.2019.08.003
Lilja, S. (1994). The geography of urbanization — Sweden and Finland, c. 1570–
1770. Scandinavian Economic History Review, 42 (3), 235–256.
https://doi.org/10.1080/03585522.1994.10415887
Loss, S.R. & Marra, P.P. (2017). Population impacts of free-ranging domestic cats
on mainland vertebrates. Frontiers in ecology and the environment, 15 (9),
502–509. https://doi.org/10.1002/fee.1633
McDonald, J.L., Maclean, M., Evans, M.R. & Hodgson, D.J. (2015). Reconciling
actual and perceived rates of predation by domestic cats. Ecology and
evolution, 5 (14), 2745–2753. https://doi.org/10.1002/ece3.1553
McKinney, M.L. (2002). Urbanization, Biodiversity, and ConservationThe impacts
of urbanization on native species are poorly studied, but educating a highly
urbanized human population about these impacts can greatly improve
species conservation in all ecosystems. BioScience, 52 (10), 883–890.
https://doi.org/10.1641/0006-3568(2002)052[0883:UBAC]2.0.CO;2
Parsons, A.W., Forrester, T., Baker-Whatton, M.C., McShea, W.J., Rota, C.T.,
Schuttler, S.G., Millspaugh, J.J. & Kays, R. (2018). Mammal communities
are larger and more diverse in moderately developed areas. eLife, 7.
https://doi.org/10.7554/elife.38012
Pavisse, R., Vangeluwe, D. & Clergeau, P. (2019). Domestic Cat Predation on
Garden Birds: An Analysis from European Ringing Programmes. Ardea,
107 (1), 103-. https://doi.org/10.5253/arde.v107i1.a6
QGIS Development Team, 2009. QGIS Geographic Information System. Open-
Source Geospatial Foundation.
RStudio Team (2020). RStudio: Integrated Development
Environment for R. RStudio, PBC, Boston, MA URL
http://www.rstudio.com/.
Sims, V., Evans, K.L., Newson, S.E., Tratalos, J.A. & Gaston, K.J. (2008). Avian
assemblage structure and domestic cat densities in urban environments.
Diversity & distributions, 14 (2), 387–399. https://doi.org/10.1111/j.1472-
4642.2007.00444.x
SMHI. https://www.smhi.se/kunskapsbanken/meteorologi/vinter-1.22843 [2021-
01-21]
Trouwborst, A. & Somsen, H. (2019). Domestic cats (Felis catus) and European
nature conservation law: Applying the EU Birds and Habitats Directives to
25a significant but neglected threat to wildlife. Journal of environmental law,
1–25. https://doi.org/10.1093/jel/eqz035
Tschanz, B., Hegglin, D., Gloor, S. & Bontadina, F. (2011). Hunters and non-
hunters: skewed predation rate by domestic cats in a rural village. European
Journal of Wildlife Research, 57 (3), 597–602.
https://doi.org/10.1007/s10344-010-0470-1
umeå kommun [text].
https://www.umea.se/kommunochpolitik/kommunfakta/statistikochanalyse
r/befolkning.4.2bd9ced91726ea4d7b49.html [2020-11-30]
Woods, M., Mcdonald, R.A. & Harris, S. (2003). Predation of wildlife by domestic
cats Felis catus in Great Britain: Predation of wildlife by domestic cats.
Mammal Review, 33 (2), 174–188. https://doi.org/10.1046/j.1365-
2907.2003.00017.x
Yamaç, E. & Kırazlı, C. (2012). Road effect on the breeding success and nest
characteristics of the Eurasian Magpie (Pica pica).
Geodata Base map OpenStreetMap Foundation ©OpenStreetMap
26Acknowledgements
First of all, I give my deepest gratitude to my supervisor Tim Hofmeester who have
guided me through the process with arising problems and giving me good advice
along the way. I would also give thanks to Joris Cromsigt for being my co-
supervisor. I would also give thanks to all the participants and volunteers in the
project meet your wild neighbours, without your help, I would not be able to carry
out this project.
27Appendix 1
Figure S 1: Songbirds showed a lower visitation frequency in winter compared to the other seasons.
The plot shows the prediction from the GLMM with a 95% confidence interval.
Figure S 2: Roe deer showed a higher visitation frequency in winter compared to the other seasons.
The plot shows the prediction from the GLMM with a 95% confidence interval.
28Appendix 2
Table S 1: An overview of all detected species from the camera traps,
and how many times they have been observed. The Species
written in bold is tested in the analyses.
SPECIES LATIN NAME TOTAL
NUMBER
OF VISITS
BLACK HEADED Chroicocephalus 29
GULL ridibundus
BOHEMIAN Bombycilla garrulus 1
WAXWING
BRAMBLING Fringilla montifringilla 12
CHAFFINCH Fringilla coelebs 3
CHICKEN Gallus gallus domesticus 92
COMMON Turdus merula 21
BLACKBIRD
COMMON CRANE Grus grus 2
COMMON GULL Larus canus 37
COMMON Phasianus colchicus 4
PHEASANT
COMMON WOOD Columba palumbus 4
PIGEON
DOMESTIC CAT Felis catus 1018
DOMESTIC DOG Canis familiaris 198
DOMESTIC RABBIT Oryctolagus cuniculus 7
domesticus
EURASIAN BEAVER Castor fiber 1
EURASIAN BLUE Cyanistes caeruleus 2
TIT
EURASIAN ELK Alces alces 19
EURASIAN JAY Garrulus glandarius 2
EURASIAN Pica pica 625
MAGPIE
EURASIAN Haematopus ostralegus 5
OYSTERCATCHER
EURASIAN RED Sciurus vulgaris 65
SQUIRREL
EURASIAN TREE Passer montanus 5
SPARROW
EURASIAN Scolopax rusticola 2
WOODCOCK
EUROPEAN Meles meles 8
BADGER
EUROPEAN Ovis aries musimon 3
MOUFLON
EUROPEAN PINE Martes martes 1
MARTEN
29EUROPEAN ROBIN Erithacus rubecula 25 FERAL PIGEON Columba livia domestica 2 FIELDFARE Turdus pilaris 52 GREAT TIT Parus major 116 GREYLAG GOOSE Anser anser 1 HAZEL GROUSE Tetrastes bonasia 1 HOODED CROW Corvus cornix 65 MISTLE THRUSH Turdus viscivorus 2 MOUNTAIN HARE Lepus timidus 96 RED FOX Vulpes vulpes 58 REDWING Turdus iliacus 2 REINDEER Rangifer tarandus 13 ROE DEER Capreolus capreolus 468 SONG THRUSH Turdus philomelos 11 SPOTTED Nucifraga caryocatactes 15 NUTCRACKER WEST EUROPEAN Erinaceus europaeus 16 HEDGEHOG WESTERN Tetrao urogallus 3 CAPERCAILLIE WESTERN Coloeus monedula 13 JACKDAW WHITE WAGTAIL Motacilla alba 5 YELLOW NECKED Apodemus flavicollis 3 FIELD MOUSE YELLOWHAMMER Emberiza citrinella 7 Table S 2: An overview of the result for each species tested in the analyses. Species Estimate Std. Error z value p‐value cats housing density 2.016 0.216 9.323 < 0.001 season (winter) ‐0.5233 0.3920 ‐1.335 0.182 Magpie Cat.group 0.884 0.263 3.359
Mountain hare
Cat.group       0.096    0.903   0.107    0.915
housing
density         ‐0.092   0.669   ‐0.137   0.891
season
(winter)        ‐0.037   0.872   ‐0.043   0.965
Red fox
Cat.group       0.258    0.549   0.471    0.638
housing
density         0.008    0.393   0.021    0.983
season
(winter)        0.021    0.608   0.034    0.973
Roe deer
Cat.group       ‐0.204   0.321   ‐0.634   0.526
housing
density         ‐0.355   0.270   ‐1.317   0.188
season
(winter)        0.799    0.329   2.430
Latest issue number in our series Examensarbete/Master's thesis

2020:12          The importance of Ecoparks for saproxylic beetles – A study on general ecological
                 hypotheses in differently managed landscapes
                 Author: Albin Larsson Ekström

2020:13          Restoration strategies in boreal forests – Prescribed burning and gap cutting
                 effects on plant diversity and community composition
                 Author: Clara Espinosa Del Alba

2020:14          Moose movement speed and home range during the rutting season
                 Author: Irene Hjort

2020:15          The direct and indirect relation between ungulates on small mammals
                 Author: Michael Wentzel

2020:16          The effect of the interplay between fire frequency and grassland structure on tick
                 abundances in the Hluhluwe‐iMfolozi Park, South Africa
                 Author: Thilo Heinecke

2020:17          Movement activity and space use – how does the moose react when the tourists
                 come?
                 Author: Nora Höög

2020:18          Anti‐predatory responses of white rhinoceros (Ceratotherium simum) to
                 simulated risk. Does poaching create a landscape of fear?
                 Author: Daniel Gambra Caravantes

2020:19          Eyes in the nest – Breeding phenology of Golden Eaglescharacterized using remote
                 cameras
                 Author: Richard Larsson

2020:20          A camera trap study on the spatio‐temporal behaviour of Asian elephant (Elephas
                 maximus) to mitigate human‐elephant conflicts in the Dong Phayayen‐Khao Yai
                 Forest Complex, Thailand
                 Author: Adam J. Norton‐Turner

2020:21          Attitudes towards Local Carnivores in Umeå, Sweden
                 – Investigating species and individual effects on attitudes towards Carnivores in
                 the confines of a local community
                 Author: Lina Leksell

2021:1           Can hunter’s local ecological knowledge be used in management of multi‐ungulate
                 systems? – A combination of local ecological knowledge and scientific knowledge
                 to add a finer resolution to current management strategies
                 Author: Sandra Pettersson

2021:2           Can ambient temperature patterns predict fireweed phenology?
                 Author: Jennifer Chaimungkhun Johansson

The entire list of published numbers can be found at www.slu.se/viltfiskmiljo
You can also read