Local Level Brexit Vulnerabilities in Scotland - RESAS (Rural & Environment Science & Analytical Services) - PRgloo
←
→
Page content transcription
If your browser does not render page correctly, please read the page content below
Local Level Brexit Vulnerabilities in Scotland

        RESAS (Rural & Environment Science & Analytical Services)

                                       RESAS
                                       9th October 2019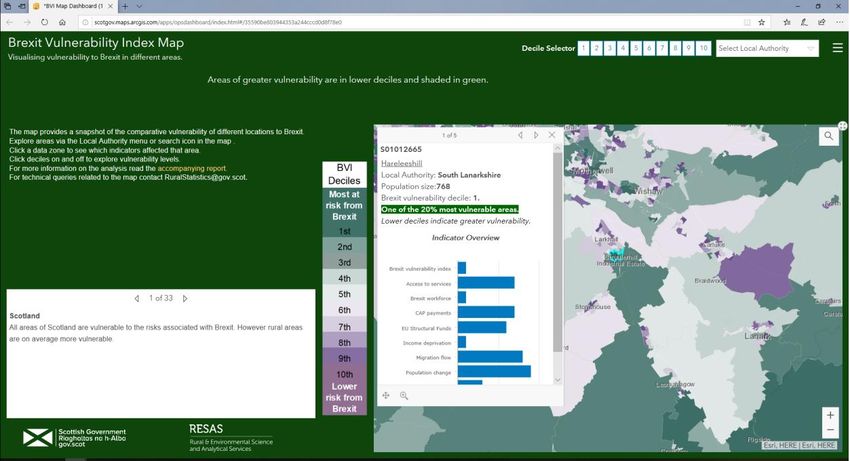
Contents
 Executive Summary ................................................................................................ 3
       Headline findings ............................................................................................. 3
       Background ..................................................................................................... 3
       Constructing a Brexit Vulnerability Index ......................................................... 4
 1.    Introduction ...................................................................................................... 8
 2.    Implications of Brexit........................................................................................ 9
       Economic Implications of a No Deal Brexit ...................................................... 9
       Long Term Economic Implications of Brexit .................................................. 10
       Impact of Brexit on different Communities ..................................................... 11
 3.    Producing a local Brexit Vulnerability index ................................................... 12
       Most Vulnerable Communities in Urban and Rural Scotland ......................... 18
       Most Vulnerable Communities within each local authority ............................. 18
 4.    Mapping Vulnerabilities across Scotland ....................................................... 22
       The Interactive Brexit Vulnerability Index Map............................................... 22
 5.    Conclusion ..................................................................................................... 25
 Annex 1 Data Tables ............................................................................................ 26
 Annex 2 Technical Annex ..................................................................................... 27
 Annex 3 List of Acronyms ..................................................................................... 30

                                                           2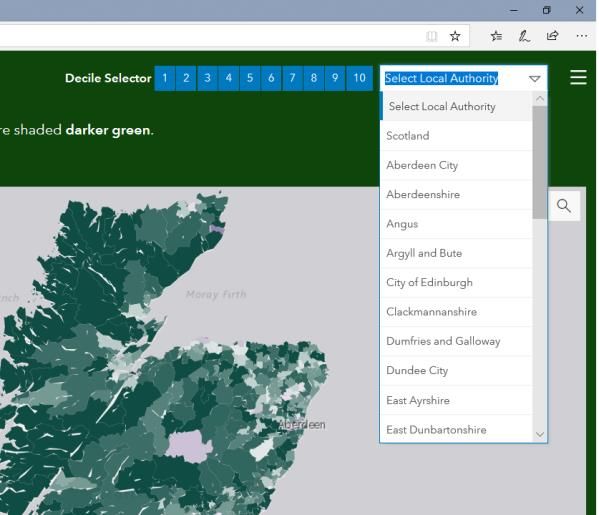
Executive Summary

Headline findings

This research identifies areas of Scotland that are expected to be most vulnerable to
the consequences of Brexit; and what drives those risks to support local authorities
and other organisations in understanding local risks around EU exit. It analyses data
on eight variables and produces a Brexit Vulnerability Index score for nearly 7,000
different areas (datazones) in Scotland. An accompanying interactive map allows for
more granular analysis of each datazone in Scotland. It can be accessed from
https://bit.ly/30W1UVQ

Key findings are that:

•   The risks presented by Brexit are anticipated to have significant social and
    economic consequences for all areas of Scotland.

•   Many of the areas most vulnerable to Brexit are in rural locations, in particular on
    the Scottish islands. Around half of communities in Shetland Islands, Na h-
    Eileanan Siar, Argyle & Bute and Dumfries and Galloway are amongst the most
    vulnerable communities in Scotland (20% most vulnerable datazones).

•   On Na h-Eileanan Siar there are nearly 14,000 people in the most vulnerable
    datazones in Scotland. Likewise, on the Shetland Islands there are more than
    11,000 people in the most vulnerable datazones.

•   A smaller proportion of areas within cities and large urban areas are found to be
    in the most vulnerable 20% of datazones in Scotland. However, because the
    urban population is substantially larger than the rural one, there are still high
    numbers of people in urban and suburban areas who live in such locations. For
    example, there are 186,000 people in Glasgow alone and nearly 170,000 people
    in Fife, North and South Lanarkshire and Edinburgh combined who are living
    within the most vulnerable datazones in Scotland.

Background

The UK’s departure from the European Union (Brexit) poses a complex range of
challenges for communities across Scotland. This paper identifies a number of
factors which will influence a community’s vulnerability. The analysis does not
anticipate a specific Brexit scenario. Instead, it starts from the assumption that
leaving the EU will create a number of challenges, and that whilst different Brexit
outcomes may influence the scale of these challenges, the underlying drivers will be
similar. The research takes the following approach: firstly, the factors which make an
area vulnerable to Brexit are identified; and secondly, these individual factors are
combined into a Brexit Vulnerabilities Index highlighting across Scotland the areas
that may be most at risk.

                                            3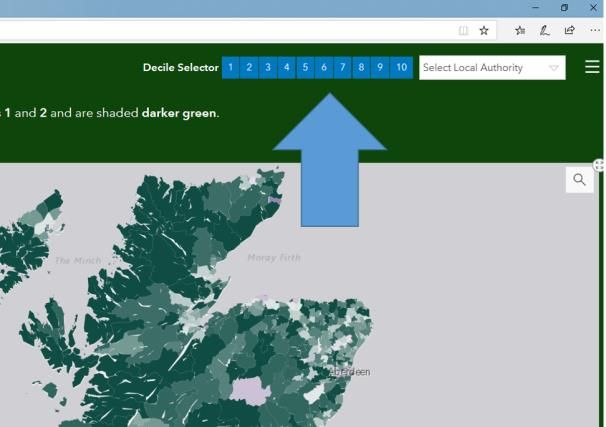
Factors contributing to Brexit vulnerability

Previous Scottish Government analysis has set out the short-term impact that would
be caused by a No Deal Brexit and the long-term implications that future trading
arrangements post Brexit could have on the Scottish economy.1 This analysis
demonstrates that a No Deal Brexit would risk causing a significant economic shock,
whilst any agreement is likely to result in GDP, disposable income and business
investment all being lower than if we remained in the EU.

The trends driving these impacts are often operating at a UK or international level.
However, they will have local impacts and consequences which will vary significantly
across Scotland.

Constructing a Brexit Vulnerability Index

Scotland’s communities are not homogeneous, and it is important to understand the
different implications and transmission mechanisms via which Brexit will impact on
different parts of Scotland. This can be done by assessing the extent to which the
characteristics of different communities makes them more or less vulnerable to the
implications of Brexit.

The Brexit Vulnerability Index has been constructed for nearly 7,000 different
datazones in Scotland. 2 This index groups together a number of different indicators
of exposure to the risks associated with Brexit to provide an overall assessment for
each community in Scotland.

Eight variables are used to construct the index, capturing the following factors:

    •   Access to Services;
    •   Share of the population of working age;
    •   Income deprivation;
    •   Population Change;
    •   Workers in Brexit sensitive industries;
    •   EC Payments received (a) CAP,
    •   EC Payments received (b) ESF/ ERDF; and
    •   EU Worker Migration.

The variables are then weighted and combined together to form a single indicator for
each datazone in Scotland – the Brexit Vulnerability Index.3 The results can then be
used to identify the datazones which are believed to be most vulnerable to the
challenges which Brexit represents. An interactive map is available at
https://bit.ly/30W1UVQ which allows the results for individual datazones to be easily
identified. The underlying dataset used to produce the analysis is also provided
online to allow users to understand how varying underlying assumptions can impact

1
 Previous Scottish Government Brexit analysis is published here:
https://www.gov.scot/publications/deal-brexit-economic-implications-scotland/
2
  Datazones are small area geographical units used for statistical measurement with a population of
around 770 people.
3
  Further information on how the variables are combined together can be found in Annex 2.

                                                  4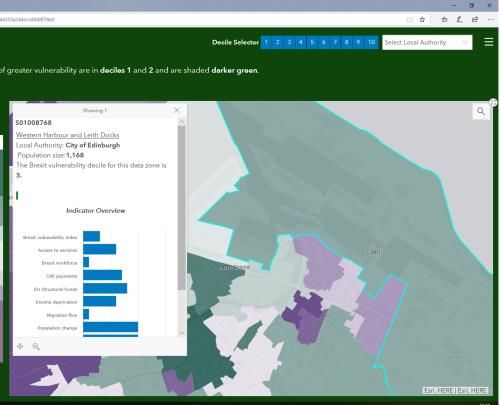
on the overall results4. The interactive map is designed to support local authorities’
and other organisations in understanding local risks around EU exit and to
complement their wider knowledge and analysis. Whilst results are provided for
individual datazones, these should not be viewed in isolation. The risks that an
individual datazone faces will depend on a range of wider factors such as the
vulnerability of the wider region in which is it located, commuter patterns and unique
local characteristics.

Results

The analysis shows that areas in every local authority in Scotland are exposed to the
risk that Brexit represents. However, more rural areas appear to be of
proportionately greater risk. For example, in Na h-Eileanan Siar 53% of communities
at datazone level are within the 20% most vulnerable communities in Scotland; 50%
of those in the Shetland Islands, 49% of those in Argyll & Bute and 34% of those in
the Orkney Islands. This equates to around 75,000 people. This generally reflects
the high concentration of the workforce in Brexit vulnerable sectors such as fishing
and agriculture in these areas; relatively high European funding receipts and rurality,
all of which are believed to increase a locations vulnerability to Brexit.

A higher proportion of rural locations are contained within the 20% most vulnerable
datazones in Scotland than are more urban locations. This does not mean that urban
areas are not vulnerable, but that in aggregate rural communities are typically
relatively more exposed to the risks that Brexit represents. Moreover, within
Scotland’s cities there are a large number of areas which are highly vulnerable to
Brexit and have large populations. For example, within Glasgow 186,000 people live
within the 20% most vulnerable datazones in Scotland. Likewise, 170,000 people in
Fife, North and South Lanarkshire and Edinburgh live in the most 20% most
vulnerable datazones. Both in Dundee and in Aberdeen cities around 24,000 people
live in the most vulnerable areas. We can see that in Figure 1 below, which shows
the distribution of the 20% of datazones identified as being most vulnerable to Brexit
by Scottish local authority, split by the RESAS Classification for the rural economy.5

4
    The underlying data are available for download here: http://www.gov.scot/isbn/9781839601248
5
  Larger Cities: Glasgow City, City of Edinburgh, Aberdeen City and Dundee City; Urban with
Substantial Rural: East Dunbartonshire, East Renfrewshire, Falkirk, Fife, Inverclyde, Midlothian,
North Ayrshire, North Lanarkshire, Renfrewshire, South Lanarkshire, Stirling, West Dunbartonshire,
West Lothian; Mainly Rural: Aberdeenshire, Angus, Clackmannanshire, Dumfries and Galloway,
East Ayrshire, East Lothian, Highland, Moray, Perth and Kinross, Scottish Borders, South Ayrshire;
Islands and Remote Rural: Na h-Eileanan Siar, Orkney Islands, Shetland Islands, Argyll and Bute.
See: https://www.gov.scot/publications/understanding-scottish-rural-economy/

                                                  5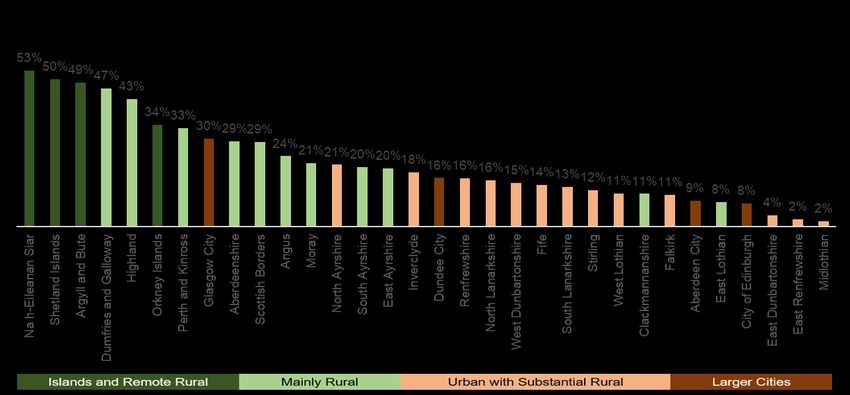
Figure 1 Shares of most Brexit vulnerable datazones by local authority
The areas that have comparatively lower concentrations of Brexit vulnerabilities are
Midlothian, East Renfrewshire, East Dunbartonshire, and Edinburgh. Such local
authorities share several characteristics: all are located on or near the central belt
and have relatively diversified economies. All have had significant population growth
over the past decade which helps shelter them against depopulation vulnerabilities
and have relatively low levels of deprivation. However, all still contain large
populations which will be very vulnerable to Brexit, as shown in Figure 2 below.
Figure 2 Population in 20% most vulnerable datazones in Scotland by local
authority
186,000
Population within 20% most vulnerable datazones
103,000
79,000
69,000
54,000
54,000
53,000
45,000
41,000
40,000
34,000
32,000
30,000
28,000
24,000
24,000
24,000
23,000
22,000
21,000
17,000
14,000
14,000
13,000
12,000
11,000
10,000
9,000
6,000
4,000
2,000
1,000
City of Edinburgh
Fife
Glasgow City
Moray
Argyll and Bute
Highland
Aberdeenshire
Perth and Kinross
Scottish Borders
Renfrewshire
Angus
West Lothian
Dundee City
South Ayrshire
Stirling
East Lothian
Orkney Islands
Dumfries and Galloway
South Lanarkshire
East Ayrshire
Falkirk
Inverclyde
Clackmannanshire
East Renfrewshire
Midlothian
North Lanarkshire
North Ayrshire
Aberdeen City
Na h-Eileanan an Iar
West Dunbartonshire
Shetland Islands
East Dunbartonshire
6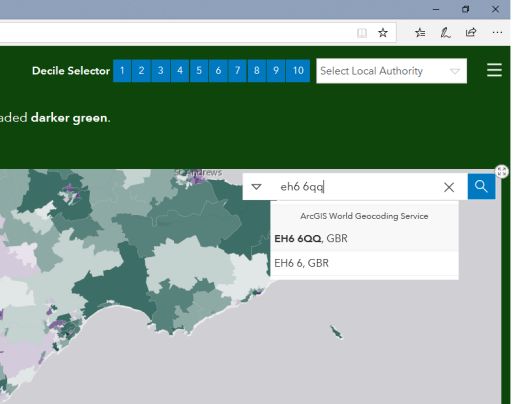
Looking at the same local authority areas as in the paragraph above they have
populations of around 1,500 in Midlothian, 2,200 in East Renfrewshire, 4,500 in East
Dunbartonshire, 6,000 in Clackmannanshire and 40,000 in Edinburgh within the 20%
most vulnerable. Clearly though the largest numbers of the most vulnerable
communities are in Glasgow, the Highlands, Aberdeenshire, and Dumfries and
Galloway.

                                         7
1. Introduction
There has been a wide range of analyses of the potential impacts that Brexit may
have on Scotland. These have typically assessed the expected impacts on individual
sectors and the Scottish economy as a whole. This report complements such
analysis by using highly disaggregated local area datasets to assess the vulnerability
to Brexit of different communities across Scotland, and the underlying factors which
drive this.
The second chapter summarises previous analysis of the economic implications of
Brexit at a Scotland level, and identifies the key factors that have been shown in
previous research to be most likely to determine an area’s vulnerability to Brexit.
Chapter 3 explains the methodology and data used to produce the community level
analysis presented in this report. The analysis combines a number of different
indicators which measure a community’s vulnerability into a single overall indicator.
This illustrates how the level of vulnerability to Brexit varies across Scotland. The
analysis is undertaken at datazone level.6 There are nearly 7,000 datazones
covering the whole of Scotland. Datazones are small area geographical units used
for statistical measurement with a population of around 770 people. Chapter 3 also
summarises the results across Scotland as a whole. This highlights the communities
identified as being the most vulnerable and how the results vary by local authority
and settlement size.
Chapter 4 summarises the interactive mapping tool, which has been developed as a
part of this project, explaining the key features for users. An interactive map is
available at https://bit.ly/30W1UVQ which allows the results for individual datazones
to be easily identified. The underlying dataset used to produce the analysis is also
provided online to allow users to understand how varying underlying assumptions
can impact on the overall results.7
There are three annexes. Annex 1 contains detailed tables from the analysis. Annex
2 contains an explanation of how the Brexit Vulnerability Index was composed.
Annex 3 contains a full list of acronyms used in the report.
6
The analysis in this paper is based on datazones. The paper also refers to datazones as
communities in some places where this aids understanding.
7
The underlying data are available here: http://www.gov.scot/isbn/9781839601248
82. Implications of Brexit
Scotland has been a member of the EU since 1973. During this time EU
membership has been a central element of Scotland’s economic and political model.
It has been the main destination for Scotland’s international exports, has provided
significant funding for communities throughout Scotland, has allowed EU citizens to
live and work in Scotland and for people in Scotland to easily travel across the
continent.
Leaving the EU (Brexit) will therefore have a significant impact on communities
across Scotland. There is broad consensus that Brexit will have a negative impact
on Scotland’s economy.8 A No Deal Brexit would impose an immediate economic
shock on Scotland. Other forms of Brexit, which provide a transition period followed
by a new relationship with the EU, would reduce the risk of a short-term economic
shock, but are still expected to reduce Scotland’s long run economic performance.
The Scottish Government has published a range of analysis highlighting both the
short-term risks that a No Deal Brexit would represent and the long-term economic
implications that different trading relationships could have. This section summarises
this evidence and presents a methodology for identifying the areas of Scotland which
may be most vulnerable to the consequences of such outcomes.
Economic Implications of a No Deal Brexit
Analysis by the Scottish Government’s Chief Economist has considered the short-
term economic impact that a No Deal Brexit could have on the Scottish economy.9
This analysis considered two different scenarios. In the first scenario - a short,
sharp, supply disruption - it was assumed that a No Deal Brexit with no transition
agreement leads to an immediate economic shock caused by disruption to supply
chains, restrictions on trade, delays to investment and recruitment and a
depreciation in Sterling leading to higher inflation and reducing household spending
power. In the second scenario it is assumed that the supply shock lasts for longer,
which in turn leads to a collapse in demand, through a sustained fall in consumer
and business confidence.
There are a range of channels through which each scenario could impact on the
wider economy. These are summarised in Figure 3. The headings in bold represent
the additional transmission channels under the second scenario.
8
https://www.strath.ac.uk/media/1newwebsite/departmentsubject/economics/fraser/pdfs/FAI-
GMB_Brexit_and_the_sectors_of_the_Scottish_economy_-
_2019_update.pdf.pagespeed.ce.bxf3uEicr1.pdf
Fraser of Allander Institute, (2016), Long-term economic implications of Brexit: a report for the
Scottish Parliament;
https://www.researchonline.org.uk/sds/search/go.do?action=document&ref=B46624
Bank of England, (2018), EU withdrawal scenarios and monetary and financial stability;
https://www.bankofengland.co.uk/-/media/boe/files/report/2018/eu-withdrawal-scenarios-and-
monetary-and-financial-
stability.pdf?la=en&hash=B5F6EDCDF90DCC10286FC0BC599D94CAB8735DFB
9
https://www.gov.scot/publications/deal-brexit-economic-implications-scotland/pages/2/
9Figure 3 - Transmission Channels for a No Deal Brexit
Trade Investment Access to Sterling Public Economic
disruption and Jobs Finance Depreciation Finances Confidence
Companies Increase in Potential for Households
Higher
Stop in activity in throughout the companies facing additional UK increase
inflation/Lower
some firms economy pause cash flow fiscal measures in saving/reduce
spending power
investment plans problems 2019 spending
Business models Slowdown leads
Job losses and UK less attractive
Fall in exports. of some to higher Slowdown in the
reduced hours in to migrant
Imports restricted companies no government housing market
many sectors workers
longer viable borrowing
Impacts wide
Additional fiscal
range of Companies find it Banks review Some Non-EU Shock percolates
consolidation may
companies harder to attract lending to exporters benefit through all
be required in
(exporters, supply EU workers impacted sectors from depreciation sectors
future
chains etc)
Some UK
Import Skills mismatch
Borrowing costs businesses Further reduces
substitution between sectors
increase for some become attractive aggregate
provides boost to shedding and
businesses to oversees demand
some sectors requiring labour
investors
Source: Scottish Government
The analysis concluded that collectively these pressures have the potential to result
in GDP contracting by between 2.5% - 7% over a 12-18 month period depending on
the way in which a No Deal Brexit outcome evolves, and for the unemployment rate
to increase to up to 8%, equivalent to the number of people unemployed increasing
by 100,000.
Similar conclusions have been drawn by other organisations. For example, the Bank
of England has estimated that a ‘disorderly’ no deal, no transition scenario could
reduce UK GDP by up to 7.5% by the end of 2023 relative to the May 2016 trend.10
Long Term Economic Implications of Brexit
The Scottish Government paper ‘Scotland's place in Europe: people, jobs and
investment’ highlighted the long-term implications that different trading relationships
with the EU post-Brexit would have on Scotland’s economy. This analysis assumed
that the UK Government was able to achieve a deal with the EU, and that Brexit was
followed by a transition period which reduced the short-term economic shock.
The report concluded that the most likely alternative scenarios to EU membership: a
World Trade Organization style relationship, a Free Trade Agreement: outside the
Single Market and Customs Union and Membership of the European Economic Area
(EEA) would all result in GDP, disposable income and business investment being
lower than if we remained in the EU as summarised in Table 1. These results were
driven by the fact that leaving the EU is expected to reduce opportunities for trade
and increase tariff and non-tariff barriers. This would reduce trade in goods and
services, make Scotland a less attractive location for foreign direct investment,
reduce net migration, and ultimately lower levels of productivity growth.
10
Bank of England, (4th September 2019), Letter from Mark Carney, BoE Governor to Treasury Select
Committee EU withdrawal scenarios and monetary and financial stability;
https://www.bankofengland.co.uk/-/media/boe/files/letter/2019/governor-letter-to-chair-of-tsc-re-
updated-brexit-scenarios.pdf
10Table 1 Headline Macroeconomic Indicators by 2030 relative to a baseline of
Full EU Membership
GDP Per Real
Business
GDP Capita in 2016 Disposable
Investment
(%) Cash Prices Income
(%)
(£) (%)
European
-2.7% -£688 -1.4% -2.9%
Economic Area
Free Trade
-6.1% -£1,610 -7.4% -7.7%
Agreement
World Trade
-8.5% -£2,263 -9.6% -10.2%
Organization
Source: Scottish Government Global Econometric Model (SGGEM)
Impact of Brexit on different Communities
Many of the trends identified above will operate at a UK or international level, and
certainly at a level much higher than that which is easily measurable for local
communities. However, they will all have local impacts and consequences.
These local impacts will not be uniform. Some communities will see a greater impact
because they have a greater reliance on workers from the EU, or because a high
proportion of their companies trade with the EU. For example, there is a relatively
high concentration of horticulture farms in parts of Angus, which is both a sector
economically exposed to Brexit, and a sector which relies on seasonal migrant
workers. Other communities will have less direct exposure to Brexit, but will already
suffer from relatively high levels of deprivation which will make them less able to
absorb the impact of an economic shock or higher prices.
Likewise, in some communities the economic implications of Brexit will exacerbate
underlying challenges. For example, many rural communities already face the
challenge of depopulation. Migration, including from the EU, has helped to
ameliorate or alleviate this trend over the past decade, but this may not remain the
case post Brexit.
Finally, many communities have benefited from EC funding for a number of decades.
In rural Scotland, Agri-food businesses have been supported by CAP.11 In urban
areas European Social Funds help vulnerable communities, and wider European
Structural Funds (of which the social fund is a part) support a range of social and
economic programmes across Scotland. There is no guarantee that the UK
Government will continue to fund replacement programmes in the same manner or
at the same level in the long term. Indeed, if Brexit permanently reduces the UK’s
economic performance, as most studies expect, this in itself could result in public
spending being lower in future years than if we had remained in the EU.
11
https://ec.europa.eu/regional_policy/en/policy/what/glossary/e/european-agricultural-fund-for-rural-
development
113. Producing a local Brexit Vulnerability index
As outlined in the previous Chapter, Brexit, and in particular a No Deal Brexit,
presents a number of risks to Scotland’s communities and businesses. However,
Scotland’s communities are not homogeneous, and it is important to understand the
different implications and transmission mechanisms via which Brexit will impact on
different parts of Scotland.
One way in which this can be done is by assessing the extent to which the
characteristics of different communities make them more or less vulnerable to the
economic implications of Brexit.
The analysis in this paper is derived from a similar methodology used to calculate
rankings in the UK indices of multiple deprivation, such as the Scottish Index of
Multiple Deprivation (SIMD)12. The Brexit Vulnerability Index ranks, in order of risk
and vulnerability, each datazone according to the data from indicators.
The indicators have been chosen due to the particular exposure to socio-economic
conditions that a community may face but does not assume a particular type of
Brexit, nor can it estimate the extent of impact that Brexit may have on different
communities in Scotland (it is identifying impact likelihood, not extent). Indicators
were weighted using a combination of factors, including overall relevance to Brexit,
the quality of the data, and significantly also by using outcomes from the work by the
UK Government in the “HMG Reasonable Worst-Case Planning Assumption”13.
An indexed rank has been produced for each datazone in Scotland. There are
nearly 7,000 datazones covering the whole of Scotland and each datazone has a
population between 500 to 1,000 people. This allows for a very granular level of
analysis.
Eight indicators are used to construct the index, capturing the following factors.
Further information on the variables used is summarised in Table 2.
Income Deprivation – Higher levels of deprivation make a community less resilient
to large scale socio-economic shocks. Given the likely economic shocks associated
with Brexit there is a general risk that these communities will be particularly
vulnerable. Additionally, low income households tend to spend the greatest portion of
their income on the types of goods that could attract tariffs in some Brexit scenarios
(e.g. food).14 This variable is weighted heavier than other variables. This reflects
12
For more detail on SIMD including the methodology and weightings applied see
https://www2.gov.scot/Topics/Statistics/SIMD.
13
https://assets.publishing.service.gov.uk/government/uploads/system/uploads/attachment_data/file/83
1199/20190802_Latest_Yellowhammer_Planning_assumptions_CDL.pdf
14
E.g. FAPRI, (2017): Impacts of Alternative Post-Brexit Trade Agreements on UK Agriculture: Sector
Analyses using the FAPRI-UK Model:
https://www.researchgate.net/publication/320166644_Impacts_of_Alternative_Post-
Brexit_Trade_Agreements_on_UK_Agriculture_Sector_Analyses_using_the_FAPRI-
UK_Model_httpswwwafbinigovukpublicationsafbi-report-post-brexit-trade-agreements-uk-agriculture
12outcomes acknowledged in the UK Government’s Yellowhammer planning
assumptions which note that “low income groups will be disproportionately affected
by any price rises in food and fuel”15.
Workers in Brexit-sensitive sectors – The Scottish Government previously
commissioned EY to undertake an analysis of the impact that an orderly Brexit could
have on different sectors in the Scottish economy. This found that Life Sciences,
High Value Manufacturing, Chemicals; Logistics; Food, Drink, including Agriculture
and Aquaculture: Creative Industries, including Digital; and Financial and Business
Services would be most at risk.16 Communities with high levels of employment in
Brexit-sensitive sectors may therefore be particularly vulnerable. This variable is
weighed more heavily to because of the direct relationship between Brexit and
workers jobs and employment risks17.
Access to Services – This is measured as travel time to core public and private
services, such as GP Surgeries, shops, Post Offices and is used as a proxy for
geographical remoteness. Communities and businesses that face a long travel time
from key services, shops and are at the end of supply chains and are likely to see
greater impact from disruption to imports and exports. In addition, longer travel
times and smaller labour markets mean individual labour market impacts can have
disproportionate effects in such locations. This risk is also reflected in the UK
Government’s Operation Yellowhammer planning around delivering supplying goods
and services.18 Service providers in some rural parts of Scotland already face
challenges in recruiting staff and therefore the assumption is that those areas will be
disproportionately affected if service providers go out of business.
Working Age Population (as share of total population) – Brexit poses a
challenge for communities with a relatively smaller working age population. These
areas are more at risk for three reasons. Firstly, if as a result of Brexit migration
slows down, the problem of ageing population will become more severe as migrants
tend to be in the working-age. Thus, dependency ratios might increase further.
Secondly, an ageing population puts further pressure on the provision of public
services and spending. Thirdly, labour markets rely on access to workers, which
again becomes increasingly difficult in areas with a relatively smaller population in
the working age.
Population Change – Communities which face pre-existing demographic
challenges, especially depopulation, are likely to experience a proportionately
greater impact from lower levels of migration.
15
https://assets.publishing.service.gov.uk/government/uploads/system/uploads/attachment_data/file/83
1199/20190802_Latest_Yellowhammer_Planning_assumptions_CDL.pdf
16
https://cdn.prgloo.com/media/574fecf008bf482cbb9739166c8815de
17
https://www.gov.scot/news/businesses-concerned-about-brexit/
18
https://assets.publishing.service.gov.uk/government/uploads/system/uploads/attachment_data/file/83
1199/20190802_Latest_Yellowhammer_Planning_assumptions_CDL.pdf
13European Payments:
a) European Structural Funds and European Social Funds 19 These are direct
monies paid by the European Commission to communities, local authorities and
businesses across Scotland to deliver economic development or support vulnerable
communities. Communities which receive higher levels of European Funding are at
greater risk of negative consequences should that European funding be ended or
reduced by the UK Government in the future.
b) Common Agricultural Policy (CAP) payments 20 – In the event of disruption or
changes to payments post-Brexit, the communities in highest receipt of these
payments are likely to see a greater impact. CAP is recorded separately because of
different payment mechanisms.
EU Migration – Companies and communities which are particularly reliant on EU
migrants will be more vulnerable to economic disruption and any change in free
movement of labour post-Brexit.
19
https://www.gov.scot/publications/esif-operations-funding/. European Social Fund and European
Structural Funds support a range of community groups, local authority projects, and wider economic
development
20
https://ec.europa.eu/info/food-farming-fisheries/key-policies/common-agricultural-policy_en
CAP payments are made up of two Pillars. Pillar One is funded through the European Agricultural
Guarantee Fund (EAGF) and primarily finances direct payments to farmers and measures regulating
or supporting agricultural. Pillar Two is funded through the European Agricultural Fund for Rural
Development (EAFRD) finances rural development. It funds economic, environmental and social
measures for the benefit of rural Scotland.
14Table 2 – Description of variables used
Theme How is it Source Weight
being 21
measured
Access to Geographic Scottish Index of Multiple Deprivation 20
Services Access to 2016
Services https://www2.gov.scot/Topics/Statistic
(based on a s/SIMD
range of drive
time data)
Working Share of the National Records of Scotland, population 20
Age population statistics
Population aged 16 – 64 https://www.nrscotland.gov.uk/statisti
cs-and-data/statistics/statistics-by-
theme/population/population-
estimates/mid-year-population-
estimates
Income Share of Scottish Index of Multiple Deprivation 40
Deprivation population 2016.
who are https://www2.gov.scot/Topics/Statistic
income s/SIMD
deprived
Population Change in National Records of Scotland, population 20
change population statistics (2011-2017).
from 2011- https://www.nrscotland.gov.uk/statisti
2017 cs-and-data/statistics/statistics-by-
theme
Workers in Proportion of These figures are based on an analysis 30
Brexit- the workforce undertaken by the Communities Analysis
sensitive in industries Division within Scottish Government.
industries identified as Data is taken from NOMIS (BRES), and
being most from the Agricultural Census. Sectors
exposed to were selected that had been identified as
Brexit most vulnerable to Brexit and referred to
in analysis undertaken by EY for the
Scottish Government. EY undertook an
analysis of the impact that a disorderly
Brexit could have on different sectors in
the Scottish economy. This found that
Life Sciences, High Value Manufacturing,
Chemicals; Logistics; Food, Drink,
including Agriculture and Aquaculture:
Creative Industries, including Digital; and
Financial and Business Services would
be most at risk.22
21
Weights sum to 165, this is to ensure all weighting rounds to 5 or 10 to avoid spurious accuracy in
percentage weightings.
22
https://cdn.prgloo.com/media/574fecf008bf482cbb9739166c8815de
15Total vulnerable employment for each
datazone (BRES + Agricultural Census)
was divided by total employment to
calculate percentage employment
vulnerable to Brexit. A 30% cut off to
define datazones with a higher workforce
vulnerability was chosen.
EC EC CAP The payments data used are for the 10
Payments payments for combined European Commission (EC)
2017 and financial years of 2017 and 2018. EC
2018 financial years run for 16 October to 15
October. The locations assigned to the
payments are based on the registered
address of the recipients, which in some
cases may not be where the money is
spent/used. CAP payments data are
available to download here: http://cap-
payments.defra.gov.uk/Download.aspx
European For the period from 2014 to 2020, 5
Structural Scotland received €476 million from the
Funds – European Regional Development Fund
European (ERDF) and €465 million from the
Social Fund European Social Fund (ESF). For this
(ESF) and paper, only payments to local authorities
European are included. Payments to Scottish
Regional Government or agencies are excluded as
Development they cannot be attributed to specific
Fund areas.
(ERDF).
EU National National Insurance Number Adult 20
Migration Insurance overseas (NiNo) registrations,
Number Department for Work and Pensions.23
registrations https://stat-
by EU xplore.dwp.gov.uk/webapi/jsf/login.xht
nationals ml
For every datazone in Scotland, data on each of these indicators was collected,
weighted according to data quality, level of importance and commonality, and
combined together to produce an overall Brexit Vulnerability Index Score for each
community (Annex 2).
23
NiNo registration statistics are available at the DWP Stat-Xplore website here:
https://stat-xplore.dwp.gov.uk/webapi/jsf/login.xhtml
NiNo registrations are made by migrants when moving into employment. This is not a measure of
permanent migration and allows the analysis to capture short-time migration that is not covered by
population figures. It also is a proxy for the demand for migrant labour, and for those areas with higher
migration generally.
16The vulnerability ranking is therefore an ordinal measure. This means that the
scores represent a ranking of datazones from the least vulnerable to the most
vulnerable to Brexit, based on the criteria used. A datazone with a higher score is
estimated to have a greater level of vulnerability to Brexit than an area with a lower
score. However, the scores do not measure how much more vulnerable an area is.
A datazone which has a score of 80, is more vulnerable than one which has a score
of 40 but not necessarily twice as vulnerable.
Inevitably, such analysis will never be able to capture the factors unique to any one
community in Scotland. Datazones are not standalone areas. They are part of
much wider communities where individual risks will interact, overlap and spill over
from one datazone to another. For example, if datazone A is found to be
comparatively less vulnerable to Brexit on the basis of the above indicators, but the
surrounding datazones are all estimated to have a high level of vulnerability this will
inevitable have an impact on datazone A. Given the range and subtlety of such
interactions, they are impossible to account for in a comprehensive manner in this
analysis. As such whilst the broad trends highlighted in the following analysis are
clear, care should be taken in seeking to draw specific conclusions about the precise
vulnerability of any one datazone.
Further information on the methodology used is provided in Annex 2.
17Most Vulnerable Communities in Urban and Rural Scotland
The results show that the areas that are most vulnerable to Brexit (those in the top
20% of vulnerable datazones in Scotland) are distributed throughout the country.
However, there is a higher concentration of such datazones in remote and rural
locations.
Urban areas have proportionately fewer datazones in the most vulnerable 20%
across Scotland, though Glasgow has more vulnerable people than any other local
authority in absolute terms. Vulnerabilities in urban areas tend to be caused by low
incomes. However, overall urban areas tend to have comparatively stronger
demographics, more diversified economies and a better balance of working age
population. They also tend to have comparatively low receipts of European CAP
funding, but do receive significant amounts of European Social and Structural Funds.
Likewise, most local authorities in this classification are located in the central belt,
thus have relatively better access to services, higher incomes and positive
demographics. Therefore, whilst urban areas are still at risk from the impacts of
leaving the EU, these risks are proportionately lower, on average, than those faced
by rural areas.
In rural areas there are higher likelihoods of vulnerabilities. Geographical
remoteness in itself is likely to increase an area’s vulnerability as communities at the
end of supply chains are likely to see greater impact from disruption to imports and
exports. In addition, longer travel times and smaller labour markets mean individual
labour market impacts can have disproportionate effects in such locations. This is
compounded by the wider Brexit vulnerabilities that rural locations typically face. For
example, CAP funding, tends to be concentrated in rural communities, so future risks
to funding are highest in those communities. Depopulation is also more common in
rural communities, and as larger urban areas tend to have more diversified
economies, and concentrations of workers in Brexit sensitive sectors are less
common.
Most Vulnerable Communities within each local authority
The following analysis looks in more detail at the 20% of communities in Scotland
identified as being most vulnerable to Brexit.
The chart below summarises the concentration of these datazones across each local
authority. It shows 53% of communities in Na h-Eileanan Siar at datazone level are
within the 20% most vulnerable communities in Scotland; in the Shetland Islands it is
50%, and 49% of those in Argyll and Bute. This reflects the high concentration of the
workforce in Brexit vulnerable sectors such as fishing and agriculture; relatively high
European CAP funding receipts and poorer access to services, though there is
variation within these areas.
The areas that have the lowest concentrations of Brexit vulnerabilities are Edinburgh,
East Dunbartonshire, East Renfrewshire, and Midlothian. These local authorities
share several characteristics: all are located on or near the central belt and have
relatively diversified economies. All have had significant population growth over the
past decade which helps shelter them against depopulation vulnerabilities and have
18relatively low levels of deprivation. As noted, such locations are not immune from
the risks of Brexit, and they all face clear risks, and have areas which are in the most
vulnerable 20%. However, these risks are relatively lower than for more deprived
urban or more rural locations.
Figure 4 Shares of most Brexit vulnerable datazones by local authority
Figure 4 shows the proportion of datazones which are in the nationally most
vulnerable 20% for each local authority. The bars are coloured according to the
RESAS classification of the rural economy for local authorities. Broad differences
between rural and urban areas are clear:
• Rural local authorities tend to have the greatest shares of communities which
are included in the 20% most vulnerable
• Urban areas tend to have the smallest shares of communities which are
included in the 20% most vulnerable
• Figure 4 shows that the areas that have the lowest concentrations of Brexit
vulnerabilities are Midlothian, Edinburgh, East Dunbartonshire and East
Renfrewshire. These local authorities share several characteristics: all are
located on or near the central belt and have relatively diversified economies.
All have had significant population growth over the past decade which helps
shelter them against depopulation vulnerabilities and have relatively low levels
of deprivation.
Figure 4 however does not reflect the number of people living in most vulnerable
areas. Figure 5 below, shows the distribution of the population living in the 20% most
vulnerable Scottish datazones by local authority and thus directly links with Figure 4.
Figure 5 highlights that whilst urban local authorities have a lower share of the most
vulnerable datazones, the population living in these areas is larger. For example,
186,000 people in Glasgow live within the most vulnerable datazones in Scotland,
more than any other local authority. Likewise, nearly 170,000 people in Fife, North
and South Lanarkshire and Edinburgh combined are living within the most vulnerable
datazones in Scotland.
19Figure 5 Shares of population in most Brexit vulnerable datazones by local
authority
186,000
Population within 20% most vulnerable datazones
103,000
79,000
69,000
54,000
54,000
53,000
45,000
41,000
40,000
34,000
32,000
30,000
28,000
24,000
24,000
24,000
23,000
22,000
21,000
17,000
14,000
14,000
13,000
12,000
11,000
10,000
9,000
6,000
4,000
2,000
1,000
South Ayrshire
Glasgow City
West Lothian
Shetland Islands
Aberdeenshire
East Ayrshire
Fife
Argyll and Bute
Scottish Borders
Angus
Moray
Highland
Dundee City
Falkirk
Inverclyde
East Lothian
Orkney Islands
Dumfries and Galloway
Perth and Kinross
South Lanarkshire
Renfrewshire
North Lanarkshire
North Ayrshire
Aberdeen City
Stirling
Clackmannanshire
East Renfrewshire
Midlothian
Na h-Eileanan an Iar
West Dunbartonshire
East Dunbartonshire
City of Edinburgh
Figure 6 below shows where the 20% most vulnerable communities are located
within Scotland, using the LA urban-rural classification. This means we can see the
overall share between urban and rural of the most vulnerable communities.
Figure 6 Share of the 20% most vulnerable communities by type of community
Islands and
Remote Rural
Larger Cities 8%
23%
Mainly Rural
41%
Urban with
Substantial Rural
28%
This analysis shows that Mainly Rural communities account for two fifths (41%) of
the most vulnerable 20% datazones. More than a quarter of the most vulnerable
communities are located in Urban with Substantial Rural communities, 23% in Larger
Cities and only 8% in Islands and Remote Rural communities. So overall, whilst
vulnerability is more common in rural areas, because of the population differences,
more datazones (and therefore more people) live in urban or suburban areas at risk
20of Brexit. This is explored in Figure 7 below which shows the distribution of people
living in the most Brexit-vulnerable communities compared with their overall shares
of the population
Figure 7 Distribution of Populations in Most Vulnerable Communities
41% 41%
28% 27% 28%
25%
7%
3%
Islands and Remote Mainly Rural Urban with Larger Cities
Rural Substantial Rural
Share of Scottish Population Living in Most Vulnerable Brexit Communities
Share of Scotland's Population
Figure 7 above illustrates the size of the population within each classification overall
and the share of those people living in the 20% most vulnerable datazones. The
figure shows that whilst the population in Islands and Remote Rural local authorities
only accounts for 3%, and in Mainly Rural only for 28% of the Scottish overall
population, the share of the population living in vulnerable datazones is substantially
higher with 7% in Islands and Remote and 41% in Mainly Rural. In Urban with
Substantial Rural local authorities and in Larger Cities, the population is relatively
less at risk. Nevertheless, around a quarter in each of the more urban areas live in
the most vulnerable datazones.
214. Mapping Vulnerabilities across Scotland
This chapter provides a detailed description of the interactive mapping tool that is
available at https://bit.ly/30W1UVQ. This tool shows local results for each datazone
in Scotland, and for each local authority area.
The interactive map is designed to support local authorities’ and other organisations
in understanding local risks around EU exit and to complement their wider
knowledge and analysis. Whilst results are provided for individual datazones, these
should not be viewed in isolation. The risks that an individual datazone faces will
depend on a range of wider factors such as the vulnerability of the wider region in
which is it located, commuter patterns and unique local characteristics.
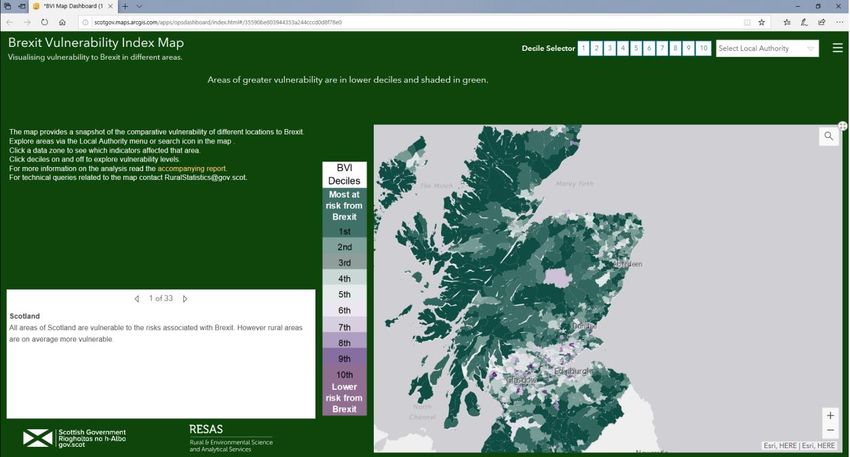
The Interactive Brexit Vulnerability Index Map
As described in the previous Chapter, the Brexit Vulnerability Index Score is an
additive index combining all eight factors listed in Table 224. The Brexit Vulnerability
Index Map visualises vulnerability to Brexit in different areas. The first map that
appears when clicking on the link is the Scotland overall map. Areas most at risk
from Brexit appear in darker green and areas that are relatively less vulnerable are
shaded in dark purple. The colour shades represent deciles. In other words, the 1st
decile illustrates those areas that are amongst the 10% most vulnerable datazones,
the 10th decile the 10% least vulnerable ones. Every decile therefore captures
around 700 datazones.
Figure 7 Screenshot of BVI Tool
24
These indicators are: access to services, working age population share, income deprivation,
population change, workers in Brexit-sensitive industries, EC payments (a) CAP, and (b) ESF and
ESOF to the area, and National Insurance Number registrations by EU nationals (see Table 2).
22On the top right of the website, deciles can be selected. The user can for example
select decile 1 and decile 2 and only datazones within these deciles are highlighted
in the map.
Figure 8 BVI decile selector Tool
Right next to the decile selector, the user can select a local authority. The tool then
zooms into the selected local authority and all datazones within the local authority
become clearer. On the left side of the website a window appears providing
explanation for the selected local authority.
Figure 9 BVI local authority selector Tool
If a user clicks on a specific datazone, a graph appears summarising a simplified
version of the data underlining the overall BVI. The top 8 bars show what decile the
datazone is located, in terms of each of the variables included in the BVI. If for
example a datazone appears in decile 1 for the variable “Income Deprivation” this
means that it belongs to the 10% most household income deprived datazones in
Scotland. If it appears in decile 10, this means that overall income is highest in this
datazone. (Note that for European funding variables, decile 1 will be receiving the
highest payments, and decile 10 the lowest payments.) Annex 2 explains how the
23BVI is calculated and it should be noted that the deciles do not simply add up to the
overall BVI.
Figure 10 BVI datazone selector Tool
Lastly, the mapping tool has a search function. The user can click on the magnifying
glass in the top right corner of the map and type in a postcode or a street address.
The map then zooms into the datazone the point of interest is located in and the user
can click on the datazone to get additional information.
Figure 11 BVI postcode search tool
A spreadsheet including both the data underlying the mapping tool, but also
additional data that can be used to recalculate the BVI score is published alongside
this report.25 This allows users to also readjust the weights applied. Annex 2 explains
how the BVI was calculated using ranked data.
25
The data are available here: http://www.gov.scot/isbn/9781839601248
245. Conclusion
Brexit will affect communities across Scotland in different ways. This research shows
at datazone – or community – level where in Scotland is likely to be most vulnerable
to Brexit. It does so by identifying the factors which will influence a community’s
vulnerability, and assesses the extent to which the characteristics of different
communities makes them more or less vulnerable to Brexit.
The analysis does not anticipate a specific Brexit scenario. Instead, it starts from the
assumption that leaving the EU will create a number of challenges, and that whilst
different Brexit outcomes may exacerbate or alleviate the scale of these challenges,
the underlying drivers would be the same.
The analysis looks at data on eight variables and produces a Brexit Vulnerability
Index score for each datazone area in Scotland. Key findings are that many of the
most vulnerable areas to Brexit are rural areas.
Overall the analysis shows that 53% of communities at datazone level in Na h-
Eileanan Siar are within the 20% most vulnerable communities in Scotland; 50% of
those in the Shetland Islands, 49% of those in Argyll and Bute and 34% in the
Orkney Islands. This equates to over 75,000 people in total. This reflects the high
concentration of the workforce in Brexit vulnerable sectors such as fishing and
agriculture; relatively high European funding receipts and rurality, though there is
variation within these areas.
Many of the most vulnerable areas are in Mainly Rural local authorities. This does
not mean that urban areas would not see a negative impact from Brexit, but that on
average rural communities are typically relatively more exposed to the risks that
Brexit represents.
However, Brexit is clearly not a purely rural problem. For example, 186,000 people in
Glasgow live within the most vulnerable datazones in Scotland, more than any other
local authority. Likewise, nearly 170,000 people in Fife, North and South
Lanarkshire and Edinburgh combined are living within the most vulnerable
datazones in Scotland.
25Annex 1 Data Tables
Table A1.1: Most vulnerable communities
Local Authority RESAS Classification Relative Number of Population
share of datazones in
datazones amongst datazones
amongst most amongst
most vulnerable most
vulnerable 20% vulnerable
20% 20%
Aberdeen City Larger Cities 9% 25 23,630
Aberdeenshire Mainly Rural 29% 98 78,759
Angus Mainly Rural 24% 37 28,490
Argyll and Bute Islands and Remote Rural 49% 61 41,243
City of Edinburgh Larger Cities 8% 47 40,060
Clackmannanshire Mainly Rural 11% 8 5,992
Dumfries and Galloway Mainly Rural 47% 94 68,502
Dundee City Larger Cities 16% 31 24,355
East Ayrshire Mainly Rural 20% 32 21,817
East Dunbartonshire Urban with Substantial Rural 4% 5 4,475
East Lothian Mainly Rural 8% 11 9,914
East Renfrewshire Urban with Substantial Rural 2% 3 2,161
Falkirk Urban with Substantial Rural 11% 23 16,870
Fife Urban with Substantial Rural 14% 70 54,281
Glasgow City Larger Cities 30% 223 185,573
Highland Mainly Rural 43% 135 102,621
Inverclyde Urban with Substantial Rural 18% 21 13,548
Midlothian Urban with Substantial Rural 2% 2 1,440
Moray Mainly Rural 21% 27 21,489
Na h-Eileanan Siar Islands and Remote Rural 53% 19 13,961
North Ayrshire Urban with Substantial Rural 21% 39 29,657
North Lanarkshire Urban with Substantial Rural 16% 70 53,912
Orkney Islands Islands and Remote Rural 34% 10 8,835
Perth and Kinross Mainly Rural 33% 62 53,108
Renfrewshire Urban with Substantial Rural 16% 37 31,995
Scottish Borders Mainly Rural 29% 41 33,960
Shetland Islands Islands and Remote Rural 50% 15 11,376
South Ayrshire Mainly Rural 20% 31 23,381
South Lanarkshire Urban with Substantial Rural 13% 58 45,299
Stirling Urban with Substantial Rural 12% 15 11,593
West Dunbartonshire Urban with Substantial Rural 15% 18 13,011
West Lothian Urban with Substantial Rural 11% 27 23,607
Scotland26 100% 1,395 1,098,915
26
Scotland total for population does not equal the sum of the constituent parts due to rounding.
26Annex 2 Technical Annex
The Brexit Vulnerability Index (BVI)
The Brexit Vulnerability Index is an index which combines data from 8 indicators.
Each indicator has been chosen as it provides quantifiable evidence likely to provide
either a direct or indirect measure of issues relating the UK leaving the EU. This
suite of indicators provides data for each of the 6,976 datazones in Scotland.
Datazones are small area geographical units used for statistical measurement with a
population of around 770 people.
Eight variables are used to calculate the BVI:
• Access to Services;
• Working age population;
• Income deprivation ranking;
• Population Change;
• Workers in Brexit sensitive industries;
• EC Payments received through
o CAP and
o ESF and ERDF; and
• EU Worker Migration.
The rationale for selecting each of the specific variables is discussed in Chapter 3 of
the report.
Each variable is first standardised by ranking the values. This is necessary because
the variables are measured on different scales and by ranking the variable it is
ensured that they have identical distributions with the same range and therefore
maximum and minimum values.
However, using the ranks alone would result in distributions which are symmetrical,
and one variable indicating vulnerability could be fully ‘cancelled out’ by lack of
vulnerability in another. This does not reflect the prior distribution of the variables
and gives undue weight to the least vulnerable scores.
Simply using the symmetrical ranks is inappropriate given that high ranks signify less
vulnerability and do not imply a lack of vulnerable to Brexit. A transformation is
required to address these issues and the exponential transformation of the ranks
was chosen as the most appropriate method. This is in line with the methodology
used by the Scottish Index of Multiple Deprivation (SIMD).27
The exponential transformation deals with this question of variables cancelling each
other out. It has the advantage that every variable is converted to an identical
distribution with the same maximum and minimum values, whilst emphasising the
most vulnerable ‘tail’ of the distribution. The transformation ‘draws out’ the ranks of
27
https://www2.gov.scot/Resource/0050/00504822.pdf
27the most vulnerable datazones so that spaces are introduced between datazones
that reflect the actual distributions.
The formula for the calculation is:
X = -23*log{1-R*[1-exp(-100/23)]}
where R is the rank (for the exponential transformation the least vulnerable datazone
is ranked 1 and the most vulnerable datazone is ranked 6,976) transformed to the
range [0,1], log is the natural logarithm and exp the exponential transformation.
The constant -23 gives a 10% cancellation property. To illustrate why this property is
desirable, suppose two variables were equally weighted and a cancellation factor
was not applied. A datazone which was most vulnerable on one of the variables and
least vulnerable on the other would be ranked at the 50th percentile. However, it
does not seem appropriate to suggest that lack of vulnerability in one variable should
exactly cancel out an entirely different dimension of vulnerability in another. Using
the 10% cancellation property, the datazone would be ranked within the 10% most
vulnerable datazones. This was considered to be more appropriate.
Following the exponential transformation, the datazones have scores ranging
between 0 (least vulnerable) and 100 (most vulnerable) on each variable. In addition,
the scores increase exponentially so that the most vulnerable datazones have more
prominence. The 10% cancellation factor means that the most vulnerable 10% of
datazones are emphasised with scores between 50 and 100 whilst the remaining
90% of datazones have scores between 0 and 50. Thus the exponential
transformation successfully deals with the issues of cancellation and symmetry.
Weights are applied based on the relative importance of each variable as discussed
in Chapter 3 and based on data quality and potential correlations. The standard
weight was determined at 20 or 12%, thus around one eights of the overall index.
• Whilst none of the variables are highly correlated, (defined as having a
Pearson Correlation Coefficient above 0.69), the variable for CAP payments
is moderately correlated with the variables measuring the Brexit Workforce
and Access to Services. Thus, despite good data quality, it was decided to
weight CAP down relative to the remaining variables. The weight was set at
10 or 6%.
• It was further decided to weight down ESF and ERDF due to poorer data
quality. This is because payments are allocated to local authorities. In order to
disaggregate data, it was decided to distribute the local authorities’ payments
to datazones using population weights. Therefore, ESF/ERDF payments by
datazones are only an estimate and not as accurate as the remaining
variables. ESF and ERDF are weighted with factor 5 and account for 3% of
the overall BVI.
• Income deprivation data is both of high quality and also relatively more
important than the remaining variables (see Chapter 3). Thus, the variable
counts double with 24% and a weight of 40.
• Access to Services, Population Decline and the Share of the Working
Age Population are given the standard weight of 20 and each account for
12% of the BVI. This is because of high data quality, weak correlation
28You can also read