Attention Please! Learning Analytics for Visualization and Recommendation
←
→
Page content transcription
If your browser does not render page correctly, please read the page content below
Attention Please!
Learning Analytics for Visualization and Recommendation
Erik Duval
Dept. Computer Science
Katholieke Universiteit Leuven
Celestijnenlaan 200A
B3000 Leuven, Belgium
erik.duval@cs.kuleuven.be
ABSTRACT rent work on learning analytics and achieve broad adoption,
This paper will present the general goal of and inspiration it is imperative to establish a global open infrastructure, as
for our work on learning analytics, that relies on attention we briefly explain in section 5. The two next sections briefly
metadata for visualization and recommendation. Through present the two approaches we’ve explored so far to lever-
information visualization techniques, we can provide a dash- age learning analytics: learning dashboard (section 6) and
board for learners and teachers, so that they no longer need learning recommenders (section 7). Before concluding the
to ”drive blind”. Moreover, recommendation can help to paper, we briefly mention exciting opportunities that learn-
deal with the ”paradox of choice” and turn abundance from ing analytics provides for data based research on learning in
a problem into an asset for learning. section 8.
1. INTRODUCTION 2. BACKGROUND ON ANALYTICS
Attention is a core concern in learning: as learning resources
The new field of learning analytics is quite related to similar
become available in more and more abundant ways, atten-
evolutions in other domains, such as Big Data [1], e-science
tion becomes the scarce factor, both on the side of learners
[14, 9, 26], web analytics [7], educational data mining [25].
as well as on the side of teachers. (This is a wider concern,
All of these have in common that they rely on large col-
as we evolve towards an ’attention economy’ [10].)
lections of quite detailed data in order to detect patterns.
This detection of patterns can be based on data mining tech-
Learners and teachers leave many traces of their attention:
niques, so that for instance recommendations can be made
some are immediately obvious to others, for instance in the
for resources, activities, people, etc. that are likely to be
form of posts and comments on blogs, or as twitter mes-
relevant. Alternatively, the data can be processed so that
sages. These explicit traces are human readable, but can be
they can be visualized in a way that enables the teacher or
difficult to cope with in a world of abundance [29]. Although
learner rather than the software to make sense of them.
some refer to ’information overload’, we prefer Shirky’s ”fil-
ter failure” as a way to think about the problem of dealing
In fact, the research in my team gets much of its inspira-
with this abundance [30]. In any case, human attention
tion from tools like wakoopa (http://social.wakoopa.com)
traces are extremely valuable, but do not scale very well.
or rescuetime (http://www.rescuetime.com), that install
tracker tools on the machine of a user and then automati-
In this paper, we will explain how machine readable traces
cally record all activities (applications launched, documents
of attention can be used to filter and suggest, provide aware-
accessed, web sites visited, music played, etc.) by that user.
ness and support social links.
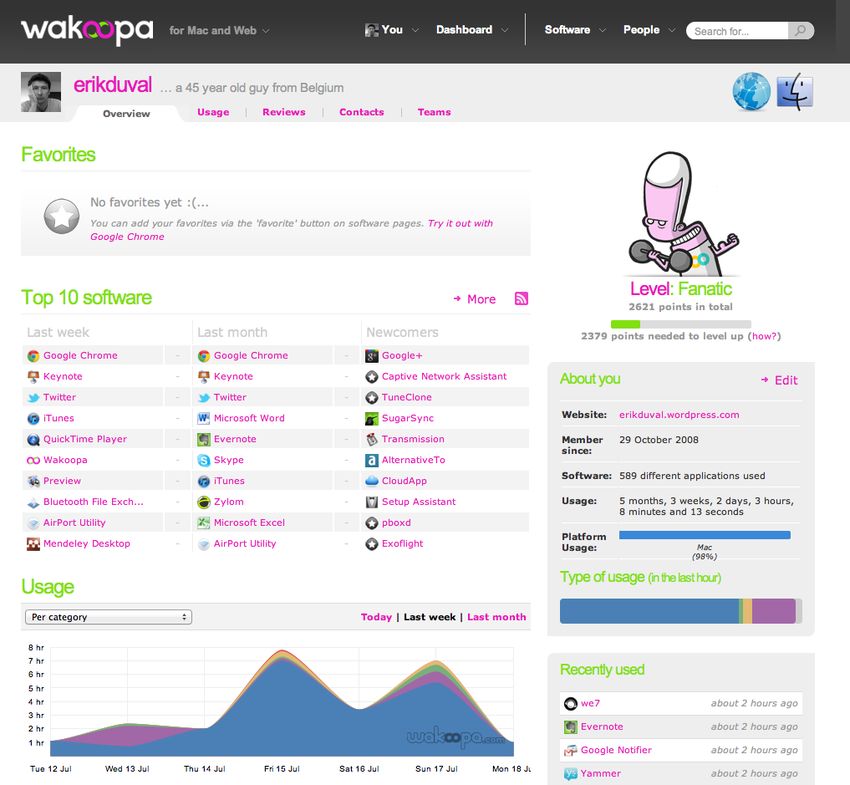
A typical illustration of the visualizations that such tools
This paper is structured as follows: section 2 provides a brief
provide is figure 1, where a simple overview is presented of
background on the field of analytics in general. The section
the software applications I used last week and last month
thereafter focuses on applications from the world of jogging,
and how their usage is distributed over time. (Tuesday-
as these provide a particularly rich source of inspiration for
Thursday were travel days...) In this way, such an applica-
our work. The general concept of goal oriented visualiza-
tion can help a user to be more aware of her activities.
tions is at the core of learning dashboard applications: that
is why it is the topic of section 4. In order to scale up the cur-
Moreover, based on these tracking data, the wakoopa tool
can compare the activity of a user with that of other users
and recommend software or contacts - see figure 2. It doesn’t
require much imagination to see how similar visualizations
could be useful in the world of learning, for instance to
chart learning activities, tools used or recommended, and
This text is a PREPRINT. Please cite as: E. Duval Attention Please! peer learners or suitable teachers in one’s social network.
Learning Analytics for Visualization and Recommendation. To appear
in: Proceedings of LAK11: 1st International Conference on Learning It is important to note that the tracking occurs without any
Analytics and Knowledge 2011. manual effort by the user - although it is of course important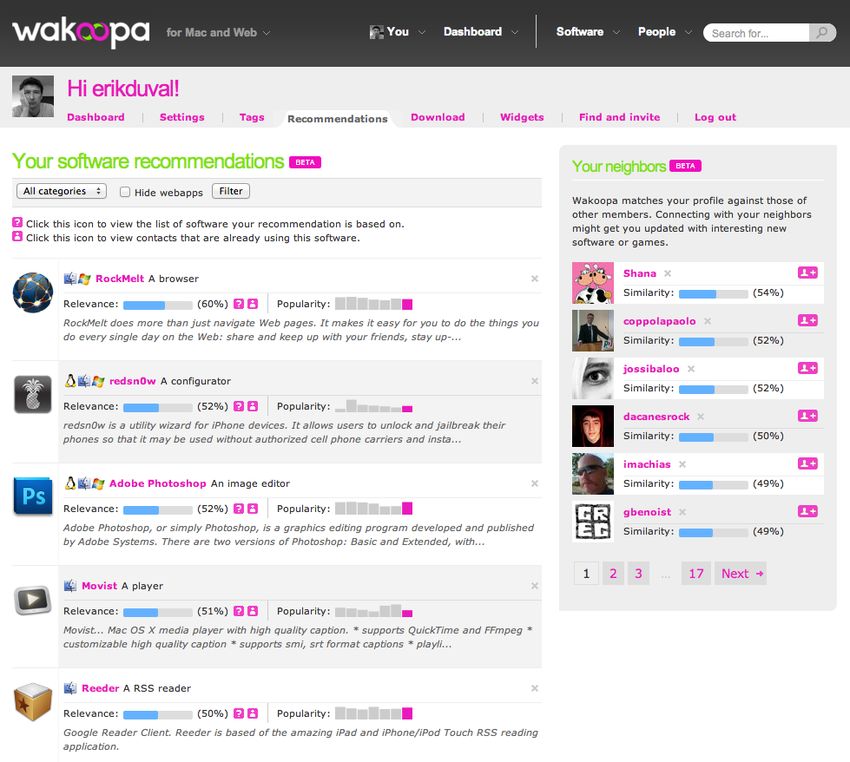
Figure 1: My wakoopa dashboard

Figure 2: My Wakoopa recommendations
that the user is aware that her activities are being tracked.     developing and maintaining motivation, to help define re-
Actually, such tools typically also make it possible to pause     alistic goals and develop plans to achieve them, as well as
tracking. Some applications allow users to set goals (”spend      connect learners or teachers with other learning actors, etc.
less than 1 hour per day on email” or ”play computer games        In that way, they can help to realize a more learner-driven
for less than 1,5 hour per day” or ”write more than 3 hours       approach to education, training and learning in general.
per day”) and will notify them when they are in danger
of not meeting their goal, when they get close to the self-
imposed limit - or signal them that they did reach their goal.
                                                                  4.   GOAL ORIENTED VISUALIZATIONS
Moreover, they provide quite detailed visualizations of all       Many of these inspiring applications take a visual approach.
the activities of a user, so that she can analyze where most      Yet, if visualizations are to have any effect beyond the ini-
of her on-line activity takes place and make better informed      tial ”wow” factor, it would be useful to have more clarity
decisions on how to manage these activities.                      on what the intended goal is and how to assess whether
                                                                  that goal is achieved. Many visualizations look good - and
A similar tool is tripit (http://www.tripit.com): notewor-        some are actually beautiful. But how we can connect visu-
thy about this tool is that when a user forwards flight or        alization not only with meaning or truth, but with taking
hotel reservations to a tripit email address, all the struc-      actions? This is very much a ”quantified self” approach (see
tured data is extracted and a calendar is created with all        http://quantifiedself.com/) [31], where for instance a vi-
the relevant information. This is an excellent example of         sualization of eating habits can help to lead a healthier life,
automatic metadata generation [6] or information extraction       or where a visualization of mobility patterns can help to
[5], an essential technology if we want to collect metadata       explore alternative modes of transport, etc. Such visualiza-
of resources, activities and people at scale. Note also that,     tions are successful if they trigger the intended behaviour
if other people from the user’s network are near, tripit will     (change). That can be measured, as in ”people smoke less
mention that - see figure 3.                                      when they use this visualization” or ”people discover new
                                                                  publications based on this visualization” (we are actually
Of course, more mainstream tools like google offer similar        evaluating such an application) or ”people run more using
functionality, such as for instance ”google history” that pro-    this visualization” etc.
vides an overview of every search that a user ever submitted
(when logged in) or that indicates who from a user’s social       It would be really useful if we could draw up some guide-
circle tweeted about an item included in a search result, etc.    lines to design effective goal oriented visualizations. As an
                                                                  example, it is probably kind of useful to be able to visualise
                                                                  progress towards a goal - or lack thereof. If you want to run
3.   INSPIRATION FOR OUR WORK                                     further, a visualization can help you to assess whether you’re
A particularly inspiring set of applications comes from the       making progress. Or if you want to spend less time doing
domain of jogging, and sports in general, where applica-          email, a simple visualization can help. Another guideline
tions like nikeplus (http://nikerunning.nike.com/, see fig-       could relate to social support, that enables you to compare
ure 4) or runkeeper (http://runkeeper.com/) provide de-           your progress with that of others.
tailed statistics on how fast, far, often, etc. one runs.

What is particularly relevant in a learning context is that       5.   TECHNICAL INFRASTRUCTURE FOR
many running applications also help runners to set goals               LEARNING ANALYTICS
(”run a marathon in november”), develop a plan to achieve         If we want to apply learning analytics at a broader scale,
that goal, find running routes in a foreign town, locate other    then it is imperative that we realize an infrastructure that
runners with a similar profiles, challenge them so as to main-    can support the development of tools and services. Such an
tain motivation, etc. Sometimes, such tools even take a more      infrastructure will need basic technical agreement on com-
pro-active role and send messages to users to enquire why         mon standards and protocols [8].
they have stopped uploading activities, whether they need
to re-define goals and plans, or want to be connected to other    A first question is how to model the relevant data. Our
users that can help, etc.                                         early work on Contextualized Attention Metadata (CAM)
                                                                  [19] [36] defines a simple model to structure attention meta-
Although there are few studies that show whether these spe-       data, i.e. the interactions that people have with objects.
cial purpose social networks actually change user behavior,       The ontology-based user interaction context model (UICO)
[16] did find that ”users’ weight changes correlated positively   [24] focuses more on the tasks that people carry out while
with the number of their friends and their friends’ weight-       interacting with resources. Either we need to better un-
change performance” and ”users’ weight changes have rip-          derstand how to map and translate automatically between
pling effects in the Online Social Networks due to the so-        different such models, or we need to find a way to achieve
cial influence. The strength of such online influence and its     broad consensus on and adoption of a common schema or
propagation distance appear to be greater than those in the       a small set of schemas, as in the case of learning resources
real-world social network.”. An early overview of how the         where nearly everyone has now adopted Learning Object
combination of tracking and social network services can lead      Metadata (LOM) or Dublin Core (DC) [8].
to a more patient-driven approach to medicine is provided
in [32].                                                          Similar to the way we manage learning objects and their
                                                                  metadata [33], we will need a service architecture that can
One assumption underlying our work is that similar appli-         power a plethora of tools and applications. One interest-
cations can be built to track learner progress, to assist in      ing approach is to rely on technologies like widgets that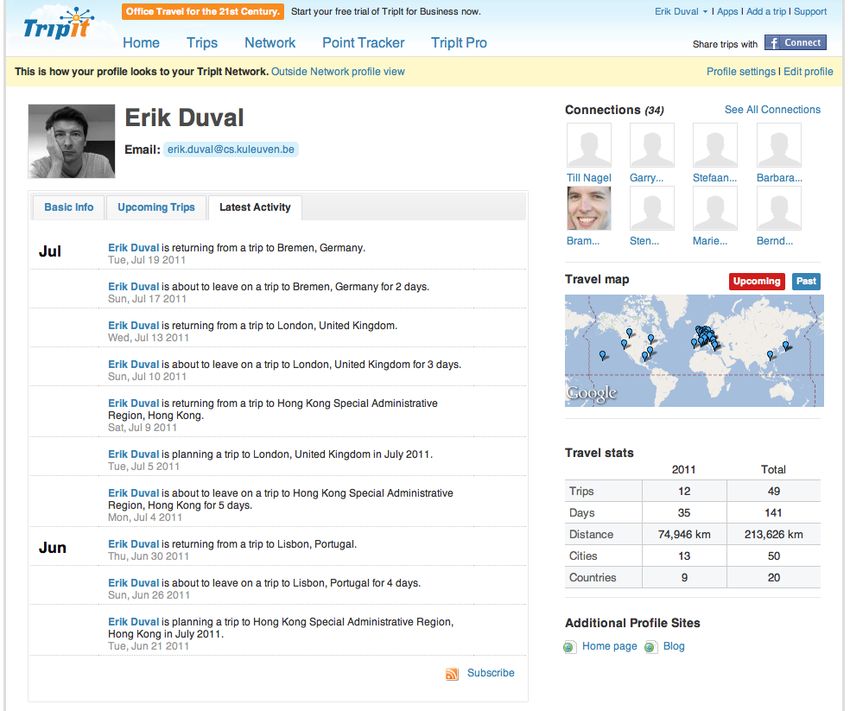
Figure 3: My tripit dahsboard

Figure 4: My Nike Plus dashboard
enable the dynamic embedding of small application com- For example, the green line (the logged in user) works on
ponents - an approach at the core of Personal Learning average in the early evening and is spending an average time
Environments (PLE’s), researched in the ROLE project on in line with the majority. He does not use so many different
Responsive Open Learning Environments (see http://www. documents and on average looks at these for a short time.
role-project.eu/) [15] [12]. Another approach is the Learn- He scores the worst here. The average student of the class
ing Registry architecture that makes ”user data trails” avail- (in yellow) is also presented. This is a somewhat complex
able through a network of nodes that provide services to visualization, but our evaluation studies show that students
publish, access, distribute, broker or administer paradata considered the visualizations clear [13]. They rated the tools
(see http://www.learningregistry.org/). as usable, useful, understandable and organized.
6. LEARNING DASHBOARDS A much more simple such visualization is edufeedr [21],
For learners and teachers alike, it can be extremely useful where a matrix includes a row for every student that dis-
to have a visual overview of their activities and how they plays his progress along a series of assignments. A nice fea-
relate to those of their peers or other actors in the learning ture is that such progress can take place on the individual
experience. blog of the student, outside of the institutional Learning
Management System (LMS), Virtual Learning Environment
In fact, such visualizations can also be quite useful for other (VLE) or even institution provided PLE widgets. Rather,
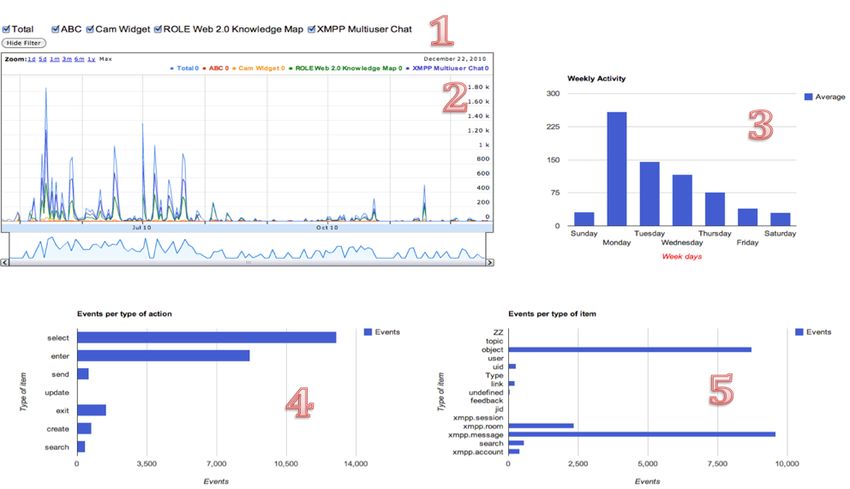
stakeholders, like for instance system administrators. Figure the coherence of the course is maintained through the track-
5 provides an early example of such a visualization that dis- back mechanism between the teacher blog and those of the
plays the number of events in different widgets deployed in students.
the ROLE context [27]. From the visualization, it is rather
obvious that users were most active in the May-July period What these visualizations have in common is that they en-
(towards the left of the diagram), that they enter chat rooms able a learner or teacher to obtain an overview of their own
(top of area 4 on Figure 5) much more often than they post efforts and of those of the (other) learners. This is the
messages (third row of area 4 on Figure 5), etc. Such in- essence of our ”dashboard” approach to visualizations for
formation can help a teacher to re-organize the activities or learning that remedy the ”blind driving” that often occurs on
even to retract or add widgets that learners can deploy in the side of teachers and learners alike. Similar approaches
their PLE. have proven to be beneficial in for instance software engi-
neering [3] and social data analysis [18].
Similarly, [28] describes a tool that includes a ”zeitgeist” of
action types (opening a document, sending a message, etc.) 7. LEARNING RECOMMENDERS
and specific user actions. By selecting a time period and the By collecting data about user behavior, learning analytics
relevant action types, the user can control the visualization can also be mined for recommendations, of resources, activ-
of relevant data (see also http://www.role-showcase.eu/ ities or people [17]. In this way, we can turn the abundance
role-tool/cam-zeitgeist). of learning resources into an asset, by addressing ”l’embarras
du choix” that is at the core of ”the paradox of choice”
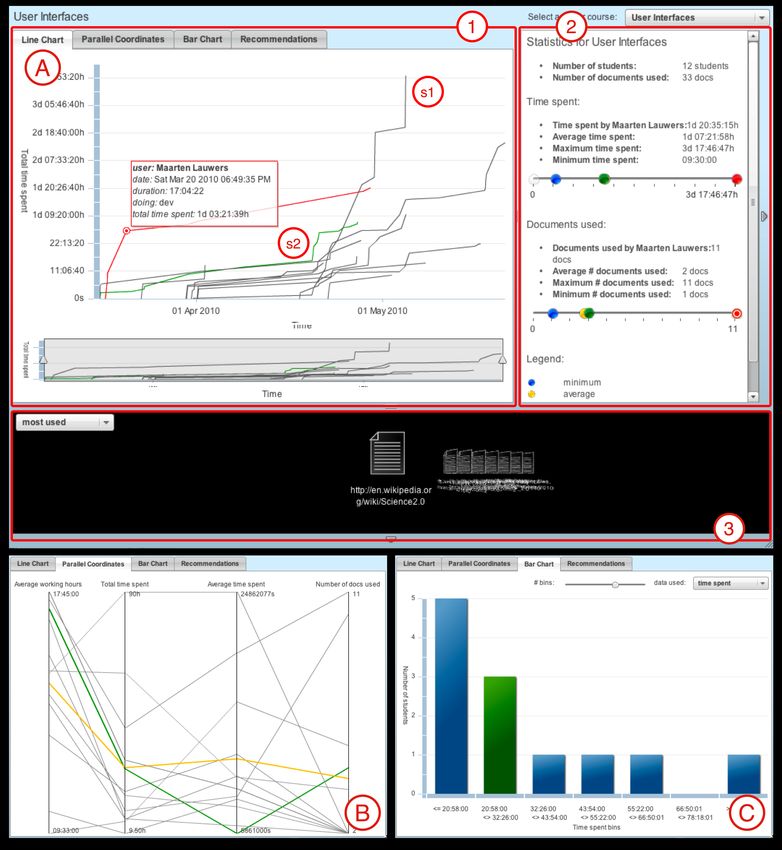
Following a similar visual approach, the Student Activity [29]. Of course, similar approaches have been deployed for
Monitor (SAM) supports self-monitoring for learners and books, music, entertainment, etc. Yet, only by basing rec-
awareness for teachers [13]: In area A on figure 6, every line ommenders on detailed learning attention metadata can they
represents a student in a course. The horizontal axis repre- take into account the learning specific characteristics and re-
sents calendar time and the vertical axis total time spent. quirements of our activities.
If the line ascends fast, then the student worked intensely
during that period. If the line stays flat, the student did not In one particular tool, we applied this approach to filter and
work much on the course. For example, student s1 started rank search results when a learner searches for material in
late and worked very hard for a very short time. Student YouTube (http://www.youtube.com/), SlideShare (http://
s2 started early and then worked harder in about the same www.slideshare.net/) and Globe (http://www.globe-info.
period as student s1. At the bottom, a smaller version of the org/): as figure 7 illustrates, every search activity in our tool
visualization is shown with a slider on top to select a part is tracked in the form of attention metadata that are stored
of the period for analysis of data dense areas. Area 2 dis- in a repository. The user can indicate whether search results
plays global course statistics on time spent and document are relevant or not and that feedback is also stored in the
use. The colored dots represent minimum, maximum and attention metadata repository. Search results are filtered
average time spent per student and the time spent for the and ranked based on earlier interaction by the user and by
currently logged in user and for a user selected in one of the other users in her social network, as made available through
visualizations. The recommendation area in Box 3 enables OpenSocial. Although we need to do more user evaluations,
exploration of document recommendations (see also section the first results are very encouraging [11, 20].
7). The parallel coordinates in area B display
8. DATA BASED RESEARCH ON LEARN-
1. the total time spent on the course,
ING
2. the average time spent on a document, On a meta-level, learning analytics provides exciting op-
3. the number of documents used and portunities to ground research on learning in data and to
transform it from what is currently all too often a collection
4. the average time of the day that the students work. of opinions and impossible-to-falsify conceptualizations and
Figure 2 CAM Dashboard overview
 At the top of the dashboard (label 1), there is the option of                       • Role Web 2.0 Knowledge Map. This widget allows to
                                        Figure 5: The CAM dashboard
                                                            search for articles by[27]
 filtering per application. The modification of this filter affects all
 visualizations. The charts are also interlinked. Table 1 presents
                                                                                   entering keywords.
 which actions trigger updates of other visualizations.                              • XMPP Multiuser Chat. This widget enables chat
                                                                                        functionality between different users based on the
                                                                                        XMPP technology.
                         Table 1 Actions overview
  Section        Action triggered             Affected      Sent Information
                                           visualizations

    1         Selecting an application        2,3,4,5       Name of the widget

    2         Restricting a period of          3,4,5           Starting date
                       time
                                                               Ending date

    3          Selecting a day of the       Visualizing
                                             2,4,5         Activities
                                                      Day of the week for Self-reflection and Awareness                                               5
                       week

    4        Selecting a type of action          5            Type of Action

    5         Selecting a type of item           4

 5. USE CASE: XMPP CHAT BEHAVIOR                                                         Figure 3 XMPP Multiuser Chat visualization

 This use case describes the behavior of a specific widget in a PLE              In this use case, we will focus on the XMPP Multiuser Chat
 environment, deployed during a course at RWTH Aachen                            widget because it is the most active in terms of event
 University during the period May to July 2010. After this period,               communication providing us more information about its particular
 the environment was occasionally used in an informal way. In this               characteristics. We will now explain how we can derive the
 PLE, four widgets were used. The widgets use Open Social [13]                   conclusions from:
 for their communication in a PLE.
                                                                                 1. Detect changes on usage patterns: When we select theXMPP
        • ABC Testing widget. This widget was only used during the                  Multiuser Chat in part 1 one of Figure 2 and we obtain an
           first two weeks (this information is also displayed in the               overview of the overall activity (Figure 3). The annotated time
           dashboard).                                                              line chart (Figure 3) enables us to see that the activity was
        • Cam Widget. This widget tracks the Open Social                            concentrated during the period from May to July 2010. After
           communication and translates this communication to                       this period, the activity was reduced considerably. In the
           CAM. Users can deactivate or activate tracking of their                  “events per type of action” chart (Figure 3), we can see that
           data.                                                                    people enter to room chats more than sending messages (if we

                       Fig. 1. The user interface with the 3 di↵erent visualizations.
            Figure 6: The Student Activity Monitor (SAM) [13]

    The parallel coordinates in visualization B are a common way to display
high-dimensional data [10]. On the vertical axes, we show (i) the total time spent
on the course, (ii) the average time spent on a document, (iii) the number of
documents used and (iv) the average time of the day that the students work. A
student is represented as a polyline connecting the vertices on the vertical axes.
The position of the vertex on the i-th axis corresponds to the i-th data point
coordinate. For example, the green line (the logged in user) works on average
in the early evening and is spending an average time in line with the majority.
He does not use so many di↵erent documents and on average looks at these for
a short time. He scores the worst here. The ‘average’ student of the class (in
yellow) is also calculated. This is a much more advanced visualization but can
provide a good overview of the tendencies in the behavior of the students.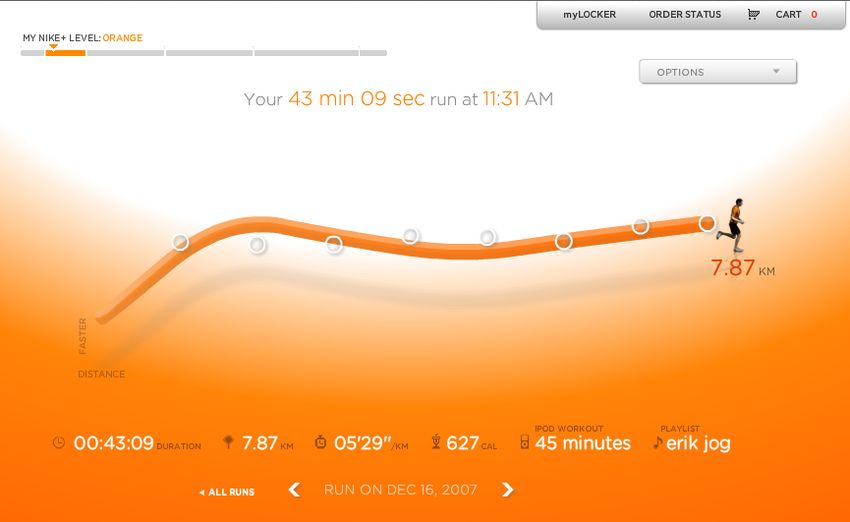
tent on your personal social
gle Buzz). Bing collaborates
ar functionalities: searching
and in content liked by your
al features based on its em-
king behavior and ratings to
ant blogs, wikis, forums and
ocial search is also a popu-
] extends mainstream search
s can create sharable search
these folders is used for rec- Figure
Figure1.7:The client-server
Storing architecture
attention metadata of in
thefederated
federated search
searchand
[11]
ows people to create search recommendation service.
queries andtheories
results[23].
in these Some people are quite concerned about the ”filter bubble”
e-rank the search results.
itory4 , but extra sources can be easily added to support
that personalization dif-
and recommendation engines may cre-
As a precursor to making that happen, it is important that ate [22]: we agree that there is a certain danger there, but
repositories,
weone
agreecan ways to shareferent
on apply learning
data sets, in an scenarios.
”open science” When we all also
the believe
resultsthat are more
returned
advanced algorithms and ethical
which collects all the meta-
approach [26, 9, 14]. That from
is whythe
a data
group sources
of interested(step re- 3), the federated
reflection can search
help us service
to address these issues.
ntral repository for faster re- re-ranks
searchers has started an initiative the results
around ”dataTEL” (step(http:4) based on the metadata with the
Apache
//www.teleurope.eu/pg/groups/9405/datatel/
h vast repositories of web is2.0 Lucene library
[34].[14].
The The In ranked results
any case, are returned
we believe that learning analytics can be used
main objective to promote exchange and interoperability to put the user in control, not to take control away in an
mpossible to ofapply harvested
educational data sets.
to the widget in the ATOM format [15] (step 5), which en-
Intelligent Tutoring Systems kind of way, by using attention
h is concerned, Ariadne [11] ables us in the future to make the toservice
filter OpenSearch
and suggest, provide com-awareness and support social
9. CONCLUSION
between different reposito- pliant [16]. OpenSearch allows search
links. engines to publish
on the Standard QueryoneLan-
Of course, of the bigsearch
problemsresults
around in learning
a standard ana-and open format to enable syn-
lack of clarity about what exactly should beIn future,
dication and aggregation. 10. we ACKNOWLEDGMENTS
plan to adapt the
rability and lytics is the
to offer a trans- This research has received funding from the European Com-
measured to get a deeperservice to return results every time
understanding of how learning the repositories return
f repositories. Ariadneplace:also munity Seventh Framework Programme (FP7/2007-2013)
is taking
plied in the GLOBE them to
typical measurements improve
includesearch speed.
time spent, Once the widget receives the (ROLE) and no. 231913
number ofnetwork
logins, number of mouse clicks, number of ac- under grant agreement no. 231396
and WebFeat provide
cessed feder-
resources, search results, they
number of artifacts produced, number ofare presented to the
(STELLAR). user and
Much themoresearch
importantly, the support, com-
ent [12]. WebFeat
finished sends result URLs are sent
the etc. But is this really getting to the
assignments, to the recommendation
ments and service
feedback (step
from my 6).
team and students have thought
me much more than I will ever be able to teach them.
heart of the matter?
then shows the results in all This service will return recommendations, based on the at-
ntrast with MetaLib tention metadata stored in the database. 11. REFERENCESThe recommenda-
Moreover,that uses
there are serious issues about privacy when de-
with the repositories
tailed data over tions are sent back
the interactions are tracked [4]. An in-
of learner to the widget, where they will
[1] C. Anderson. The be Endpre-
of Theory: The Data Deluge
ObjectSpot [13] is originally
teresting early approach sented
to deal to
with the user.
these issuesThewas user
the can interact Makeswith
the the search
Scientific re-
Method Obsolete. Wired
proposal of the no longer sults,active e.g. preview a movie inside the widget or (dis)like it.
not for profit ”Attention- Magazine, 16(7), 2008.
cientific publications, but it
When
Trust” [35]: their guiding principles
ources. It uses a cover den- some of these interactions [2]
included G. Bell they
happen, and J.are
Gemmel.
tracked Your life, uploaded. Plume,
2010.
h results, which can also be and the attention metadata (basically the user, the URL of
[3] J. Biehl, M. Czerwinski, G. Smith, and G. Robertson.
• property: the data about
ommendations based on the the search
a person’sresult and
attention the
remain action) is sent to the arecommen-
FASTDash: visual dashboard for fostering awareness
the property of that dation
person; service (step 7). The service then stores
in software the
teams.attention
In Proceedings of the SIGCHI
are also provided. Extending
was not trivial •due to the use
mobility:
metadata in a database
it should be possible to move data about a
(step 8) to be able to calculate
conference on Human recom-
factors in computing systems,
pages 1313–1322. ACM, 2007.
ne of these federated
personsearch mendations
out of one system and intolater.
another Thesystem
next section
- describes the recommen-
[4] D. Boyd. Facebook’s Privacy Trainwreck: Exposure,
see also google’s recent
or social search results. Just dation
data algorithm in more
liberation initiative detail.
(see The client-server
Invasion, and Socialarchitec-
Convergence. Convergence: The
ture enables
http://www.dataliberation.org/);
re exploring social networks us to expose repositories not openly
International accessible
Journal of Research into New Media
& sharing), we• adopted
economy: this
by deploying the service
a person should be able to sell data about
inside the intranet.
Technologies, 14(1):13–20, 2008.
[5] C.-H. Chang, M. Kayed, M. R. Girgis, and K. F.
engine. his attention;
Shaalan. A Survey of Web Information Extraction
User Interface Design
• transparency: it should always be clear to a person
Systems. IEEE Transactions on Knowledge and Data
The main design goal was to provide Engineering, 18:1411–1428,
a simple, clean search 2006.
that she is being tracked.
T [6] N. Corthaut, S. Lippens, S. Govaerts, E. Duval, and
interface with visually rich search results to enable better
J.-P. Martens. The integration of a metadata
chitecture behind the search decision making
tools while selecting a search result.framework
generation The widgetin a music annotation workflow.
er interface Especially
(UI) designthat last principle
and
(http://www.ghostery.com/)
seems key:
provides
enableaasimple
like ghostery
user to Google-like
know when search Oct.interface
2009. over multiple
website.
she is being tracked on a web 2.0Asdata sources.
we evolve Although
towards a advanced
[7] search
A. Croll and settings
S. Power. Complete Web Monitoring.
areactivities,
world where not only learning availablebut (see Figure
virtually 3), they are O’Reilly
every- Media,
not visible byInc., 2009.
default.
thing will be tracked [2], this issue is likely to become even
more important.
Morville et al. [2] advice this as[8]well, E. Duval and K. Verbert. On the role of technical
because advanced
standards for learning technologies. IEEE
search is often used by expert users. Figure 3 shows the ad-
data sources, we employ a vanced search settings where the wanted media types, repos-
own in Figure 1. When the itories and social recommendations can be configured. This
sent to the federated search can be operated with the wrench icon.
ts it to all the different data
urrently it queries YouTube, The search results are presented in a uniform way (see Fig-
OBE and the OpenScout repos- ure 2): basic metadata and tags together with a screenshot
4
okered Exchange (GLOBE) al- The OpenScout repository, http://www.openscout.net/
nfo.org demo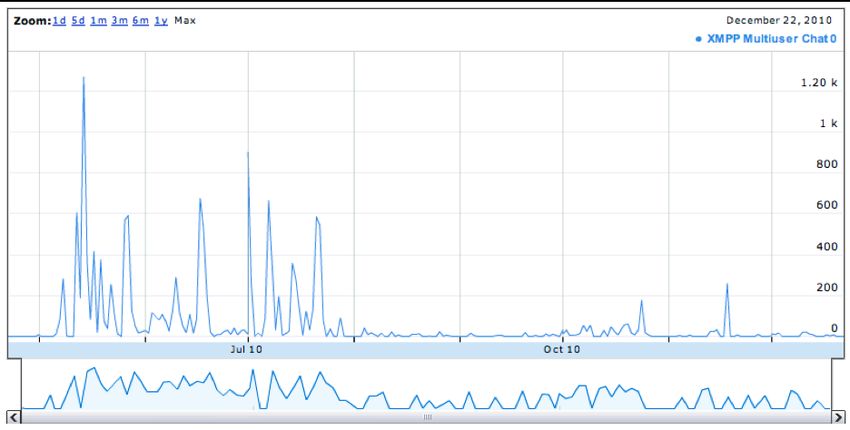
Transactions on Learning Technologies, 1(4):229–234,            OpenEd2010, number 2010. Universitat Oberta de
       Oct. 2008.                                                      Catalunya, 2010.
 [9]   J. Fry, R. Schroeder, and M. den Besten. Open science    [22]   E. Pariser. The Filter Bubble: What the Internet Is
       in e-science: contingency or policy? JOURNAL OF                 Hiding from You. Penguin Press, 2011.
       DOCUMENTATION, 65(1):6–32, 2009.                         [23]   K. Popper. The Logic of Scientific Discovery.
[10]   M. H. Goldhaber. The Attention Economy and the                  Routledge, 1959.
       Net. First Monday, 2(4), Apr. 1997.                      [24]   A. S. Rath, D. Devaurs, and S. Lindstaedt. UICO: an
[11]   S. Govaerts, S. E. Helou, E. Duval, and D. Gillet. A            ontology-based user interaction context model for
       Federated Search and Social Recommendation                      automatic task detection on the computer desktop. In
       Widget. In Proceedings of the 2nd International                 Proceedings of the 1st Workshop on Context,
       Workshop on Social Recommender Systems (SRS                     Information and Ontologies, CIAO ’09, pages
       2011) in conjunction with the 2011 ACM Conference               8:1—-8:10, New York, NY, USA, 2009. ACM.
       on Computer Supported Cooperative Work (CSCW             [25]   C. Romero and S. Ventura. Educational data mining:
       2011), pages 1–8, 2011.                                         A survey from 1995 to 2005. Expert Systems with
[12]   S. Govaerts, K. Verbert, D. Dahrendorf, C. Ullrich,             Applications, 33(1):135–146, July 2007.
       S. Manuel, M. Werkle, A. Chatterjee, A. Nussbaumer,      [26]   S. S. Sahoo, A. Sheth, and C. Henson. Semantic
       D. Renzel, M. Scheffel, M. Friedrich, J. L. Santos,             provenance for eScience - Managing the deluge of
       E. Duval, and E. L.-c. Law. Towards Responsive Open             scientific data. IEEE INTERNET COMPUTING,
       Learning Environments : the ROLE Interoperability               12(4):46–54, 2008.
       Framework. In ECTEL11: European Conference on            [27]   J. L. Santos, K. Verbert, S. Govaerts, and E. Duval.
       Technology Enhanced Learning, Lecture Notes in                  Visualizing PLE Usage. In Proceedings of EFEPLE11:
       Computer Science, 2011.                                         1st Workshop on Exploring the Fitness and
[13]   S. Govaerts, K. Verbert, J. Klerkx, and E. Duval.               Evolvability of Personal Learning Environments.
       Visualizing Activities for Self-reflection and                  CEUR workshop proceedings, 2011.
       Awareness. In Proceedings of the 9th international       [28]   H. Schmitz, M. Scheffel, M. Friedrich, M. Jahn,
       conference on Web-based Learning, pages 91–100.                 K. Niemann, and M. Wolpers. CAMera for PLE. In
       Springer, 2010.                                                 U. Cress, V. Dimitrova, and M. Specht, editors,
[14]   T. Hey and A. E. Trefethen. Cyberinfrastructure for             Learning in the Synergy of Multiple Disciplines,
       e-Science. Science, 308(5723):817–821, 2005.                    volume 5794 of Lecture Notes in Computer Science,
[15]   U. Kirschenmann, M. Scheffel, M. Friedrich,                     pages 507–520. Springer, 2009.
       K. Niemann, and M. Wolpers. Demands of Modern            [29]   B. Schwartz. The paradox of choice - Why more is
       PLEs and the ROLE Approach. In M. Wolpers,                      less. HarperCollins, 2007.
       P. Kirschner, M. Scheffel, S. Lindstaedt, and            [30]   C. Shirky. Here Comes Everybody: The Power of
       V. Dimitrova, editors, Sustaining TEL: From                     Organizing Without Organizations. Penguin Press,
       Innovation to Learning and Practice, volume 6383 of             2008.
       Lecture Notes in Computer Science, pages 167–182.        [31]   E. Singer. The Measured Life. Technology Review,
       Springer, 2010.                                                 2011.
[16]   X. Ma, G. Chen, and J. Xiao. Analysis of An Online       [32]   M. Swan. Emerging patient-driven health care models:
       Health Social Network. In Proceedings of the 1st ACM            an examination of health social networks, consumer
       International Health Informatics Symposium, pages               personalized medicine and quantified self-tracking.
       297–306. ACM, 2010.                                             International journal of environmental research and
[17]   N. Manouselis, H. Drachsler, R. Vuorikari,                      public health, 6(2):492–525, Feb. 2009.
       H. Hummel, and R. Koper. Recommender Systems in          [33]   S. Ternier, K. Verbert, G. Parra, B. Vandeputte,
       Technology Enhanced Learning. In F. Ricci,                      J. Klerkx, E. Duval, V. Ordonez, and X. Ochoa. The
       L. Rokach, B. Shapira, and P. B. Kantor, editors,               Ariadne Infrastructure for Managing and Storing
       Recommender Systems Handbook, pages 387–415.                    Metadata. IEEE Internet Computing, 13(4):18–25,
       Springer US, 2011.                                              July 2009.
[18]   M. McKeon. Harnessing the web information                [34]   K. Verbert, E. Duval, H. Drachsler, N. Manouselis,
       ecosystem with wiki-based visualization dashboards.             M. Wolpers, R. Vuorikari, and G. Beham.
       IEEE transactions on visualization and computer                 Dataset-driven Research for Improving TEL
       graphics, 15(6):1081–8, 2009.                                   Recommender Systems. In 1st International
[19]   J. Najjar, M. Wolpers, and E. Duval. Contextualized             Conference on Learning Analytics and Knowledge,
       attention metadata. D-Lib Magazine, 13(9/10), Sept.             Banff, Canada, 2011.
       2007.                                                    [35]   M. Wolpers, J. Najjar, and E. Duval. Workshop report
[20]   X. Ochoa and E. Duval. Use of contextualized                    on the international {ACM} workshop on
       attention metadata for ranking and recommending                 contextualized attention metadata: collecting,
       learning objects. In CAMA06: Proceedings of the 1st             managing and exploiting rich usage information (cama
       international workshop on Contextualized attention              2006), June 2007.
       metadata: collecting, managing and exploiting of rich    [36]   M. Wolpers, J. Najjar, K. Verbert, and E. Duval.
       usage information, pages 9–16, 2006.                            Tracking actual usage: the attention metadata
[21]   H. Põldoja. EduFeedr-following and supporting                  approach. Educational Technology and Society,
       learners in open blog-based courses. In Proceedings of          10(3):106–121, 2007.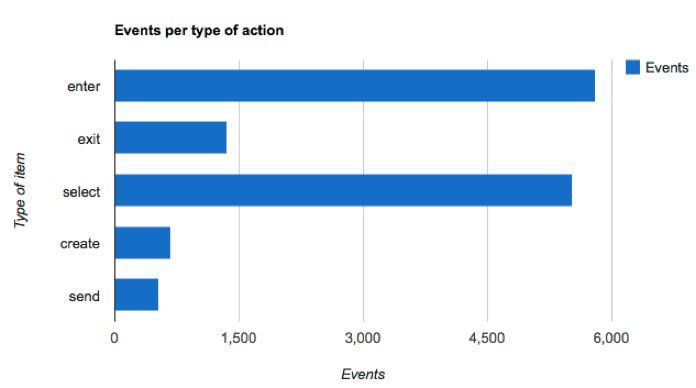
You can also read