The Effect of the Surface Wind Field Representation in the Operational Storm Surge Model of the National Hurricane Center - MDPI
←
→
Page content transcription
If your browser does not render page correctly, please read the page content below
atmosphere
Article
The Effect of the Surface Wind Field Representation
in the Operational Storm Surge Model of the National
Hurricane Center
Talea Mayo 1, *,† and Ning Lin 2
 1   Department of Civil, Environmental, and Construction Engineering, University of Central Florida,
     Orlando, FL 32816, USA
 2   Department of Civil and Environmental Engineering, Princeton University, Princeton University,
     Princeton, NJ 08544, USA; nlin@princeton.edu
 *   Correspondence: talea.mayo@ucf.edu
 †   Current address: 4000 Central Florida Blvd; Orlando, FL 32816, USA.

 Received: 17 February 2019; Accepted: 3 April 2019; Published: 9 April 2019

 Abstract: The Sea, Lake, and Overland Surges from Hurricanes (SLOSH) model is the operational
 storm surge model of the National Hurricane Center (NHC). Previous studies have found that
 the SLOSH model estimates storm surges with an accuracy of ±20%. In this study, through
 hindcasts of historical storms, we assess the accuracy of the SLOSH model for four coastal regions in
 the Northeastern United States. We investigate the potential to improve this accuracy through
 modification of the wind field representation. We modify the surface background wind field,
 the parametric wind profile, and the maximum wind speed based on empirical, physical, and
 observational data. We find that on average the SLOSH model underestimates maximum storm
 surge heights by 22%. The modifications to the surface background wind field and the parametric
 wind profile have minor impacts; however, the effect of the modification to maximum wind speed
 is significant—it increases the variance in the SLOSH model estimates of maximum storm surges,
 but improves its accuracy overall. We recommend that observed values of maximum wind speed be
 used in SLOSH model simulations when possible.

 Keywords: storm surge; SLOSH model; parametric wind profile; maximum wind speed

1. Introduction
     Storm surges, i.e., coastal floods, pose the greatest threat to life and property loss during severe
hurricanes in the United States [1–4]. The prediction of these hazards is vital for preventing casualties
and property damage. The extent of storm surge is dependent on many factors, including the
topography of the coastline, the slope of the continental shelf, and the bottom friction of the coastal
ocean floor [5–9]. The shallow water equations, which consist of continuity and momentum equations,
can be developed and solved numerically for a region of interest to quantify these dependencies and
model the storm surges with great accuracy (see e.g., [10–12]). However, one of the primary sources of
uncertainty in storm surge modeling is the atmospheric forcing, i.e., the hurricane itself. When storm
surges are hindcasted using detailed hydrodynamic models and accurate representations of the surface
wind field, the simulated hydrodynamics are effectively replicated (e.g., [10,13–16]). However, for
operational forecasting, measurements of the full surface wind field are unavailable [17], and hurricane
wind fields are often represented parametrically, using a small number of storm characteristics that can
be more readily obtained. Furthermore, many storm surge simulations are often desired to capture and
communicate uncertainty. Minimal computational cost of the numerical storm surge model is requisite

Atmosphere 2019, 10, 193; doi:10.3390/atmos10040193                            www.mdpi.com/journal/atmosphere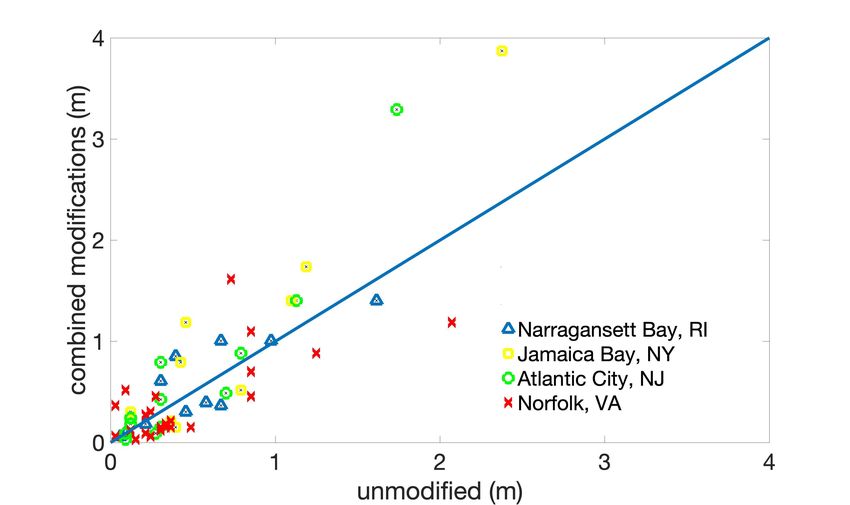
Atmosphere 2019, 10, 193                                                                          2 of 21

to produce these ensemble forecasts regularly, and in time for coastal residents to evacuate to areas of
safety; the use of very detailed hydrodynamic models is currently not feasible for this purpose.
      To this end, the Sea, Lake, and Overland Surges from Hurricanes (SLOSH) model was developed
by the National Weather Service (NWS) in the 1970s, and remains the operational storm surge model
of the National Hurricane Center (NHC) today [17]. Finite difference schemes are used to discretize
two-dimensional shallow water equations in both space and time. Standardized discretizations of
the spatial domains used in the model are called basins, and range in resolution from hundreds to
thousands of meters. Polar, elliptical, or hyperbolic grids are used to allow increased resolution near
coastlines, bays, and estuaries. The basins are defined using topographic and bathymetric data that
are averaged across each grid cell. This data is obtained from the U.S. Geological Survey (USGS)
and the National Oceanic and Atmospheric Administration (NOAA) National Geophysical Data
Center, respectively, and updates are incorporated into the basins every several years. Currently, the
operational version of the SLOSH model does not include wave setup, wave runup, or freshwater
flooding. Initially, NWS forecasters opted to also exclude tides so that they could be added based on
the predicted time of landfall [18]. In the version of the SLOSH model used for this study, astronomical
tides are not included; however, the model has recently been updated to include them.
      The SLOSH model has been used to develop two composite products, the Maximum Envelope
of Water (MEOW), and the Maximum of MEOWs (MOM). The MEOW products are the maximum
storm surge heights attained at each point in the model domain when modeling thousands of synthetic
storms with identical storm parameters but different, parallel tracks. The MOM products are the
maximum storm surge heights attained by combining all the MEOW surge results from storms of the
same category on the Saffir-Simpson scale. Additionally, the SLOSH model has been used to develop
probabilistic storm surge (P-surge) forecasts. These forecasts are developed from an ensemble of
forecasts obtained by sampling from a normal distribution of uncertain storm parameters (track, size,
forward speed, and intensity). The surge ensembles are then used to compute exceedance probabilities,
which are used by the NHC and emergency managers to assess risk of both real-time guidance and
long-term planning [18,19]. Due to its extreme computational efficiency, the SLOSH model is often
used in a similar manner for other probabilistic assessments of risk [20–22].
      The SLOSH model implements a parametric wind model to represent the surface wind field
used to approximate the surface wind stresses in the momentum equations. In general, parametric
wind models approximate the surface wind field as the sum of the background wind speed of the
atmosphere, Vb , and the axisymmetric wind speed, V, of the storm. The definition used for each
of these components differentiates various parametric wind field models that have been developed,
e.g., [13,16,23,24]. In the SLOSH model, the background wind field is modeled as a radially variable
fraction of the storm’s translational speed, Vs , and the axisymmetric wind profile is modeled as a
radially variable fraction of the storm’s maximum wind speed, Vmax . Both fractions increase from zero
in the eye of the storm to a maximum value at the radius of maximum wind speed, Rmax , and then
decrease toward the storm’s outer radius. Previous studies have shown that storm surges simulated
by the SLOSH model have errors ranging from 0–20% [17,19]; however, the sensitivity of this error
to various model components is not well understood. Specifically, it is not clear whether the SLOSH
model can be improved by improving the wind field representation.
      In this work, we investigate the effect of the surface wind field representation on storm surge
predictions of the SLOSH model. We focus on four regions along the North Atlantic coast of the
United States, which will likely see increasing numbers of hurricanes and storm surges over the
coming decades [20,21,25]. We hindcast the storm surges of several historical hurricanes, and assess
the impacts of three changes to the parametric wind field model currently implemented in the SLOSH
model. First, we change the background wind field from a variable factor of the forward speed of the
storm to a constant, rotated factor empirically derived in [26]. Second, we change the axisymmetric
wind profile from that which was empirically formulated for the SLOSH model to a theoretical model
developed in [27]. Finally, we remove the iterative process currently used in the SLOSH model to
Atmosphere 2019, 10, 193                                                                           3 of 21

calculate the maximum velocity of a storm from the pressure deficit, and instead allow this value to be
input to the model explicitly. We investigate both the individual and combined effects of these changes.

2. Materials and Methods

2.1. Surface Background Wind
      The translational movement of a tropical cyclone is due to advection by the background wind
in the free troposphere. Thus, the translational velocity of a hurricane, Vs , and the background wind
velocity of the atmosphere, Vb , are related. However, they are not identical, as surface friction causes
deviations in both the magnitude and direction of the two velocities [28]. The background wind speed
can generally be expressed as a rotated fraction of Vs . In many parametric wind models, the rotation of
Vs is assumed to be negligible, and the fraction ranges from zero (i.e., background wind is not included
at all) to 1.0 [21,29–33].
      In the SLOSH model, the degree of rotation is considered negligible, and Vb is modeled as a
variable fraction of the storm’s translational speed,

                                                     Rmax r
                                        Vb (r ) =             |Vs |,                                  (1)
                                                    Rmax + r2
                                                     2

where r is the radial distance from the center of the storm. This formula was empirically derived, and
though it has been described as “potentially faulty” for fast-moving, weak storms, it has been shown
to be adequate for storms of moderate to extreme intensity [17].
     In [26], the observed surface wind fields of tropical cyclones in the Atlantic that occurred between
1998–2009 were analyzed. A pronounced deceleration and rotation from Vs to Vb was found, indicating
that neither deceleration nor rotation should be neglected for the accurate approximation of the surface
background wind field. Specifically, it was shown that the incorrect specification of either resulted
in errors as high as 33% in simulations of storm surges near New York City. It was determined that
Vb should be approximated as a constant factor, 0.55, of |Vs |, rotated 20◦ counter-clockwise. In this
work, we implement this finding in place of the unrotated, radially variable factor currently used in
the SLOSH model (1), i.e.,

                           Vb (r ) = 0.55|Vs |, rotated 20◦ counter-clockwise.                        (2)

2.2. Parametric Wind Profile
     In a study of synthetic, high impact, low frequency events in Tampa Bay, FL [26], it was determined
that although the choice of the axisymmetric wind profile, V (r ), had only a moderate effect on the
values of peak winds, its impact on associated storm surges was more substantial. There are several
prominent descriptions of V (r ) (e.g., [27,34–37]). In the SLOSH model, the wind field is modeled as

                                                     2Rmax r
                                        V (r ) =               Vmax .                                 (3)
                                                    R2max + r2

     This description was originally developed in the 1960s for storms with Rmax between 10 and
50 miles [38], and values of Vmax near 100 mph [39]. The wind model was described as an “arbitrary
choice to form a simple algebraic formulation of the wind speed,” and was designed to reduce the
sensitivity of modeled storm surges to errors in the wind field.
     Several studies have shown that the SLOSH model sufficiently represents hurricane wind
fields [40–42]; however, it is expected that the wind profile can be better approximated by including
some of the known physical mechanisms that occur in the storm. Different mechanisms define the
winds in the inner and outer regions of the storm. Here, the inner region of the storm describes the
region near the eyewall, and the outer region describes the regions at radii farther away. In [37],
asymptotic solutions of the equations describing the profile in each of these regions were merged.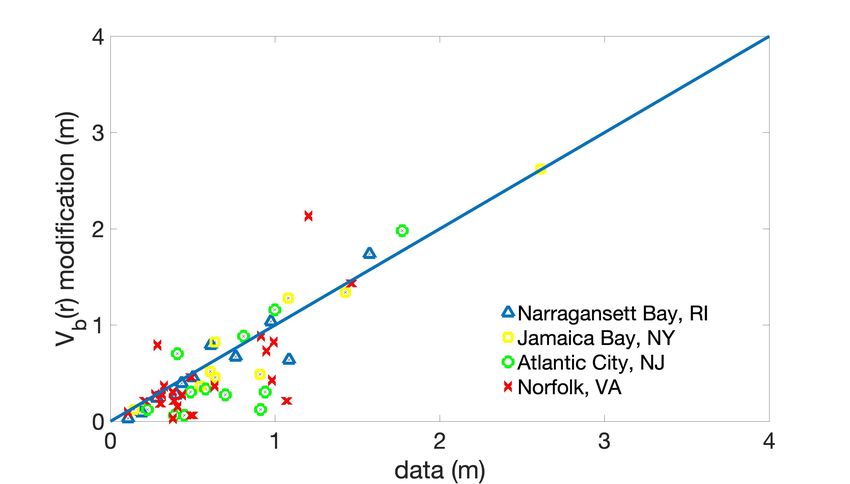
Atmosphere 2019, 10, 193                                                                                4 of 21

The inner region profile was then improved in [27], and the asymptotic solution of the full profile has
been approximated as
                                        2( Rmax Vmax + 12 f R2max )r  fr
                               V (r ) =                              − ,                             (4)
                                                R2max + r2            2
where f is the Coriolis parameter. Note that if Coriolis effects are neglected, this profile is by coincidence
identically equal to that used in the SLOSH model. The physical assumptions used to develop this
profile can be violated in the outer region of the storm, and thus the model is presumably less accurate
in this region. (In [36], the model representing the outer region was improved, but the improved
model is too complex to be readily incorporated into the SLOSH model.) Additionally, the profile is
not ideally described near the center of the storm, as it does not account for radial diffusion in the
eye. However, the profile is extremely accurate near Rmax , the region which most significantly affects
maximum storm surges. Here we implement this model in place of (3).

2.3. Maximum Wind Speed
      As seen in Section 2.2, parametric wind profiles commonly describe the axisymmetric wind
field as a function of Vmax , one of the few storm parameters that directly impacts the magnitude and
extent of storm surges. Unfortunately, this value is not always available; in [38] it was described as a
“distressingly difficult parameter to measure or observe,” and even for the most recent tropical cyclone
events, maximum wind speeds are rarely directly measured [43]. Central pressure is correlated with
Vmax , and the SLOSH model was developed to use an iterative procedure to estimate Vmax from the
more readily available storm parameter, ∆P, the pressure deficit (i.e., the difference in atmospheric
pressure between the storm center and the environment), and Rmax . However, the pressure-wind
relationship has significant variability and the effects of this estimation on storm surge modeling are
not well studied. In this work, we modify the SLOSH model to directly read values of Vmax , observed
or estimated from improved methods.

2.4. Hindcasts
      We study the impacts of the wind field representation by hindcasting tropical cyclones that
occurred between 1988 and 2012 and affected four regions along the North Atlantic coast: Narragansett
Bay, Rhode Island; Jamaica Bay, New York; Atlantic City, New Jersey; and Norfolk, Virginia.
These regions are chosen for study as they were identified as increasingly geographically, socially,
and economically vulnerable to storm surges and used as the study sites for the project, Structures
of Coastal Resilience [25], which complemented the North Atlantic Coast Comprehensive Study of
the U.S. Army Corps of Engineers. In the end, we simulate 11 storms for Narragansett Bay, 9 storms
for Jamaica Bay, 12 storms for Atlantic City, and 23 storms for Norfolk. Several storms affected more
than one study site, and are thus represented more than once in the total set of 55 simulations. These
tropical cyclones are listed in Table 1. We have excluded a small number of storms for which the
SLOSH model develops numerical instabilities.
      To hindcast the storms, we use Extended Best Track datasets [44], developed by supplementing
NOAA HURricane DATabases (HURDAT), to create “.trk” files, SLOSH model input files that define
hurricane parameters. Maximum wind speed data is added to the standard .trk files for the simulations
where this value is to be input directly. Five versions of the SLOSH model (the original version, three
versions incorporating each of the three modifications individually, and one version incorporating
the combination of all three) are used to simulate the resulting storm surges on the most appropriate
SLOSH model basin for the study site: pv2 for Narragansett Bay, ny3 for Jamaica Bay, acy for Atlantic
City, and or3 for Norfolk (Figure 1).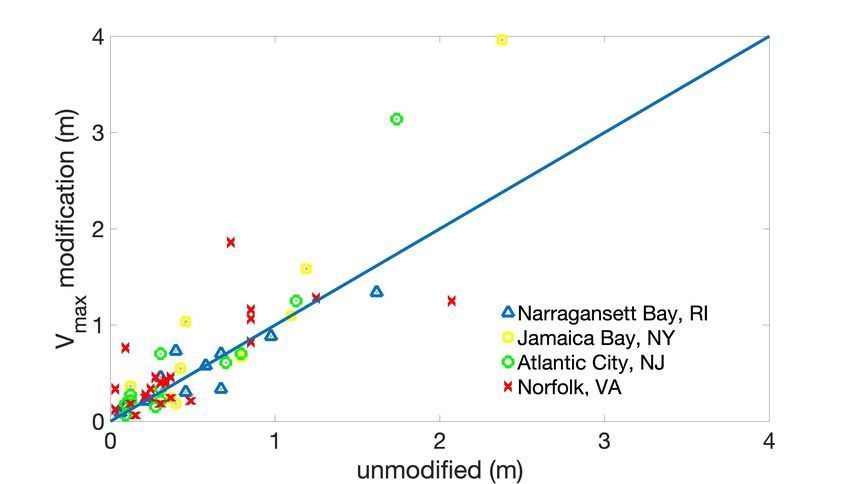
Atmosphere 2019, 10, 193                                                                                    5 of 21

                       Figure 1. SLOSH basins used in the hindcasts conducted for this study.

                           Table 1. Historical tropical cyclones simulated for each study site.

                                                         Category at       Maximum Storm Surge Calculated
      Name                                   Date
                                                         Peak Intensity    from NOAA Tide Gauge Data (m)
      Narragansett Bay, Rhode Island
      Bob                                    08/1991     3                 1.57
      Grace                                  10/1991     2                 1.09
      Bertha                                 07/1996     3                 0.43
      Edouard                                08/1996     4                 0.28
      Josephine                              10/1996     TS                0.61
      Danny                                  07/1997     1                 0.11
      Floyd                                  09/1999     4                 0.76
      Ophelia                                09/2005     1                 0.19
      Hanna                                  09/2008     1                 0.40
      Earl                                   09/2010     4                 0.50
      Irene                                  08/2011     3                 0.98
      Jamaica Bay, New York
      Bob                                    08/1991     3                 0.63
      Bertha                                 07/1996     3                 0.61
      Josephine                              10/1996     TS                0.91
      Floyd                                  09/1999     4                 1.08
      Allison                                06/2001     TS                0.14
      Barry                                  06/2007     1                 0.55
      Hanna                                  09/2008     1                 0.64
      Irene                                  08/2011     3                 1.43
      Sandy                                  10/2012     3                 2.61
      Atlantic City, New Jersey
      Bob                                    08/1991     3                 0.41
      Bertha                                 07/1996     3                 0.58
      Josephine                              10/1996     TS                0.94
      Danny                                  07/1997     1                 0.45
      Floyd                                  09/1999     4                 0.81
      Helene                                 09/2000     TS                0.39
      Allison                                06/2001     TS                0.23
      Ernesto                                08/2006     1                 0.91
      Barry                                  06/2007     1                 0.49
      Hanna                                  09/2008     1                 0.70
      Irene                                  08/2011     3                 1.00
      Sandy                                  10/2012     3                 1.77 *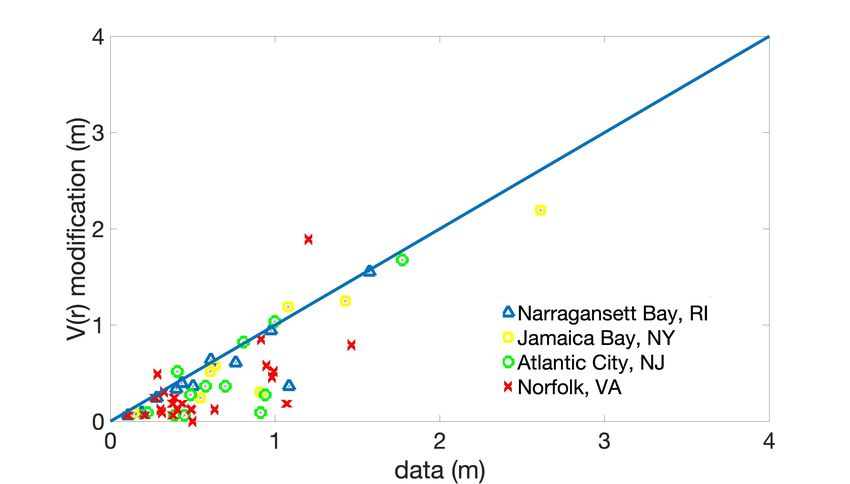
Atmosphere 2019, 10, 193                                                                                    6 of 21

                                                         Table 1. Cont.

                                                   Category at          Maximum Storm Surge Calculated
               Name                   Date
                                                   Peak Intensity       from NOAA Tide Gauge Data (m)
               Norfolk, Virginia
               Bob                    08/1991      3                    0.29
               Emily                  08/1993      3                    0.99
               Allison                06/1995      1                    0.27
               Bertha                 07/1996      3                    0.44
               Fran                   09/1996      3                    0.49
               Josephine              10/1996      TS                   0.98
               Danny                  07/1997      1                    0.49
               Bonnie                 08/1998      3                    0.95
               Earl                   09/1998      2                    0.39
               Dennis                 09/1999      2                    0.63
               Floyd                  09/1999      4                    0.91
               Helene                 09/2000      1                    0.38
               Gustav                 09/2002      2                    0.38
               Kyle                   10/2002      1                    0.50
               Isabel                 09/2003      5                    1.46
               Alex                   09/2004      3                    0.41
               Ophelia                09/2005      1                    0.31
               Ernesto                08/2006      TS                   1.07
               Barry                  06/2007      TS                   0.32
               Cristobal              07/2008      TS                   0.11
               Hanna                  09/2008      1                    0.21
               Irene                  08/2011      3                    1.20
               Beryl                  05/2012      TS                   0.30
                       * tide gauge failed to measure water levels for the entire duration of this storm.

      For each simulation, the SLOSH model produces a “.rex” file, a binary output file containing a
time series of the storm surges computed on each grid cell in the respective SLOSH basin. Maximum
storm surge data is extracted from these files for the basin grid cells corresponding to locations of
interest. Here, we choose locations corresponding to four NOAA tide gauge stations near each study
site, Stations 8452660, 8531680, 8534720, and 8638863 for Narragansett Bay, Jamaica Bay, Atlantic City,
and Norfolk, respectively (Table 2).

                   Table 2. NOAA tide gauge stations used to estimate maximum storm surges.

                             Location                   Station ID    Latitude        Longitude
                             Narragansett Bay,          8452660       41◦ 30.20   N   71◦ 19.60 W
                             Rhode Island
                             Jamaica Bay,               8531680       40◦ 280 N       74◦ 0.60 W
                             New York
                             Atlantic City,             8534720       39◦ 21.40 N     74◦ 25.10 W
                             New Jersey
                             Norfolk,                   8638863       36◦ 580 N       76◦ 6.80 W
                             Virginia

2.5. Storm Surge Data
      Hurricane storm surge data is generally sparse, spatially discontinuous, and lacks time history
(e.g., in the case of high-water marks). Here we compare modeled storm surge heights to storm
surge residuals calculated from NOAA tide gauge data. For each study site, we use data from the
NOAA tide gauge in closest proximity, with the most reliable data (i.e., gauges positioned along open
coastlines rather than deep within back bays or channels). We subtract predictions of astronomical tides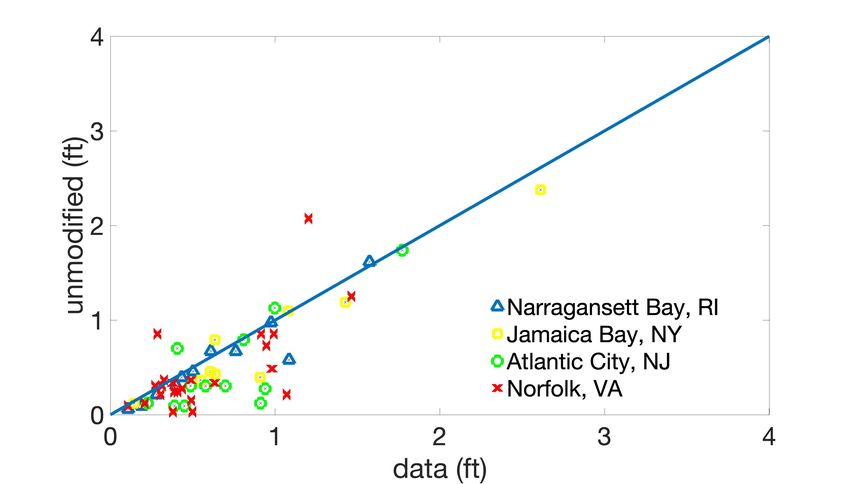
Atmosphere 2019, 10, 193                                                                                       7 of 21

from water elevations (storm tides) measured during hurricanes to estimate storm surges. The data
is measured relative to the North American Vertical Datum of 1988 (NAVD 88). We compare the
maximum storm surge values attained over the duration of the storm to those estimated by each
version of the SLOSH model. Note that we consequently neglect wind-driven waves, and the data
may thus overestimate storm surge levels. We also neglect nonlinear tide-surge interactions, perhaps
underestimating (or overestimating) surges that occur at high (or low) tide [7].
     While small storm surges can be hazardous, storm surges above 0.91 m (3.0 ft) pose a significant
threat to life and property. The NWS currently uses this value as a threshold for its newly implemented
storm surge warnings [45,46]. For this reason, we analyze the subset of surge events that reach 0.91 m
according to the computed storm surge residuals. In total, this occurs for 16 of the 55 simulations
(Table 1; the Norfolk, VA simulation of Hurricane Floyd produces a surge of slightly more than 0.91 m).
In other words, the hindcasts conducted in this study are for storms that mostly had low to moderate
impacts at the study sites. It is also deserving of note that for small storm surges, data is subject to
noise and measurement error. While this does not affect our assessment of the general impacts of the
modifications to the wind field, it has implications for our assessment of the SLOSH model accuracy.
Further investigation of additional data sources, e.g., Federal Emergency Management Agency (FEMA)
high-water marks and USGS temporary storm surge sensors, will be useful in better understanding
the results presented here.

3. Results

3.1. Baseline Case
     Previous studies have shown that the SLOSH model estimates storm surges within ±20% of
observed data at most locations [17,19]. The model was designed for operational use for a wide
range of storms in various locations, and thus undetermined model coefficients have not been used
to calibrate the model for specific storm events. Rather, the model has been developed to produce
sufficient results for all storms in all regions, and reasonable model results on average are preferable to
ideal results for a particular event [17]. Here, we modify the wind field with the goal of improving the
average accuracy of modeled maximum storm surges at the study sites. We establish a baseline by
simulating the maximum surges of the storms listed in Table 1 with the original, unmodified version
of the SLOSH model (Figure 2).

      Figure 2. Maximum storm surge heights simulated by the (unmodified) SLOSH model vs. maximum
      storm surge residuals computed from NOAA tide gauge data. [Note: Storm surge heights simulated at
      Narragansett Bay, RI, Jamaica Bay, NY, Atlantic City, NJ, or Norfolk, VA are labeled with a blue triangle,
      yellow square, green circle, or red cross respectively].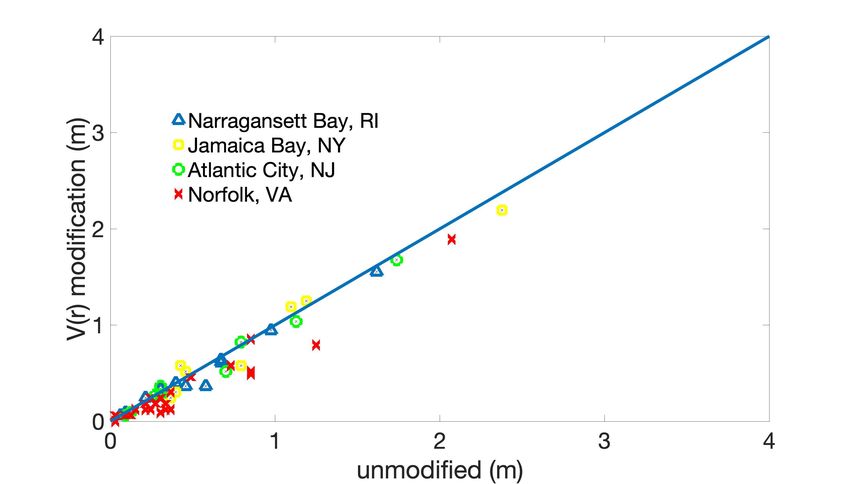
Atmosphere 2019, 10, 193                                                                          8 of 21

      The SLOSH model underestimates 44 of the 55 maximum storm surge heights. On average, the
underestimation has a magnitude of 0.23 m. The largest underestimation is 0.86 m (80.1%) for Hurricane
Ernesto in the Norfolk, VA simulation. This storm also impacts the Atlantic City area, and a similar
underestimation of 0.79 m (86.6%) is observed for this simulation. The SLOSH model overestimates
11 of the 55 maximum storm surge heights by an average of 0.20 m. The largest overestimation is 0.87 m
(72.3%) during the Norfolk, VA simulation of Hurricane Irene. Hurricane Irene impacts the three other
regions of the study, and this overestimation of the maximum storm surge is not observed for the other
simulations. Overall, the average error of the SLOSH model when computing the maximum storm
surge at each site for each relevant storm is −0.14 m (−22.2%). To be consistent with the literature, we
present the SLOSH model accuracy in terms of the average percent error of each simulation relative to
the respective NOAA tide gauge data; however, as noted in Section 2.5, for these simulations, most of
the maximum storm surges are less than 0.91 m (3.0 ft). Large percent errors may overstate absolute
errors. The mean absolute error of all the simulations is 0.22 m and the root mean square error is
0.31 m.
      For “large” storm surges, i.e., those greater than or equal to 0.91 m (3.0 ft), the SLOSH model
performs similarly. Of the 55 simulations, the storm surge residuals computed at the NOAA tide
gauges are large for 16 of them. Of these, 11 are underestimated by an average of 0.33 m. Five are
overestimated by an average of 0.21 m. Overall, the average error in the SLOSH model is −0.16 m
(−15.2%) for large storm surges. The mean absolute error is 0.30 m and the root mean square error is
0.41 m.

3.2. Surface Background Wind Modification
      The modification to the surface background wind field has varying effects on the simulated
maximum storm surge heights. There is a general tendency for the modification to cause the predicted
storm surges to increase, particularly for storm surges originally simulated as greater than 0.91 m
(3.0 ft). With this change, the maximum storm surges at the NOAA tide gauge locations increase for 24
(of the 55) simulations, decrease for 15 of the simulations, and do not change for 16 of the simulations
(Figure 3). The impacts are moderate, with an average increase of 0.09 m (17.7%) and an average
decrease of 0.04 m (20.9%) of the maximum storm surge height. For storms with observed maximum
storm surge levels greater than or equal to 0.91 m, the maximum storm surges increase for 12 of the
16 simulations and decrease for two. The mean increase is 0.12 m (9.4%) and the mean decrease is
0.05 m (8.0%).
      After the modification to the surface background wind field, on average the model underestimates
the maximum storm surges by 0.11 m (20.9%) when compared to the computed storm surge residuals.
This is a modest improvement from the average underestimation of 22.2% observed in the baseline
case. However, the mean absolute error and the root mean square error do not improve. They remain
0.22 m and 0.31 m, respectively. For storms with observed maximum storm surge levels greater than or
equal to 0.91 m, the model underestimates the maximum storm surges by an average of 0.08 m (9.7%).
The mean absolute error and the root mean square error also remain 0.30 m and 0.41 m, respectively.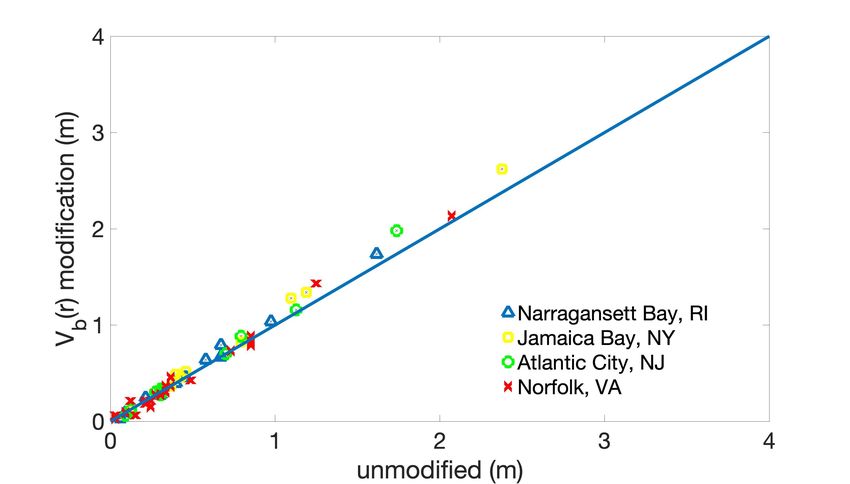
Atmosphere 2019, 10, 193                                                                                       9 of 21

                                                         (a)

                                                         (b)

      Figure 3. (a) Maximum storm surge heights computed with modification to surface background wind
      Vb (r ) vs. maximum storm surge heights simulated by the (unmodified) SLOSH model. (b) Maximum
      storm surge heights computed with modification to surface background wind Vb (r ) vs. maximum
      storm surge residuals computed from NOAA tide gauge data. [Note: Storm surge heights simulated at
      Narragansett Bay, RI, Jamaica Bay, NY, Atlantic City, NJ, or Norfolk, VA are labeled with a blue triangle,
      yellow square, green circle, or red cross respectively].

3.3. Parametric Wind Profile Modification
     Implementing the parametric wind profile (4) generally results in a decrease of the maximum
storm surge heights (Figure 4). With the change, 39 of the 55 maximum storm surges decrease compared
to ten that increase. This modification has larger impacts than the change to the background wind;
however, the impact is still relatively minor. The mean increase in maximum storm surge height is
0.06 m (23.1%) and the mean decrease is 0.12 m (29.2%). For storms with observed maximum storm
surge levels greater than or equal to 0.91 m (3.0 ft), the maximum storm surges increase for two of the
16 simulations and decrease for 12. The mean increase is 0.08 m (6.7%) and the mean decrease is 0.15 m
(15.7%).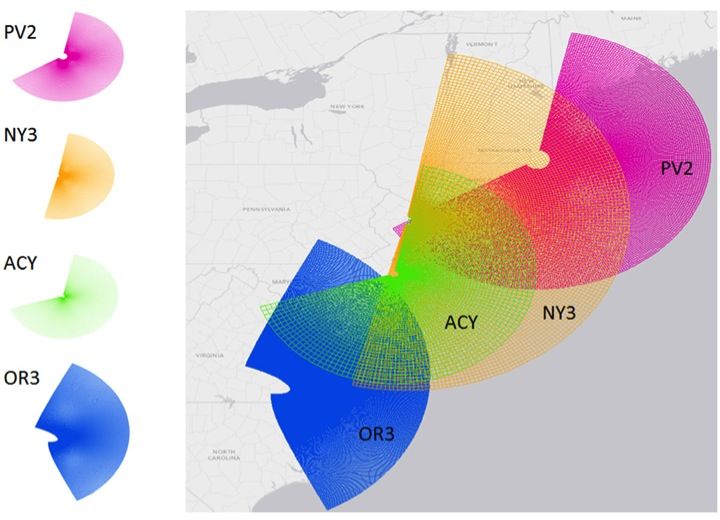
Atmosphere 2019, 10, 193                                                                                      10 of 21

                                                         (a)

                                                         (b)

      Figure 4. (a) Maximum storm surge heights computed with modification to parametric wind profile
      V (r ) vs. maximum storm surge heights simulated by the (unmodified) SLOSH model. (b) Maximum
      storm surge heights computed with modification to parametric wind profile V (r ) vs. maximum storm
      surge residuals computed from NOAA tide gauge data. [Note: Storm surge heights simulated at
      Narragansett Bay, RI, Jamaica Bay, NY, Atlantic City, NJ, or Norfolk, VA are labeled with a blue triangle,
      yellow square, green circle, or red cross respectively].

     After the modification to the parametric wind profile, on average the model underestimates the
maximum storm surges by 0.21 m (36.1%) when compared to the data. This is a degradation in the
performance of the original, unmodified model. The mean absolute error and the root mean square
error increase to 0.26 m and 0.34 m, respectively. For storms with observed maximum storm surge
levels greater than or equal to 0.91 m, the model underestimates the maximum storm surges by 0.27 m
(23.7%) on average. The mean absolute error and the root mean square error are 0.37 m and 0.47 m,
respectively.

3.4. Maximum Wind Speed Modification
     The magnitude of storm surge is most affected by the winds that occur near the eye of the storm,
and as a result changes to Vmax , which occurs within the eyewall, are expected to significantly impact
maximum storm surge heights. Our results confirm this (Figure 5). On average, the maximum storm
surge heights change in absolute value by 79.4%. This contrasts with the more modest changes of
13.3% and 24.9% that result from the modifications to the surface background wind and the parametric
wind profile, respectively. The tendency is for the maximum storm surge heights to increase; 33 of the
55 simulations result in higher maximum storm surges compared to 18 which decrease the maximum
storm surges. The changes are significant, with an average increase of 114.8% and an average decrease
of 32.1% of the original maximum storm surge height. For storms with observed maximum storm
Atmosphere 2019, 10, 193 11 of 21
surge levels greater than or equal to 0.91 m (3.0 ft), the maximum storm surges increase for nine of the
16 simulations and decrease for five. The mean increase is 0.58 m (48.6%) and the mean decrease is
0.32 m (33.4%).
After the modification to maximum wind speed, on average the model underestimates the
maximum storm surges by 0.03 m (3.8%) when compared to the data. This is a significant improvement
in percent error from the average underestimation of 22.2% in the baseline case. However, the mean
absolute error and the root mean square error again increase, here to 0.29 m and 0.43 m, respectively.
For storms with observed maximum storm surge levels greater than or equal to 0.91 m, the model
underestimates the maximum storm surges by an average of 0.07 m (1.2%). The mean absolute error
and the root mean square error increase to 0.49 m and 0.66 m, respectively.
(a)
(b)
Figure 5. (a) Maximum storm surge heights computed with modification to maximum wind speed
Vmax vs. maximum storm surge heights simulated by the (unmodified) SLOSH model. (b) Maximum
storm surge heights computed with modification to maximum wind speed Vmax vs. maximum storm
surge residuals computed from NOAA tide gauge data. [Note: Storm surge heights simulated at
Narragansett Bay, RI, Jamaica Bay, NY, Atlantic City, NJ, or Norfolk, VA are labeled with a blue triangle,
yellow square, green circle, or red cross respectively].
3.5. Combined Modifications
Finally, we implement each of the above changes jointly (Figure 6). Twenty-five of the maximum
storm surges increase by an average of 0.39 m (128.5%), and 26 of them decrease by an average of
0.22 m (46.7%). The changes have significant impacts. For storms with observed maximum storm
surge levels greater than or equal to 0.91 m (3.0 ft), the maximum storm surges increase for nine of the
16 simulations and decrease for seven. The mean increase is 0.60 m (48.0%) and the mean decrease is
0.33 m (38.6%).Atmosphere 2019, 10, 193 12 of 21
(a)
(b)
Figure 6. (a) Maximum storm surge heights computed with combined modifications vs. maximum
storm surge heights simulated by the (unmodified) SLOSH model. (b) Maximum storm surge heights
computed with combined modifications vs. maximum storm surge residuals computed from NOAA
tide gauge data. [Note: Storm surge heights simulated at Narragansett Bay, RI, Jamaica Bay, NY,
Atlantic City, NJ, or Norfolk, VA are labeled with a blue triangle, yellow square, green circle, or red
cross respectively].
Compared to the data, after all the modifications are implemented, on average the model
underestimates the maximum storm surges by 0.07 m (11.1%), reducing the error of the baseline
case by a factor of two. However, the mean absolute error and the root mean square error increase
compared with the baseline from 0.22 m and 0.31 m to 0.34 m and 0.46 m, respectively. For storms
with observed maximum storm surge levels greater than or equal to 0.91 m, the model underestimates
the maximum storm surges by an average of 0.03 m (4.6%), reducing the error of the baseline case.
The mean absolute error and the root mean square error increase to 0.56 m and 0.69 m, respectively.
A summary of these results is provided in Table 3.Atmosphere 2019, 10, 193 13 of 21
Table 3. Summary of errors produced by SLOSH model hindcasts.
Average (Percent) Mean Absolute Root Mean Square
Error (m) Error (m) Error (m)
Baseline Case
all surges −0.14 (−22.2%) 0.22 0.31
large surges −0.16 (−15.2%) 0.30 0.41
Surface Background
Wind Modification
all surges −0.11 (−20.9%) 0.22 0.31
large surges −0.08 (−9.7%) 0.30 0.41
Parametric Wind
Profile Modification
all surges −0.21 (−36.1%) 0.26 0.34
large surges −0.27 (−23.7%) 0.37 0.47
Maximum Wind
Speed Modification
all surges −0.03 (−3.8%) 0.29 0.43
large surges −0.07 (−1.2%) 0.49 0.66
Combined Modifications
all surges −0.07 (−11.1%) 0.34 0.46
large surges −0.03 (−4.6%) 0.56 0.69
3.6. Case Studies
Four major hurricanes impacted all four study sites, Hurricane Bob (1991), Hurricane Bertha
(1996), Hurricane Floyd (1999), and Hurricane Irene (2011). Each of these hurricanes had similar
tracks, approaching the Caribbean Islands from the southeast, and then traversing along the east coast.
Hurricane Bob is the only storm that did not make landfall in North Carolina, and thus it continued to
intensify in the vicinity of this region, while the other three storms weakened here. The performance
of the SLOSH model with and without modifications to the wind field varies; results are not consistent
across storms or locations.
Hurricane Bob was a category three storm that originated in the Caribbean, and reached its
maximum intensity east of North Carolina. It made landfall as a category two storm in Rhode Island.
Hindcasts using the original SLOSH model overestimate the maximum storm surge heights at all study
sites relative to the storm surge residuals computed from NOAA tide gauge data. The magnitude of the
overestimation relative to the storm surges increases southward. It is overestimated by 3%, 25%, 73%,
and 198%, for Narragansett Bay, Jamaica Bay, Atlantic City, and Norfolk, respectively. The combined
modifications to the wind field representation reduce the simulated maximum storm surges, and
improve the results at all sites except Narragansett Bay. The (signed) percent errors are reduced to
−10%, −18%, 20%, and 60% (i.e., the maximum storm surges are underestimated at Jamaica Bay and
Narragansett Bay).
Hurricane Bertha was a category three storm. It originated in the central Atlantic Ocean and
reached its maximum intensity early, north of the Dominican Republic, before making landfall in North
Carolina. It decreased to a tropical storm, and moved along the North Atlantic coastline. The SLOSH
model originally underestimates the maximum storm surge heights at all four of the study sites.
Maximum storm surge is underestimated by −8%, −25%, −47%, and −37% for Narragansett Bay,
Jamaica Bay, Atlantic City, and Norfolk, respectively. The modifications to the wind field representation
result in increases in the simulated maximum storm surges. The results are improved at Atlantic City
(37%) and Norfolk (5%) but made worse at Narragansett Bay (97%) and Jamaica Bay (96%).Atmosphere 2019, 10, 193 14 of 21
Hurricane Floyd was a very large, category four storm. It first made landfall in the U.S. in
North Carolina as a category two storm, re-entered the Atlantic Ocean, and made a second U.S.
landfall on Long Island before transitioning into an extratropical storm in Maine. The SLOSH model
underestimates the maximum storm surge heights at all locations except Jamaica Bay; however, errors
in the original SLOSH simulations are small. They are between −12% and 2% for the four sites.
The modifications to the wind field representation increase the maximum storm surge heights, but
degrade these results. All modified simulations overestimate the maximum storm surges by 32%, 30%,
9%, and 20% for Narragansett Bay, Jamaica Bay, Atlantic City, and Norfolk, respectively.
Hurricane Irene was a category three storm. It made landfall in the U.S. as a category one storm,
first in North Carolina, and then again in southeastern New Jersey. The original, unmodified version
of the SLOSH model accurately simulates the maximum storm surges of this storm at three of the sites,
with errors of 0.0%, −16.7%, 12.9% and 72.3% at Narragansett Bay, Jamaica Bay, Atlantic City, and
Norfolk, respectively. The modifications to the wind field representation increase the maximum storm
surge heights at all sites except Norfolk. Norfolk is also the only location where the modifications
to the wind field improve the magnitude of the relative error. With the changes, the errors in the
maximum storm surges become 3.2%, 21.8%, 40.4%, and −1.2% (Figures 7–10). The modifications
degrade the results at all other sites, overestimating the surge by an average of 0.25 m (21.8%).
To summarize, the SLOSH model overestimates the storm surge caused by Hurricane Bob at all
sites, and modifying the wind field decreases the storm surges, improving the estimates at all sites
except Narragansett Bay. For Hurricane Bertha, the SLOSH model underestimates the storm surge at
all sites, and the modifications increase the storm surges, improving the results at Atlantic City and
Norfolk. For Hurricane Floyd, the SLOSH model slightly underestimates the storm surges at three sites,
and the modifications to the wind field increase the storm surges too much and do not improve the
results. For Hurricane Irene, the SLOSH model overestimates the storm surges at two of the sites, and
the modifications only improve the results at Norfolk. In other words, results at Norfolk are improved
with the modifications for each storm except Hurricane Floyd, and the number of simulations that
are improved for each region decreases northward; the modifications do not improve the results at
Naragannsett Bay for any of the storms.
(a) (b)
Figure 7. Simulated maximum storm surge heights near Narragansett Bay, RI during Hurricane Irene
(2011) (a) before and (b) after modifications to the wind field representation using SLOSH basin pv2.Atmosphere 2019, 10, 193 15 of 21
(a) (b)
Figure 8. Simulated maximum storm surge heights near Jamaica Bay, NY during Hurricane Irene (2011)
(a) before and (b) after modifications to the wind field representation using SLOSH basin ny3.
(a) (b)
Figure 9. Simulated maximum storm surge heights near Atlantic City, NJ during Hurricane Irene (2011)
(a) before and (b) after modifications to the wind field representation using SLOSH basin acy.Atmosphere 2019, 10, 193 16 of 21
(a) (b)
Figure 10. Simulated maximum storm surge heights near Norfolk, VA during Hurricane Irene (2011)
(a) before and (b) after modifications to the wind field representation using SLOSH basin or3.
4. Discussion
Relative to storm surge residuals computed from tide gauge data, the SLOSH model baseline
simulations produce estimates of maximum storm surge heights with accuracy comparable to that
commonly reported in the literature. At the tide gauge locations, the average error of all simulations is
less than 0.15 m in absolute value, and the average relative error is −22.2%. The simulations reveal
bias in the SLOSH model at the study sites. The model underestimates 80% of the maximum storm
surges simulated, although less (relative) bias is observed for large storm surges. As expected, the
wind field representation significantly impacts the maximum storm surge heights simulated by the
SLOSH model, though the specific impacts observed are not obvious a priori.
The modification to the surface background wind increases nearly one half of the maximum
storm surge heights. In the original, unmodified SLOSH model, the magnitude of the radially variable
factor used in the background wind (1) has a maximum value of 0.5 at Rmax , and decreases toward
the core and outer radius of the storm. Increasing the factor to a constant value of 0.55 predictably
increases most storm surge heights. We expect this modification to improve the underestimation of the
maximum storm surges seen in the baseline case, and while the average error does slightly decrease,
the mean absolute error and the root mean square error are essentially unchanged. This modification
does not have a significant impact on the average error of the SLOSH model, perhaps due to the
relatively slow translational speed of tropical cyclones.
The modification to the parametric wind profile generally decreases the simulated maximum
storm surge heights, which does not improve the underestimation of the maximum storm surgesAtmosphere 2019, 10, 193 17 of 21
seen in the baseline case. In [36], it is discussed that the modified profile significantly underestimates
the outer radius of the storm. The winds near the core of the storm most significantly impact the
generation of maximum storm surges; however, this result indicates that the winds at larger radii play
a significant role as well. This can be explored through additional study of wind profiles (e.g., [36])
that better approximate the outer regions of the storm. Also, hurricanes often undergo an extratropical
transition as they move through the higher latitudes of the study region. When this occurs, the
hurricane structure evolves and the wind profiles explored here, which were intended to represent
traditional hurricane structures, may fail to accurately represent the structure of a given storm. Further
study of wind profiles of transitioning tropical cyclones is needed.
The direct implementation of Vmax has the greatest influence on the maximum storm surge heights.
In general, it increases these values, indicating that the iterative procedure in the unmodified version
of the SLOSH model used to estimate Vmax causes an underestimation of the storm surge. With the
modification, the average error in the storm surge significantly decreases. However, the mean absolute
error and the root mean square error are made worse. In other words, the bias is improved, but at
the expense of larger variance in the estimates of maximum storm surges. The iterative procedure in
the original, unmodified version of the SLOSH model was implemented to reduce model sensitivity
to errors in Vmax . Implementing Vmax directly increases sensitivity to this value, and as a result the
variance in Vmax is reflected in the variance of the maximum storm surge heights. The uncertainty in
estimates of maximum storm surge heights computed by the SLOSH model is increased.
The three modifications interact nonlinearly, with the effect of the direct implementation of Vmax
dominating. When each of the changes is implemented jointly, the bias is reduced, though not to the
low values seen with the Vmax modification alone. The mean absolute error and the root mean square
error increase to values larger than any of those obtained from any of the modifications in isolation.
The four storms that impacted all the sites allow a more careful assessment of the impact of
the combined modifications across several regions, across several storms. In general, the original,
unmodified SLOSH model accurately estimates the maximum storm surges at Narragansett Bay.
These results are difficult to improve, and the wind field modifications prove to be detrimental. On the
other hand, the maximum storm surges simulated using the original model have considerable error
at Norfolk, and the modifications do improve the results. This suggests that for major storms, the
incorporated physics and data may play less of a role at higher latitudes.
Additionally, the original model generally overestimates storm surges produced by Hurricane
Bob and Hurricane Irene, and underestimates those of Hurricane Bertha and Hurricane Floyd. For this
subset of major hurricanes, there is no consistent trend in the errors. After the incorporation of the
wind field modifications, the storm surges are generally adjusted in the correct direction; however,
sometimes they are adjusted too much. The modifications improve the simulated storm surges from
Hurricane Bob, which did not make landfall and maintained its structure as it approached the U.S.
North Atlantic coast. The modifications did not improve the simulated storm surges of Hurricane
Floyd, which was very large and asymmetric. The incorporated physics and data used in the wind
field modifications may better represent smaller storms that do not make landfall; however, further
study is needed to understand the broader implications of these four cases.
It should be noted that in this work, we specifically focus on coastal regions in the Northeastern
United States. Further study is needed to investigate the applicability of the results to broader regions.
5. Conclusions
The surface wind stress is one of the most important components of hurricane storm surge
modeling, and there are many methods of representing the surface wind field used in its approximation.
In this study, we have assessed the impact of a wind field representation developed based on empirical,
physical, and observational data on SLOSH model performance at four vulnerable locations in the
Northeastern United States. Specifically, we have implemented an empirically derived representation
of the background wind field, a physically based parametric wind profile, and the direct use ofAtmosphere 2019, 10, 193 18 of 21
observed maximum wind speeds. We have assessed the impacts of these changes individually and
collectively on the simulation of maximum storm surge heights for a broad range of historical storms
that impacted the study region.
The original, unmodified SLOSH model sufficiently estimates maximum storm surges at the
study sites. However, there is a potential model bias that frequently produces underestimation. While
overestimation of storm surge can have detrimental social consequences such as distrust of scientific
experts and authorities [47], underestimation of storm surge can be deadly, especially for regions in
low-lying, coastal terrain, such as those included in this study. For both real-time forecasting and
long-term planning and risk assessment, it is desirable to eliminate this model bias. Here we find that
the wind field representation can play a significant role in this effort.
Modifying the background wind field representation generally increases maximum storm surge
heights and is thus beneficial, although the change to simulated maximum storm surge heights
is not dramatic. The impact of the parametric wind profile is also relatively minor; however
the modification generally decreases maximum storm surge heights, which does not improve the
systematic underestimation. Further investigation and development of wind profiles that better
represent the storm’s outer region (e.g., [36]), particularly as storms undergo extratropical transition,
are needed. Finally, the implementation of observed maximum wind speeds generally increases
simulated maximum storm surge heights and significantly improves model accuracy; however, it also
increases model uncertainty. The variance in the estimates of maximum storm surge heights increases
with the change. The combination of modifications reveals that the changes interact nonlinearly, and
the resulting model accuracy decreases compared to when the observed maximum wind speeds are
implemented alone. Based on these results, the recommendation is the direct use of observed values of
Vmax , particularly when measurement errors and uncertainty in this value are small.
In practice, the SLOSH model is used to produce both deterministic and probabilistic storm
surge forecasts. When a hurricane threatens the U.S. coastline, SLOSH model simulations are used to
provide guidance to NHC forecasters, emergency managers, and other government officials through
various products. The MEOW products are precomputed and provide a worst-case storm surge
scenario when uncertainty lies in the position and landfall location of a storm. The MOM products
are precomputed and provide a worst-case storm surge scenario if only the storm intensity is known.
The P-surge products are real-time, probabilistic forecasts, developed by permuting uncertain storm
parameters forecasted by the NHC (i.e., storm position, size, intensity, and forward speed) based
on historical errors. The SLOSH model is also used to develop probabilistic information to guide
design criteria [19,22,25]. Here, we have shown how the wind field representation can be improved to
reduce errors in SLOSH simulations. This error reduction may be applied to the various SLOSH-based
products to improve real-time forecasts as well as long-term risk analyses of storm surge.
Author Contributions: Conceptualization, T.M. and N.L.; Formal analysis, T.M. and N.L.; Funding acquisition,
N.L.; Investigation, T.M. and N.L.; Methodology, T.M. and N.L.; Project administration, N.L.; Writing—original
draft, T.M. and N.L.; Writing—review & editing, T.M. and N.L.
Funding: Support for this work was provided for T.M. and N.L. by the Rockefeller Foundation and the National
Science Foundation under Award EAR-1520683. Additional support was provided for T.M. by an Early Career
Research Fellowship from the Gulf Research Program of the National Academies of Sciences, Engineering, and
Medicine. The content is solely the responsibility of the authors and does not necessarily represent the official
views of the Gulf Research Program of the National Academies of Sciences, Engineering, and Medicine.
Acknowledgments: The authors thank Brian Zachry of Berkshire Hathaway Specialty Insurance for his technical
assistance with the SLOSH model. They also thank the members of the Structures of Coastal Resilience project
(http://www.structuresofcoastalresilience.org).
Conflicts of Interest: The authors declare no conflict of interest. The funders had no role in the design of the
study; in the collection, analyses, or interpretation of data; in the writing of the manuscript, or in the decision to
publish the results.Atmosphere 2019, 10, 193 19 of 21
Abbreviations
The following abbreviations are used in this manuscript:
SLOSH Sea, Lake, and Overland Surges from Hurricanes
NHC National Hurricane Center
NWS National Weather Service
USGS United States Geological Survey
NOAA National Oceanic and Atmospheric Administration
MEOW Maximum Envelope of Water
MOM Maximum of MEOWs
Vb background wind speed of the atmosphere
V axisymmetric wind speed
Vs translational speed
Vmax maximum wind speed
Rmax radius of maximum wind speed
HURDAT HURricane DATabases
NAVD 88 North American Vertical Datum of 1988
FEMA Federal Emergency Management Agency
References
1. Rappaport, E.N. Fatalities in the United States from Atlantic tropical cyclones: New data and interpretation.
Bull. Am. Meteorol. Soc. 2014, 95, 341–346. [CrossRef]
2. Storm Surge Overview. Available online: https://www.nhc.noaa.gov/surge/ (accessed on 12 March 2019).
3. Hoffman, R.N.; Dailey, P.; Hopsch, S.; Ponte, R.M.; Quinn, K.; Hill, E.M.; Zachry, B. An estimate of increases
in storm surge risk to property from sea level rise in the first half of the twenty-first century. Weather. Clim.
Soc. 2010, 2, 271–293. [CrossRef]
4. Pielke, R.A., Jr.; Gratz, J.; Landsea, C.W.; Collins, D.; Saunders, M.A.; Musulin, R. Normalized hurricane
damage in the United States: 1900–2005. Nat. Hazards Rev. 2008, 9, 29–42. [CrossRef]
5. Irish, J.L.; Resio, D.T. A hydrodynamics-based surge scale for hurricanes. Ocean Eng. 2010, 37, 69–81.
[CrossRef]
6. Mayo, T.; Butler, T.; Dawson, C.; Hoteit, I. Data assimilation within the Advanced Circulation (ADCIRC)
modeling framework for the estimation of Manning’s friction coefficient. Ocean Model. 2014, 76, 43–58.
[CrossRef]
7. Rego, J.L.; Li, C. Nonlinear terms in storm surge predictions: Effect of tide and shelf geometry with case
study from Hurricane Rita. J. Geophys. Res. 2010, 115, 6020. [CrossRef]
8. Resio, D.T.; Irish, J.; Cialone, M. A surge response function approach to coastal hazard assessment—Part 1:
Basic concepts. Nat. Hazards 2009, 51, 163–182. [CrossRef]
9. Zhang, K.; Liu, H.; Li, Y.; Xu, H.; Shen, J.; Rhome, J.; Smith, T.J., III. The role of mangroves in attenuating
storm surges. Estuar. Coast. Shelf Sci. 2012, 102, 11–23. [CrossRef]
10. Dietrich, J.; Bunya, S.; Westerink, J.; Ebersole, B.; Smith, J.; Atkinson, J.; Jensen, R.; Resio, D.; Luettich, R.;
Dawson, C.; et al. A high-resolution coupled riverine flow, tide, wind, wind wave, and storm surge model
for southern Louisiana and Mississippi. Part II: Synoptic description and analysis of Hurricanes Katrina and
Rita. Mon. Weather Rev. 2010, 138, 378–404. [CrossRef]
11. Forbes, C.; Rhome, J.; Mattocks, C.; Taylor, A. Predicting the storm surge threat of Hurricane Sandy with the
National Weather Service SLOSH model. J. Mar. Sci. Eng. 2014, 2, 437–476. [CrossRef]
12. Mandli, K.T.; Dawson, C.N. Adaptive mesh refinement for storm surge. Ocean Model. 2014, 75, 36–50.
[CrossRef]
13. Akbar, M.K.; Kanjanda, S.; Musinguzi, A. Effect of Bottom Friction, Wind Drag Coefficient, and
Meteorological Forcing in Hindcast of Hurricane Rita Storm Surge Using SWAN+ ADCIRC Model. J. Mar.
Sci. Eng. 2017, 5, 38. [CrossRef]
14. Butler, T.; Altaf, M.U.; Dawson, C.; Hoteit, I.; Luo, X.; Mayo, T. Data assimilation within the Advanced
Circulation (ADCIRC) modeling framework for hurricane storm surge forecasting. Mon. Weather Rev. 2012,
140, 2215–2231. [CrossRef]Atmosphere 2019, 10, 193 20 of 21
15. Kennedy, A.B.; Gravois, U.; Zachry, B.C.; Westerink, J.J.; Hope, M.E.; Dietrich, J.C.; Powell, M.D.; Cox, A.T.;
Luettich, R.A.; Dean, R.G. Origin of the Hurricane Ike forerunner surge. Geophys. Res. Lett. 2011, 38.
[CrossRef]
16. Ramos Valle, A.N.; Curchitser, E.N.; Bruyere, C.L.; Fossell, K.R. Simulating Storm Surge Impacts with a
Coupled Atmosphere-Inundation Model with Varying Meteorological Forcing. J. Mar. Sci. Eng. 2018, 6, 35.
[CrossRef]
17. Jelesnianski, C.P.; Chen, J.; Shaffer, W.A. SLOSH: Sea, Lake, and Overland Surges From Hurricanes; US
Department of Commerce, National Oceanic and Atmospheric Administration, National Weather Service:
Silver Spring, MD, USA, 1992.
18. Taylor, A.A.; Glahn, B. Probabilistic guidance for hurricane storm surge. In Proceedings of the 19th
Conference on Probability and Statistics, New Orleans, LA, USA, 20–24 January 2008; Volume 74.
19. Glahn, B.; Taylor, A.; Kurkowski, N.; Shaffer, W.A. The role of the SLOSH model in National Weather Service
storm surge forecasting. Natl. Weather Dig. 2009, 33, 3–14.
20. Lin, N.; Emanuel, K.; Smith, J.; Vanmarcke, E. Risk assessment of hurricane storm surge for New York City.
J. Geophys. Res. 2010, 115, D18121. [CrossRef]
21. Lin, N.; Emanuel, K.; Oppenheimer, M.; Vanmarcke, E. Physically based assessment of hurricane surge
threat under climate change. Nat. Clim. Chang. 2012, 2, 462–467. [CrossRef]
22. Mayo, T.; Lin, N. Hurricane Storm Surge Risk Analysis for Structures of Coastal Resilience. 2019,
in preparation.
23. Cyriac, R.; Dietrich, J.; Fleming, J.; Blanton, B.; Kaiser, C.; Dawson, C.; Luettich, R. Variability in Coastal
Flooding predictions due to forecast errors during Hurricane Arthur. Coast. Eng. 2018, 137, 59–78. [CrossRef]
24. Dietrich, J.C.; Muhammad, A.; Curcic, M.; Fathi, A.; Dawson, C.; Chen, S.; Luettich, R., Jr. Sensitivity of
Storm Surge Predictions to Atmospheric Forcing during Hurricane Isaac. J. Waterw. Port Coast. Ocean Eng.
2017, 144, 04017035. [CrossRef]
25. Nordenson, C.S.; Nordenson, G.; Chapman, J. Structures of Coastal Resilience; Island Press: Washington, DC,
USA, 2018.
26. Lin, N.; Chavas, D. On hurricane parametric wind and applications in storm surge modeling. J. Geophys.
Res. Atmos. 2012, 117. [CrossRef]
27. Emanuel, K.; Rotunno, R. Self-stratification of tropical cyclone outflow. Part I: Implications for storm
structure. J. Atmos. Sci. 2011, 68, 2236–2249. [CrossRef]
28. Chan, J.C. The physics of tropical cyclone motion. Annu. Rev. Fluid Mech. 2005, 37, 99–128. [CrossRef]
29. Emanuel, K.; Ravela, S.; Vivant, E.; Risi, C. A statistical deterministic approach to hurricane risk assessment.
Bull. Am. Meteorol. Soc. 2006, 87, 299–314. [CrossRef]
30. Mattocks, C.; Forbes, C. A real-time, event-triggered storm surge forecasting system for the state of North
Carolina. Ocean Model. 2008, 25, 95–119. [CrossRef]
31. Phadke, A.C.; Martino, C.D.; Cheung, K.F.; Houston, S.H. Modeling of tropical cyclone winds and waves for
emergency management. Ocean Eng. 2003, 30, 553–578. [CrossRef]
32. Powell, M.; Soukup, G.; Cocke, S.; Gulati, S.; Morisseau-Leroy, N.; Hamid, S.; Dorst, N.; Axe, L. State of
Florida hurricane loss projection model: Atmospheric science component. J. Wind Eng. Ind. Aerodyn. 2005,
93, 651–674. [CrossRef]
33. Vickery, P.J.; Wadhera, D.; Powell, M.D.; Chen, Y. A hurricane boundary layer and wind field model for use
in engineering applications. J. Appl. Meteorol. Climatol. 2009, 48, 381–405. [CrossRef]
34. Holland, G.J. An analytic model of the wind and pressure profiles in hurricanes. Mon. Weather Rev. 1980,
108, 1212–1218. [CrossRef]
35. Willoughby, H.; Rahn, M. Parametric representation of the primary hurricane vortex. Part I: Observations
and evaluation of the Holland (1980) model. Mon. Weather Rev. 2004, 132, 3033–3048. [CrossRef]
36. Chavas, D.R.; Lin, N.; Emanuel, K. A model for the complete radial structure of the tropical cyclone wind
field. Part I: Comparison with observed structure. J. Atmos. Sci. 2015, 72, 3647–3662. [CrossRef]
37. Emanuel, K. Tropical cyclone energetics and structure. In Atmospheric Turbulence and Mesoscale Meteorology;
Cambridge University Press: Cambridge, UK, 2004; pp. 165–191.
38. Jelesnianski, C.P.; Taylor, A. A Preliminary View of Storm Surges before and after Storm Modifications;
Environmental Research Laboratories, Weather Modification Program Office: Silver Spring, MD, USA, 1973;
Volume 3.You can also read