Canada Ocean Energy Atlas (Phase 1) Potential Tidal Current Energy Resources Analysis Background
←
→
Page content transcription
If your browser does not render page correctly, please read the page content below
Canada Ocean Energy Atlas (Phase 1)

Potential Tidal Current Energy Resources

            Analysis Background
                       May 2006

                     Prepared For:
Canadian Hydraulics Centre, Ottawa, Ontario as part of a
        contract for Natural Resources Canada

                     Prepared By:
           Michael Tarbotton and Max Larson
               Triton Consultants Ltd.
                    Vancouver, BC

                        TRITON CONSULTANTS LTD.
Canada Ocean Energy Atlas
     Triton                                                       Tidal Current Energy Resources

                                         TABLE OF CONTENTS

          1.      INTRODUCTION                                                                   1

          2.      DATA SOURCES                                                                   2
          2.1     Nautical and Bathymetric Information                                           2
          2.2     Tidal Constituent Database                                                     3
          2.3     Tidal Modelling                                                                4

          3.      ANALYSIS METHODOLOGY                                                           9
          3.1     Tides and Tidal Currents in Canada                                             9
          3.2     Theoretical Basis                                                             10
          3.3     Practical Methodology                                                         13

          4.      SELECTED STUDY RESULTS                                                        15
          4.1     Potential Tidal Current Energy Summary Tables                                 15
          4.2     Tidal Resource Maps                                                           21
          4.3     Potential Tidal Current Energy Density Maps                                   26

          5.      SUMMARY AND RECOMMENDATIONS FOR FURTHER STUDIES                               30
          5.1     Summary                                                                       30
          5.2     Recommendations for Future Studies                                            30
          5.2.1     Modelling                                                                   30
          5.2.2     Mapping                                                                     30

          6.      REFERENCES                                                                    31

          Appendix A – CEAPack Description
          Appendix B - Hydrodynamic Model Tide2D

Canadian Hydraulic Centre                                i                  Triton Consultants Ltd.
Natural Resources Canada                                                                May 2006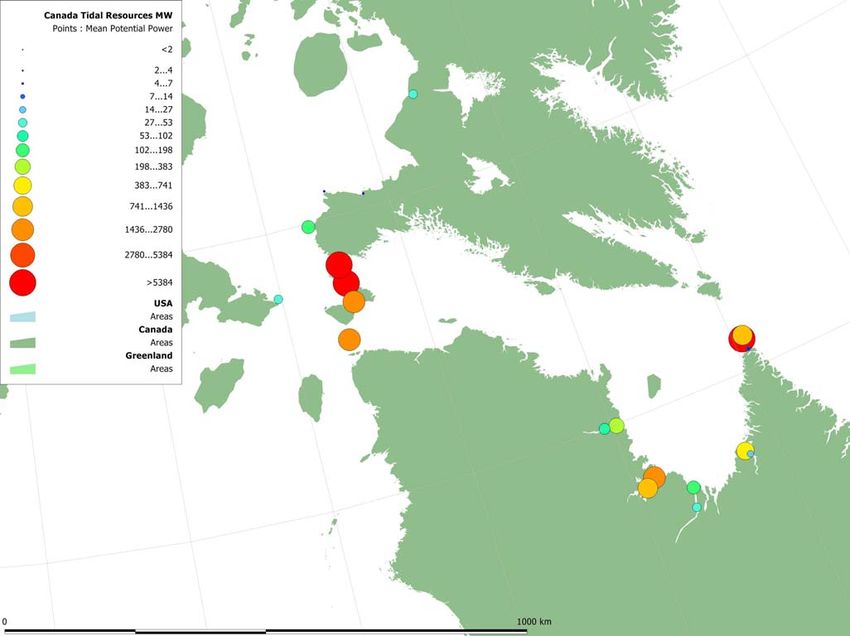
Canada Ocean Energy Atlas
     Triton                                                                                Tidal Current Energy Resources

                                                         LIST OF FIGURES
          Figure 1: Tidal Stations in Canada..........................................................................................4
          Figure 2: Hudson Bay Tidal Model Region (depths in metres) ...............................................6
          Figure 3: Gulf of St. Lawrence Tidal Model Region (depths in metres) ..................................6
          Figure 4: Bay of Fundy North Tidal Model Region (depths in metres) ....................................7
          Figure 5: British Columbia Coast South Tidal Model Region (depths in metres) ....................7
          Figure 6: Queen Charlotte Islands Tidal Model Region (depths in metres) ............................8
          Figure 7: Definition Sketch ....................................................................................................11
          Figure 8: Sensitivity of Power to Current Speed ...................................................................12
          Figure 9: Canada Potential Tidal Current Resource Sites ....................................................22
          Figure 10: Potential Tidal Current Resource Sites - Pacific Coast........................................23
          Figure 11: Potential Tidal Current Resource Sites - Hudson's Strait and Ungava Bay.........24
          Figure 12: Potential Tidal Current Resource Sites - Atlantic Coast ......................................25
          Figure 13: Power Density - Pacific Coast..............................................................................26
          Figure 14: Power Density - Hudson's Strait ..........................................................................27
          Figure 15: Power Density - Atlantic Coast ............................................................................28
          Figure 16: Power Density - Bay of Fundy North....................................................................29

Canadian Hydraulic Centre                                              ii                                   Triton Consultants Ltd.
Natural Resources Canada                                                                                                May 2006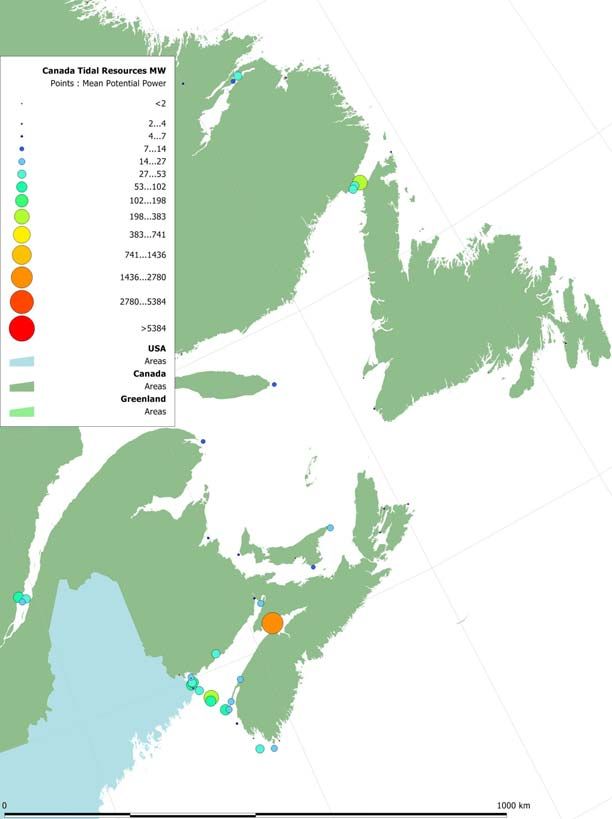
Canada Ocean Energy Atlas
     Triton                                                                                    Tidal Current Energy Resources

                                                            LIST OF TABLES
          Table 1: Canadian Sailing Directions ......................................................................................3
          Table 2: Canadian Tide and Current Tables ...........................................................................3
          Table 3: Tidal Models..............................................................................................................5
          Table 4: Data Assembly ........................................................................................................14
          Table 5: Canada Potential Tidal Current Energy by Province...............................................15
          Table 6: Canada Potential Tidal Current Energy by Region .................................................15
          Table 7: Canada Tidal Current Power Sites (50 largest sites) ..............................................16
          Table 8: Canada Potential Tidal Current Power Sites (50 sites ranked by power density
              kW/m2) ...........................................................................................................................19

Canadian Hydraulic Centre                                                 iii                                   Triton Consultants Ltd.
Natural Resources Canada                                                                                                    May 2006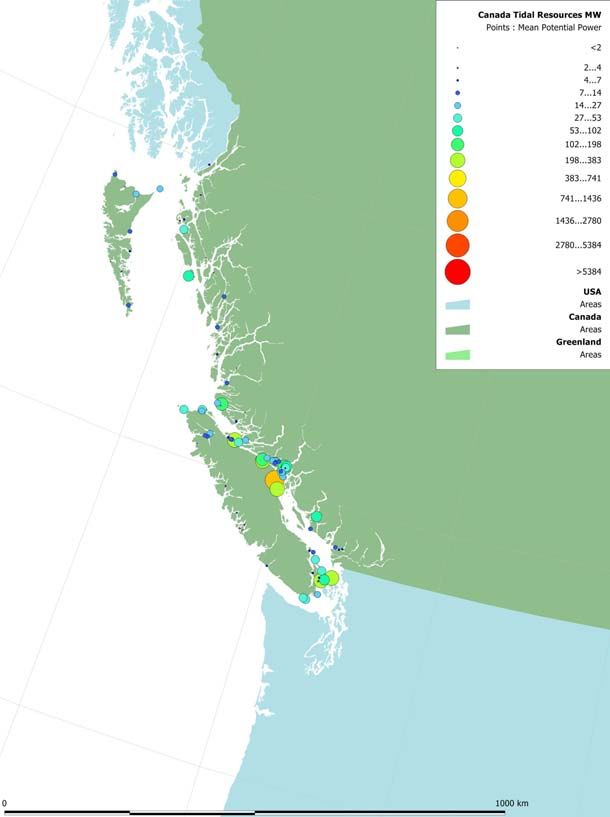
Canada Ocean Energy Atlas
     Triton                                                           Tidal Current Energy Resources

   1.     INTRODUCTION
          This report provides an analysis background to a preliminary tidal current resource inventory
          for Canadian waters completed for Phase 1 of the Canada Ocean Energy Atlas Project.
          The estimated tidal current energy for Canada is the total potential resource available in tidal
          flows. The estimates are “potential” resources NOT “economically realisable” resources. At
          this early stage of the Ocean Atlas development, energy calculations are based on
          preliminary estimates of existing tidal flows and no consideration has been given to the
          following factors:
              •   Environmental Impacts
              •   Technological developments and limitations in tidal power extraction
              •   Climate related factors (e.g., ice, global climate change)
              •   Site location versus power grid accessibility and power demand
              •   Hydrogen economy developments
              •   The effect of potential energy extraction schemes on existing flow conditions
              •   Economic factors.
          Mean vs Rated Site and Turbine Capacity
          There may be some potential for confusion when comparing the power values referenced in
          this study with those of conventional thermal or hydroelectric generating facilities with which
          the public is most familiar. With conventional power generation, reference is usually made to
          the rated power of the facility which is the value stamped on the manufacturer’s nameplate.
          It is generally the goal of conventional facility owners to operate the facility near this rated
          capacity. Moreover, the day-to-day variability of conventional energy resources is relatively
          minor which allows these facilities to operate near their rated capacity for relatively
          continuous periods of time. This means that rated capacity is generally a good first
          approximation to the actual power production of a conventional power plant.
          For wind power it is often the case that wind farm capacities are quoted in turbine rated
          capacity rather than the more realistic mean annual power potential. Wind power is much
          more temporally variable and uncertain than tidal power, but both these sources of
          renewable energy peak for quite short periods.
          In the case of tidal current energy extraction, the resource potential goes to zero two to four
          times per day and reaches its peak annual value for only a few hours per year. For this
          reason, it is much more instructive to speak of mean power in the context of tidal power as
          such a definition integrates the effect of the highly variable daily and annual variation of the
          resource. The Mean Potential Power detailed in this report can be converted to
          megaWatt.hours per year by multiplying the mean power (MW) by 8,760 (the number of
          hours in a year).

Canadian Hydraulic Centre                              1                          Triton Consultants Ltd.
Natural Resources Canada                                                                      May 2006
Canada Ocean Energy Atlas
     Triton                                                        Tidal Current Energy Resources

   2.     DATA SOURCES
          Triton has undertaken a preliminary tidal resource inventory for Canadian marine waters
          including the East and West Coasts and Arctic Canada. This inventory was based on a
          variety of data sources including:
          •   Canadian Sailing Directions;
          •   Nautical Charts and Tide Books;
          •   Tide and tidal current constituent data;
          •   Numerical Tidal modelling data
          Data from these data sources has been assembled into a database and documented in
          spreadsheet tables and in the GIS program Manifold (www.manifold.net) for data viewing
          and interpretation by the study team.

   2.1    NAUTICAL AND BATHYMETRIC INFORMATION
          Nautical data including Canadian Sailing Directions and tide books were purchased for the
          whole of Canada and reviewed in detail. In addition, all the available electronic nautical
          charts, a total of 489 charts, were purchased from Nautical Data International (NDI), St.
          John’s, Newfoundland in raster format and areas of potential tidal current resource were
          identified.
          The Canadian Hydrographic Service has a total of 950 nautical charts for all regions of
          Canada. Deducting approximately 250 charts for the Great Lakes, St. Lawrence River and
          Mackenzie River systems and interior British Columbia, there are about 700 charts relevant
          to this study. Therefore, 70% of Canadian (saltwater) Marine Charts are presently available
          in electronic raster format. A majority of the non-electronic charts are for areas such as
          Hudson Bay and Strait, Ungava Bay and the Arctic Regions.
          Paper copies of the non-electronic charts were reviewed from Triton’s own chart database
          and at the map library at the University of British Columbia.
          Table 1 and Table 2 below show the Canadian Sailing Directions and Tide and Current
          books used for this study.

Canadian Hydraulic Centre                                2                    Triton Consultants Ltd.
Natural Resources Canada                                                                  May 2006
Canada Ocean Energy Atlas
Triton Tidal Current Energy Resources
Table 1: Canadian Sailing Directions
Number Description
P100 Arctic Canada, Vol. 1, 1994
P102 Arctic Canada, Vol. 2, 1985
P104 Arctic Canada, Vol. 3, 1994
P112 Labrador & Hudson Bay, 1988
P118 BC (S. Portion), Vol. 1, 2004
P120 Great Slave Lake & Mackenzie River, 1989
P122 Gulf of St. Lawrence, 1992
ATL100E Atlantic Coast, General Information 1992
ATL101E Newfoundland, Northeast & East Coasts
ATL102E Newfoundland, East and South Coasts
ATL103E Newfoundland, Southwest Coast
ATL104E Cape North to Cape Canso
ATL105E Cape Canso to Cape Sable
ATL106E Gulf of Maine and Bay of Fundy, 2001
ATL107E St. John River, 1994
ATL110E St. Lawrence River, Cap Whittle/
ATL111E St. Lawrence River/Île Verte to Québec, 1999
ATL112E St. Lawrence River/Cap-Rouge to Montréal
ATL120E Labrador, Camp Islands to Hamilton Inlet
ATL121E Labrador, Hamilton Inlet to Cape Chidley
Volume 1 Pacific British Columbia South 1987
Volume 11 Pacific British Columbia North 1987
Table 2: Canadian Tide and Current Tables
Volume Description
Vol 1 Atlantic Coast and Bay of Fundy / Côte de l'Atlantique et baie de Fundy, 2006
Vol 2 Gulf of St. Lawrence / Golfe du Saint-Laurent, 2006
Vol 3 St. Lawrence and Saguenay Rivers / Fleuve Saint-Laurent et rivière
Saguenay, 2006
Vol 4 Arctic and Hudson Bay / L'Arctique et la baie d'Hudson, 2006
Vol 5 Juan de Fuca Strait & Strait of Georgia / Détroits de Juan de Fuca et de
Georgia, 2006
Vol 6 Discovery Passage & West Coast of Vancouver Island / Discovery Passage et
côte Ouest de l’île de Vancouver, 2006
Vol 7 Queen Charlotte Sound to Dixon Entrance / Queen Charlotte Sound à Dixon
Entrance, 2006
2.2 TIDAL CONSTITUENT DATABASE
The Canadian Hydrographic Service maintains a database of more than 1030 tidal station
constituent files. These tidal (height) constituent files are based on recorded water levels
and are used to calculate the tidal heights each year for the CHS Tide and Currents Tables.
Because of the practical difficulties of measuring tidal currents, the number of verified tidal
current stations available for Canada is quite small (probably less than 50). The Pacific
Coast is by far the best serviced area in the country, with a total of 24 stations with current
constituents. On the Atlantic Coast there are only two current sites in the Tide and Current
tables and these sites are in low current areas of the Bay of Fundy.
Canadian Hydraulic Centre 3 Triton Consultants Ltd.
Natural Resources Canada May 2006Canada Ocean Energy Atlas
Triton Tidal Current Energy Resources
It is understood from scientists at the Bedford Institute of Oceanography that many current
measurements have been recorded in the Atlantic Region but these have never been
assembled into a verified database. CHS headquarters in Ottawa is presently in discussions
with their regional offices to agree to a framework for assembling all the current
measurement data for Canada.
Figure 1 shows the location of tidal height stations in Canada. The colour of the “dots”
indicates the amplitude of the semi-diurnal (twice a day) M2 tidal constituent which gives a
good indication of relative tidal range except in places like Juan de Fuca Strait and the Strait
of Georgia (Pacific Coast) where the diurnal (once a day) component is also important.
A general overview of the physics of tides and tidal constituents is given in Section 3.1 for
reference.
Figure 1: Tidal Stations in Canada
2.3 TIDAL MODELLING
Data from numerical tidal models of Canadian Waters was used to provide additional
information for the tidal current power assessment. The finite element models used by Triton
for this study are shown in Table 3.
Canadian Hydraulic Centre 4 Triton Consultants Ltd.
Natural Resources Canada May 2006Canada Ocean Energy Atlas
Triton Tidal Current Energy Resources
Table 3: Tidal Models
Number of
Model Grid Model
Model Region Notes
Source Calculation
Nodes
British Columbia South Triton & IOS* 132,000 Model run for this study
Queen Charlotte Islands Triton & IOS* 7,600 Model run for this study
Hudson's Bay Region Triton & BIO* 45,000 Model run for this study
Gulf of St. Lawrence Triton & PWGSC* 7,800 Model run for this study
North West Atlantic BIO/WebTide 17,100 Model results provided by BIO
Arctic BIO/WebTide 17,400 Model results provided by BIO
Bay of Fundy North BIO/WebTide 75,000 Model results provided by BIO
*original source of model grid; grid further developed and expanded by Triton.
IOS – Institute of Ocean Sciences, Sidney, BC
BIO – Bedford Institute of Oceanography, Bedford, N.S.
Triton’s finite element harmonic tidal model Tide2D (see appendix for Tide2D data sheet)
was used to provide tidal height and current velocities data at each node in the model
domains for a varying number of tidal constituents on the model driving boundary.
Purpose-designed code was written to convert Fundy format (BIO) results to Trigrid (IOS)
and to compute for both formats the mean tidal power from the calculated current
constituents at each node in the model domains. This latter analysis is equivalent to doing a
current prediction for each model node for a full year. Mean current power was then
estimated from the indicative formula average ∑ (½ x ρ x U3). These conversion codes were
implemented in Triton’s in-house Coastal Engineering Analysis Package (CEAPack) which
is described in the appendix.
The model results (including tide height, current and mean power) were input via CEAPack,
into Tecplot (www.tecplot.com) for visualization and analysis. Tecplot allows the user to
extract data along cross-section lines. This method was used to estimate potential tidal
power at locations where no accurate current measurements are presently available (e.g.,
Hudson’s Strait, Minas Basin and Discovery Pass).
Figure 2 through Figure 6 show the model domains for a selection of tidal models used for
this study with contoured depths in metres.
Canadian Hydraulic Centre 5 Triton Consultants Ltd.
Natural Resources Canada May 2006Canada Ocean Energy Atlas
Triton Tidal Current Energy Resources
Figure 2: Hudson Bay Tidal Model Region (depths in metres)
Figure 3: Gulf of St. Lawrence Tidal Model Region (depths in metres)
Canadian Hydraulic Centre 6 Triton Consultants Ltd.
Natural Resources Canada May 2006Canada Ocean Energy Atlas
Triton Tidal Current Energy Resources
Figure 4: Bay of Fundy North Tidal Model Region (depths in metres)
Figure 5: British Columbia Coast South Tidal Model Region (depths in metres)
Canadian Hydraulic Centre 7 Triton Consultants Ltd.
Natural Resources Canada May 2006Canada Ocean Energy Atlas
Triton Tidal Current Energy Resources
Figure 6: Queen Charlotte Islands Tidal Model Region (depths in metres)
Canadian Hydraulic Centre 8 Triton Consultants Ltd.
Natural Resources Canada May 2006Canada Ocean Energy Atlas
Triton Tidal Current Energy Resources
3. ANALYSIS METHODOLOGY
3.1 TIDES AND TIDAL CURRENTS IN CANADA
Tidal current energy is derived from the flow of coastal ocean waters in response to the
tides. A background understanding of tides is helpful in understanding this report, therefore
a brief description is included below.
Tides and tidal currents are generated by gravitational forces of the sun and moon on the
ocean waters of the rotating earth. Because of its proximity to the earth, the moon exerts
roughly twice the tide-raising force of the sun. Tides repeat themselves once every 24 hrs
and 50 minutes or the lunar day, which is the time it takes a point on the earth to rotate back
to the same position relative to the moon during each daily revolution.
The sun’s and moon’s gravitational forces creates two “bulges” in the earths ocean waters
one directly under or closest to the moon and other on the opposite side of the earth. These
“bulges” are the two tides a day observed in many places in the world. Unfortunately, this
simple concept is complicated by the fact that the earth’s axis is tilted at 22.5 degrees to the
moons orbit – the two bulges in the ocean are not equal unless the moon is over the
equator. This difference in tide height between the two daily tides is called the diurnal
inequality or declinational tides and they repeat on a 14 day cycle as the moon rotates
around the earth.
Spring and neap tides have been known for many centuries. Spring tides occur at the time
of new or full moon when the sun and moon’s gravitational pull is aligned. These tides occur
at a 15 day cycle and the combination of this cycle and that of the 14 day declinational tidal
cycle explains some of the variability of the tides through the months of the year. There are
more than a hundred harmonic constituents or cyclic components of the tide each with a
different cycle time. These constituents combine so that tides completely repeat themselves
every 18.6 years.
Tides move as shallow water waves in ocean and coastal waters. Despite its name a
shallow water waves can exist in any depth of water. Their main characteristic is that the
whole depth of water moves as the wave passes. This is unlike wind waves which, except in
very shallow water near shore, only move the top few tens of metres of the water column.
Shallow water waves move at a celerity related to the square root of the water depth which
in the open sea can be several hundred kilometres per hour. In the open ocean tides are
small, rarely exceeding 0.5 m. However, as the tidal wave enters coastal waters it slows
down, shoals (increases in height) and is reflected in coastal basins. This explains how a
small deep ocean tide can result in 15 m tides in Minas Basin (Bay of Fundy), 8 m tides at
Prince Rupert (Pacific Coast) and 11 m tides in Ungava Bay (Leaf Bay/Lac aux Feuilles) and
Iqualuit.
As discussed above, the total tidal wave is made up of components (constituents) with
different harmonic periods and amplitudes. The principal semi-diurnal or twice-daily
components are M2 (moon, twice daily) and S2 (sun, twice daily) and the principal diurnal or
once-daily components are K1 and O1. Like all diurnal components, the K1 and O1 result
from the declination of the moon relative to the earth during the monthly tidal cycle. In
coastal waters, these different components may resonate in the bays and straits along the
coast depending on their wavelength determined by water depth and the size and shape of
the basin. This process is much like the slopping of water in a bathtub. For example, the Bay
of Fundy is perfectly “tuned” in terms of water depth and shape to the semi-diurnal tide
entering at its mouth. In BC, the small diurnal tides at Victoria and the increasing tide range
Canadian Hydraulic Centre 9 Triton Consultants Ltd.
Natural Resources Canada May 2006Canada Ocean Energy Atlas
Triton Tidal Current Energy Resources
as one moves north in Strait of Georgia result from the “tuning out” of the M2 tide in Juan de
Fuca Strait and the resonance or tuning of the M2 tide in Strait of Georgia respectively.
Tidal currents result from the passage of the tidal wave. Contrary to popular belief, large
tidal currents do not necessarily require a large tidal range. Some of the largest tidal flows in
the world occur between the islands on the east side of the Philippines where the tidal range
is small but the tide is high in the Pacific at the same time that the tide is low within the
Philippine Islands. In technical terms, this is described as the two tides being 180 degrees
(or half a cycle) out of phase; the result is very large tidal currents.
Another factor that impacts the magnitude of tidal currents is the presence of narrow
passages; these passages result in a narrowing and concentration of tidal flow. However,
the flow through a passage is constrained by the loss of energy due to friction. If this loss
exceeds a certain value the flow will start to reduce and, in the case of a tidal inlet, (e.g.,
Minas Channel, NS and Nakwakto Rapids, BC), the tidal range and resulting flows are
reduced. There is clearly a limit to the energy that can be extracted, either by nature (in
friction) or harnessed (with a tidal power plant).
In British Columbia, some of the highest velocity tidal current flows in Canada occur through
the passages between Strait of Georgia and Johnstone Strait. The tidal range is moderate
(5 m), but the tides from the Pacific through Johnstone Strait are roughly 180 degrees out of
phase with the tides in Strait of Georgia entering south of Vancouver Island.
From a tidal current perspective, it is also important to understand that semi-diurnal tides
produce twice the current of the diurnal tide of the same height. This is because the semi-
diurnal tide rises in half the time of the equivalent diurnal tide. This is particularly important
in British Columbia where many of the potential tidal current power sites are located in areas
where the diurnal tide component is strong. On the other coasts of Canada (Arctic and
Atlantic), the semi-diurnal tidal component typically dominates the tidal regime (see Section
3.3)
3.2 THEORETICAL BASIS
In concept, tidal current energy may be viewed as being extracted directly from the kinetic
energy of a tidal stream, or as being extracted from the potential1 energy of impounded tidal
water. In reality, the two are closely related since the extraction of kinetic energy from a tidal
stream increases the slope of the hydraulic grade line yielding “partially impounded” water
on alternating ends of the tidal channel. Figure 7 shows a hypothetical tidal site that will be
used to describe the approach followed in the assessment of tidal stream energy.
1
Potential (energy) is used here in its technical meaning of energy resulting from vertical position
such as tidal height. Elsewhere in this report the common meaning of “latent” is used.
Canadian Hydraulic Centre 10 Triton Consultants Ltd.
Natural Resources Canada May 2006Canada Ocean Energy Atlas
Triton Tidal Current Energy Resources
Figure 7: Definition Sketch
Location A is representative of those locations typically described by the Canadian
Hydrographic Service as “narrows” or “tidal rapids” which are critical to marine navigation.
For this reason, information pertaining to these areas was used as a primary basis of the
overall assessment of Canadian tidal resources.
For the example shown, the flood/ebb maximum currents in the narrows peak at 12 knots/9
knots a few times per year. It is at this location that the theoretical power (energy flux)
across the channel cross section is computed and tabulated for potential sites throughout
Canada. The theoretical instantaneous power Pcross section (W) in a flow cross-section is given
by:
1
Pcross sec tion = ρAcross sec tionU 3
2
where ρ is the density of water (kg/m3), Across section is the cross sectional area (m2), and U is
the instantaneous current velocity (m/s). The average value of this parameter throughout the
year yields the mean theoretical power at each site considered.
Figure 8 shows the sensitivity of the power calculation to the current speed selected.
Canadian Hydraulic Centre 11 Triton Consultants Ltd.
Natural Resources Canada May 2006Canada Ocean Energy Atlas
Triton Tidal Current Energy Resources
Figure 8: Sensitivity of Power to Current Speed
Current Speed (m /s)
0 1 2 3 4 5 6 7 8 9 10
600 600
500 500
400 400
Power Density (kW)
Power Density (kW)
Sechelt
300 300
250 kW
200 200
Discovery
100 100
25 kW
0 0
7 kts 15 kts
0 2 4 6 8 10 12 14 16 18 20
Current Speed (kts)
Recent theoretical work by Garrett, Cummins and others at the University of Victoria and the
Institute of Ocean Sciences, Sidney, BC, has shown that the kinetic energy approach (U3)
described above may have some limitations in a number of tidal current flows such as tidal
inlets and tidal passages. This work is described in two papers by Dr. Chris Garrett and Dr.
Patrick Cummins (Garrett, 2004; Garrett, 2005). The authors (with help from Dr. Mike
Foreman and Dr. Graig Sutherland at IOS) continue to validate their theoretical approach by
using a tidal model of Discovery Passage/Johnstone Strait, BC The results of this modelling
work will be published in the near future. (pers. comm. Mike Foreman).
A similar modelling approach was used by Triton for the BC Hydro Green Energy Study
(Triton, 2002) to investigate the probable magnitude of the extractable tidal energy in the
Discovery Passage/Johnstone Strait system. This report is available at www.triton.ca. The
results showed that 600 MW of tidal energy could be extracted from this system without
significant impacts in the tidal regime in the adjacent tidal water bodies although tidal
currents in Discovery Passage were reduced by about 10%. No attempts were made in this
study to find the maximum extractable power available from this system. Hopefully, the
continuing work of Garrett and Cummins will allow a determination of the extractable power
as limited by site specific tidal dynamics.
These new theoretical and modelling studies will provide an improved understanding of the
tidal dynamics of tidal current power extraction. Unfortunately, the technical data required for
each site, such as detailed tidal models and tidal measurements is considerable, and its
application is not appropriate for this early stage of the Canada Ocean Energy Atlas
development.
It is therefore believed that theoretical mean power (based on tide stream kinetic energy)
remains a reasonable preliminary benchmark to gauge the relative tidal current potential of
various sites. The reader must however be aware that kinetic energy is only loosely related
to the extractable power since extractable power is highly dependant on the physical
characteristics of the site, local tidal dynamics and the technology applied.
Canadian Hydraulic Centre 12 Triton Consultants Ltd.
Natural Resources Canada May 2006Canada Ocean Energy Atlas
Triton Tidal Current Energy Resources
3.3 PRACTICAL METHODOLOGY
The data sources used for this study are described in Section 2. The practical analysis
methodology employed was as follows:
A. Identify and locate all potential current power sites documented in the Sailing
Directions and Tide and Current Tables for Canada (see Table 1 and Table 2).
Estimate maximum flood and ebb current speeds.
B. Locate these potential sites on the 489 salt water digital charts available for Canada
and estimate width and depth of flow.
C. Identify significant potential current sites not covered by digital charts, specifically
Hudson’s Strait, Ungava Bay and Arctic Region. Review paper chart copies (from
UBC map library) and estimate width and depth of flow.
D. Supplement chart data, particularly in remote regions, with satellite mapping data in
Google Earth.
E. For large sites with limited (or non-existent) current measurement, estimate potential
stream cross-sectional tidal current power from tidal model results (see Section 2.3)
Table 4 shows, in green text, the data collected for each of the identified Canadian tidal
current sites. Text in red are calculated parameters. “Column” 1 through 15 correspond to
the columns in Table 7 and Table 8 (Section 4 Selected Study Results).
A total of 260 sites were identified: 190 of these sites had an estimated tidal current power
potential greater than 1 MW (see Section 4).
Canadian Hydraulic Centre 13 Triton Consultants Ltd.
Natural Resources Canada May 2006Canada Ocean Energy Atlas
Triton Tidal Current Energy Resources
Table 4: Data Assembly
Column Description
1 Region
2 Province
3 Site Name
4 CHS Chart
5 Latitude of Site
6 Longitude of Site
7 CHS Current Station Number
8 Maximum Current Speed Flood (Knots) Vf
9 Maximum Current Speed Ebb (Knots) Ve
10 Mean Maximum Depth Averaged Current Speed (m/s) Umax = (Vf+Ve)/2 x
0.51481 x 0.852
11 Annual mean power density based on the expression ½ x 4/(3π) x U3, where U
is the annual mean peak flood and ebb current velocity equal to 0.9 and 0.73
times their large tide mean depth and cross-section averaged values
respectively. Currents are assumed to vary sinusoidally.
12 Representative channel width at location of maximum currents (m)
13 Representative channel depth at location of maximum currents (m)
14 Representative channel area at mean tide at location of maximum currents
(m2)
15 Mean cross sectional potential power at location of maximum currents
computed from the product of the annual mean power density and the mean
channel area. (MW)
Notes:
1. Conversion to m/s
2. Cross-section averaging
3. This factor has been used for all locations except British Columbia, where diurnal tidal
currents are strong. In BC, a factor of 0.5 was used in Vancouver Island Mainland and 0.6
used in the Queen Charlotte Islands and Pacific Mainland North regions. This assumption
reduces relative BC tidal current power potential compared to the remainder of the country
and must be checked with detailed tidal modelling.
Canadian Hydraulic Centre 14 Triton Consultants Ltd.
Natural Resources Canada May 2006Canada Ocean Energy Atlas
Triton Tidal Current Energy Resources
4. SELECTED STUDY RESULTS
4.1 POTENTIAL TIDAL CURRENT ENERGY SUMMARY TABLES
Table 5 shows the estimated mean potential tidal current energy by Provinces in Canada for
sites with a mean power greater than 1 MW.
Table 5: Canada Potential Tidal Current Energy by Province
Province Potential Tidal Number Average
Current Energy of Sites Size
(MW) (-) (MW)
Northwest 35 4 9
Territories
British Columbia 4,015 89 45
Quebec 4,288 16 268
Nunavut 30,567 34 899
New Brunswick 636 14 45
PEI 33 4 8
Nova Scotia 2,122 15 141
Newfoundland 544 15 36
TOTAL 42,240 191 221
Table 6 shows the distribution of mean potential power by Regions with Canada. Note that
more than 80% of potential tidal current power is in regions presently impacted by winter ice
conditions.
Table 6: Canada Potential Tidal Current Energy by Region
Region Potential Tidal
Current Energy
(MW)
Vancouver Island 3,580
Mainland
Pacific Mainland North 353
Queen Charlotte Islands 81
Arctic 1,008
Hudson Strait 29,595
Ungava 4,112
St. Lawrence River 153
Gulf of St Lawrence 537
Atlantic North 65
Atlantic South 30
Bay of Fundy 2,725
TOTAL 42,240
Table 7 shows the 50 largest potential tidal current power sites in Canada. Table 8 shows
the 50 sites in Canada with the largest Mean Power Density (MW/m2).
Canadian Hydraulic Centre 15 Triton Consultants Ltd.
Natural Resources Canada May 2006Canada Ocean Energy Atlas
Triton Tidal Current Energy Resources
Table 7: Canada Tidal Current Power Sites (50 largest sites)
Mean Max. Depth
Ave. Speed (m/s)
Max. Speed Ebb
Current Station
Passage Width
of Passage (m)
Average Depth
Mean Potential
sectional Area
Flood (knots)
Mean Power
Flow Cross-
Power (MW)
Max. Speed
Longitude
Latitude
(kW/m2)
Density
(knots)
Chart
(m2)
(m)
Region Province Site Name
Hudson Strait Nunavut Mill Island-Salisbury 5450 63.81 -77.50 8 8 0.887 32054 204 6571070 10426
Island
Hudson Strait Nunavut Mill Island-Baffin Island 5450 64.15 -77.57 8 8 1.020 26125 229 6008750 7584
Hudson Strait Nunavut Gray Strait 5456 60.54 -64.69 6 6 2.63 2.110 6000 550 3307800 6979
Hudson Strait Nunavut Nottingham Island- 5450 62.83 -77.93 8 8 0.136 64098 228 1467844 1972
Ungava 2
Bay of Fundy Nova Scotia Minas Basin 4010 45.35 -64.40 7.5 7.5 3.28 6.036 4376 56 274113 1903
Hudson Strait Nunavut Salisbury Island- 5450 63.45 -77.41 8 8 0.360 22146 147 3277608 1704
Nottingham Island
Ungava Quebec Smoky Narrows 5468 58.92 -69.27 12 12 5.25 16.880 1500 55 92400 1560
Ungava Quebec Algernine Narrows 5468 58.79 -69.60 10 10 4.38 9.768 2000 59 130400 1274
Vancouver Island British Seymour Narrows 353902 50.13 -125.35 5000 16 14 6.56 18.160 769 41 33331 786
Mainland Columbia
Hudson Strait Nunavut Lacy/Lawson Islands 5456 60.60 -64.62 7 7 3.06 3.351 2750 80 223575 749
Ungava Quebec Riviere George Entrance 5335 58.76 -66.12 8 8 3.50 5.001 3000 35 125100 626
Gulf of St Newfoundland Strait of Belle Isle 4020 51.45 -56.68 0.201 26069 49 1298236 373
Lawrence
Vancouver Island British N. Boundary Passage 346201 48.79 -123.01 4 4 1.75 0.498 5158 140 734949 366
Mainland Columbia
Vancouver Island British Discovery Pass. S. 353901 50.00 -125.21 7 7 3.06 3.676 1459 42 65626 327
Mainland Columbia
Arctic Nunavut Labrador Narrows 7487 69.71 -82.59 6 6 2.63 2.110 1500 100 151950 321
Vancouver Island British Boundary passage 344101 48.69 -123.27 3.5 3.5 1.53 0.334 4472 175 793760 265
Mainland Columbia
Ungava Quebec Riviere Arnaud (Payne) 5352 59.98 -69.84 9 9 3.94 7.121 2300 9 32200 229
Entrance
Bay of Fundy New Clarks Ground 4340 44.59 -66.64 6 6 2.63 2.110 4092 22 102300 216
Brunswick
Vancouver Island British Current Passage 2 354401 50.39 -125.86 6 6 2.63 1.681 1502 80 123931 208
Mainland Columbia
Vancouver Island British Weyton Passage 354601 50.59 -126.82 6 6 2.63 1.681 1535 75 118985 200
Mainland Columbia
Ungava Quebec Koksoak Entrance 5376 58.52 -68.17 6 6 2.63 2.110 2000 40 92400 195
Hudson Strait Nunavut Cape Enouolik 7065 64.95 -78.33 5 5 2.19 1.221 5000 25 142500 174
Canadian Hydraulic Centre 16 Triton Consultants Ltd.
Natural Resources Canada May 2006Canada Ocean Energy Atlas
Triton Tidal Current Energy Resources
Mean Max. Depth
Ave. Speed (m/s)
Max. Speed Ebb
Current Station
Passage Width
of Passage (m)
Average Depth
Mean Potential
sectional Area
Flood (knots)
Mean Power
Flow Cross-
Power (MW)
Max. Speed
Longitude
Latitude
(kW/m2)
Density
(knots)
Chart
(m2)
(m)
Region Province Site Name
Pacific Mainland British Nakwakto Rapids 355001 51.10 -127.50 6700 14 16 6.56 29.062 434 10 5643 164
North Columbia
Vancouver Island British Current Passage 1 354401 50.41 -125.87 5 5 2.19 0.973 1398 100 143331 139
Mainland Columbia
Vancouver Island British Dent Rapids 354301 50.41 -125.21 5530 11 8 4.16 6.672 420 45 19955 133
Mainland Columbia
Vancouver Island British South Pender Is 344101 48.72 -123.19 4 4 1.75 0.498 1985 100 203416 101
Mainland Columbia
Bay of Fundy New Devils Half Acre 4340 44.54 -66.69 6 6 2.63 2.110 2133 18 44793 95
Brunswick
Vancouver Island British Yaculta Rapids 354301 50.38 -125.15 10 10 4.38 7.782 539 20 12135 94
Mainland Columbia
St. Lawrence Quebec Passage de Ile aux 1233 47.43 -70.43 5 6 2.41 1.625 1700 30 56100 91
River Coudre
Vancouver Island British Arran Rapids 354301 50.42 -125.14 5600 14 10 5.25 13.447 271 22 6629 89
Mainland Columbia
Ungava Quebec Nakertok Narrows 5352 60.00 -70.27 9 9 3.94 7.121 1100 6 12100 86
Bay of Fundy New Old Sow 4114 44.92 -66.99 6 6 2.63 2.110 625 60 39375 83
Brunswick
Arctic Nunavut Bellot Strait 7752 72.00 -94.48 8 8 3.50 5.001 1000 16 16400 82
Arctic Nunavut Cache Pt Channel 7710 68.62 -113.55 5 5 2.19 1.221 6000 10 62400 76
Vancouver Island British Secheldt Rapids 2 351403 49.74 -123.90 9999 14. 16 6.67 27.599 261 8 2739 76
Mainland Columbia 5
Arctic Nunavut James Ross Strait 7083 66.69 -95.87 5 5 2.19 1.221 5900 10 61360 75
Bay of Fundy New Head Harbour Passage 1 4114 44.95 -66.93 5 5 2.19 1.221 890 65 60520 74
Brunswick
Bay of Fundy Nova Scotia Northwest Ledge 4118 44.30 -66.42 4 4 1.75 0.625 5334 18 117348 73
Ungava Quebec Mikitok Narrows 5352 60.00 -70.27 9 9 3.94 7.121 700 8 9590 68
Arctic Nunavut Egg Island 7735 68.55 -97.40 7 7 3.06 3.351 750 25 19050 64
Pacific Mainland British Otter Passage 3742 53.00 -129.73 8535 6 6 2.63 1.860 620 50 32860 61
North Columbia
Vancouver Island British Gillard Passage 1 354301 50.39 -125.16 5500 13 10 5.03 11.835 237 16 4393 52
Mainland Columbia
Vancouver Island British Scott Channel 362501 50.79 -128.50 3 3 1.31 0.210 9970 22 244256 51
Mainland Columbia
Vancouver Island British Active Pass 344201 48.86 -123.33 3000 8 8 3.50 3.984 561 20 12628 50
Mainland Columbia
Bay of Fundy New Gran Manan Channel 4340 44.78 -66.86 2.5 2 0.98 0.111 5446 80 452018 50
Canadian Hydraulic Centre 17 Triton Consultants Ltd.
Natural Resources Canada May 2006Canada Ocean Energy Atlas
Triton Tidal Current Energy Resources
Mean Max. Depth
Ave. Speed (m/s)
Max. Speed Ebb
Current Station
Passage Width
of Passage (m)
Average Depth
Mean Potential
sectional Area
Flood (knots)
Mean Power
Flow Cross-
Power (MW)
Max. Speed
Longitude
Latitude
(kW/m2)
Density
(knots)
Chart
(m2)
(m)
Region Province Site Name
Brunswick
Arctic Nunavut Seahorse Point 7065 63.83 -80.13 5 5 2.19 1.221 2000 20 40800 50
Bay of Fundy Nova Scotia The Hospital 4242 43.44 -66.00 4 4 1.75 0.625 3600 18 79200 50
Gulf of St Newfoundland Pointe Armour 4020 51.45 -56.86 4 5 1.97 0.890 1500 35 53700 48
Lawrence
Gulf of St Newfoundland Forteau 4020 51.41 -56.95 4 5 1.97 0.890 1500 35 53700 48
Lawrence
Pacific Mainland British Beaver Passage 3747 53.73 -130.37 8545 4 4 1.75 0.551 810 100 83430 46
North Columbia
Arctic Nunavut Nettilling Fiord 7051 66.72 -72.83 8 8 3.50 5.001 1700 5 9180 46
Vancouver Island British Nahwitti Bar 1 354901 50.89 -127.99 5.5 5.5 2.41 1.295 2993 9 34417 45
Mainland Columbia
TOTAL 40697
Notes:
1. The tidal current site data shown in yellow in Table 7 and Table 8 were derived from tidal model results (see Section 4.3 and
Section 2.3.
2. Some of the tidal current sites shown in Table 7 and Table 8 are located in close proximity to each other in the same tidal
channel or tidal inlet (e.g. Seymour Narrows/Discovery Passage in BC and Smoky Narrows and Algernine Narrows in Leaf
Bay, Ungava, PQ). The total extractable power available from such adjacent sites will depend on the specific characteristics
of the driving tidal dynamics, site geometry and the energy extraction technology used.
Canadian Hydraulic Centre 18 Triton Consultants Ltd.
Natural Resources Canada May 2006Canada Ocean Energy Atlas
Triton Tidal Current Energy Resources
Table 8: Canada Potential Tidal Current Power Sites (50 sites ranked by power density kW/m2)
Mean Max. Depth
Ave. Speed (m/s)
Max. Speed Ebb
Current Station
Passage Width
of Passage (m)
Average Depth
Mean Potential
sectional Area
Flood (knots)
Mean Power
Flow Cross-
Power (MW)
Max. Speed
Longitude
Latitude
(kW/m2)
Density
(knots)
Chart
(m2)
(m)
Region Province Site Name
Pacific Mainland British Nakwakto Rapids 355001 51.10 -127.50 6700 14 16 6.56 29.062 434 10 5643 164
North Columbia
Vancouver Island British Secheldt Rapids 2 351403 49.74 -123.90 9999 14. 16 6.67 27.599 261 8 2739 76
Mainland Columbia 5
Vancouver Island British Seymour Narrows 353902 50.13 -125.35 5000 16 14 6.56 18.160 769 41 33331 786
Mainland Columbia
Ungava Quebec Smoky Narrows 5468 58.92 -69.27 12 12 5.25 16.880 1500 55 92400 1560
Bay of Fundy New Reversing Falls 4141 45.26 -66.09 12 12 5.25 16.880 90 15 1746 29
Brunswick
Pacific Mainland British Kildidt Narrows 393701 51.89 -128.11 12 12 5.25 14.880 75 2 375 6
North Columbia
Vancouver Island British Arran Rapids 354301 50.42 -125.14 5600 14 10 5.25 13.447 271 22 6629 89
Mainland Columbia
Vancouver Island British Gillard Passage 1 354301 50.39 -125.16 5500 13 10 5.03 11.835 237 16 4393 52
Mainland Columbia
Ungava Quebec Algernine Narrows 5468 58.79 -69.60 10 10 4.38 9.768 2000 59 130400 1274
Vancouver Island British Hole-in-the-Wall 1 353901 50.30 -125.21 5100 12 9.5 4.70 9.667 189 8 1985 19
Mainland Columbia
Vancouver Island British Yaculta Rapids 354301 50.38 -125.15 10 10 4.38 7.782 539 20 12135 94
Mainland Columbia
Ungava Quebec Riviere Arnaud (Payne) 5352 59.98 -69.84 9 9 3.94 7.121 2300 9 32200 229
Entrance
Ungava Quebec Nakertok Narrows 5352 60.00 -70.27 9 9 3.94 7.121 1100 6 12100 86
Ungava Quebec Mikitok Narrows 5352 60.00 -70.27 9 9 3.94 7.121 700 8 9590 68
Atlantic South Newfoundland Placentia Gut 4841 47.25 -53.96 9 9 3.94 7.121 80 3 336 2
Vancouver Island British Dent Rapids 354301 50.41 -125.21 5530 11 8 4.16 6.672 420 45 19955 133
Mainland Columbia
Pacific Mainland British Draney Narrows` 393102 51.47 -127.56 9 9 3.94 6.277 139 8 1463 9
North Columbia
Pacific Mainland British Hidden Inlet 399401 54.95 -130.33 9 9 3.94 6.277 142 3 781 5
North Columbia
Bay of Fundy Nova Scotia Minas Basin 4010 45.35 -64.40 7.5 7.5 3.28 6.036 4376 56 274113 1903
Vancouver Island British Upper rapids 2 353701 50.31 -125.23 5030 9 9 3.94 5.673 242 18 4955 28
Mainland Columbia
Vancouver Island British Gillard Passage 2 354301 50.40 -125.15 5500 10 8 3.94 5.673 393 10 4916 28
Mainland Columbia
Canadian Hydraulic Centre 19 Triton Consultants Ltd.
Natural Resources Canada May 2006Canada Ocean Energy Atlas
Triton Tidal Current Energy Resources
Mean Max. Depth
Ave. Speed (m/s)
Max. Speed Ebb
Current Station
Passage Width
of Passage (m)
Average Depth
Mean Potential
sectional Area
Flood (knots)
Mean Power
Flow Cross-
Power (MW)
Max. Speed
Longitude
Latitude
(kW/m2)
Density
(knots)
Chart
(m2)
(m)
Region Province Site Name
Vancouver Island British Gillard Passage 3 354301 50.39 -125.16 5500 10 8 3.94 5.673 92 5 686 4
Mainland Columbia
Pacific Mainland British Outer Narrows 355001 51.09 -127.63 7 10 3.72 5.288 210 17 4206 22
North Columbia
Vancouver Island British Gabriola Pass. 347501 49.13 -123.70 3300 8.5 9 3.83 5.213 137 8 1435 7
Mainland Columbia
Ungava Quebec Riviere George Entrance 5335 58.76 -66.12 8 8 3.50 5.001 3000 35 125100 626
Arctic Nunavut Bellot Strait 7752 72.00 -94.48 8 8 3.50 5.001 1000 16 16400 82
Arctic Nunavut Nettilling Fiord 7051 66.72 -72.83 8 8 3.50 5.001 1700 5 9180 46
Vancouver Island British Porlier Pass 347303 49.01 -123.59 3100 9 8 3.72 4.779 339 15 5926 28
Mainland Columbia
Vancouver Island British Quatsino Narrows 368106 50.55 -127.56 9200 9 8 3.72 4.779 207 18 4240 20
Mainland Columbia
Vancouver Island British Dodds Narrows 347501 49.14 -123.82 4000 9 8 3.72 4.779 91 9 1047 5
Mainland Columbia
Pacific Mainland British Hawkins Narrows 372201 53.41 -129.42 8 8 3.50 4.409 55 3 301 1
North Columbia
St. Lawrence Quebec Travers de Saint-Roch 1233 47.36 -70.26 7.5 7.5 3.28 4.121 500 15 9000 37
River
Vancouver Island British Active Pass 344201 48.86 -123.33 3000 8 8 3.50 3.984 561 20 12628 50
Mainland Columbia
Vancouver Island British Nitinat Narrows 364703 48.67 -124.85 8 8 3.50 3.984 61 20 1376 5
Mainland Columbia
Vancouver Island British Discovery Pass. S. 353901 50.00 -125.21 7 7 3.06 3.676 1459 42 65626 327
Mainland Columbia
Hudson Strait Nunavut Lacy/Lawson Islands 5456 60.60 -64.62 7 7 3.06 3.351 2750 80 223575 749
Arctic Nunavut Egg Island 7735 68.55 -97.40 7 7 3.06 3.351 750 25 19050 64
Bay of Fundy Nova Scotia Petit Passage 4118 44.39 -66.21 7 7 3.06 3.351 335 18 7035 24
Ungava Quebec McLean Strait - 60.35 -64.63 7 7 3.06 3.351 200 8 2200 7
Hudson Strait Nunavut McLelan Strait 4773 60.35 -64.63 7 7 3.06 3.351 200 8 1880 6
Bay of Fundy New Lubec Narrows 4114 44.86 -66.98 6 8 3.06 3.351 180 3 1080 4
Brunswick
Ungava Quebec Koksoak Narrows 5376 58.18 -68.32 5 8.5 2.95 3.004 400 30 14400 43
Pacific Mainland British Porcher Narrows 3761 53.90 -130.47 8551 7 7 3.06 2.954 120 10 1560 5
North Columbia
Arctic Nunavut Wager Bay Narrows 5440 65.31 -87.74 6 7 2.84 2.683 3600 1440 4
Vancouver Island British Green Pt Rap. 1 354301 50.44 -125.51 7 7 3.06 2.669 440 25 12093 32
Canadian Hydraulic Centre 20 Triton Consultants Ltd.
Natural Resources Canada May 2006Canada Ocean Energy Atlas
Triton Tidal Current Energy Resources
Mean Max. Depth
Ave. Speed (m/s)
Max. Speed Ebb
Current Station
Passage Width
of Passage (m)
Average Depth
Mean Potential
sectional Area
Flood (knots)
Mean Power
Flow Cross-
Power (MW)
Max. Speed
Longitude
Latitude
(kW/m2)
Density
(knots)
Chart
(m2)
(m)
Region Province Site Name
Mainland Columbia
Vancouver Island British Whirlpool Rapids 354401 50.46 -125.76 7 7 3.06 2.669 321 28 9804 26
Mainland Columbia
Vancouver Island British Lower Rapids 1 353701 50.31 -125.26 7 7 3.06 2.669 371 8 3891 10
Mainland Columbia
Vancouver Island British Race Passage 344001 48.31 -123.54 1200 6 7 2.84 2.137 884 20 19885 42
Mainland Columbia
Vancouver Island British Stuart Narrows 354701 50.90 -126.94 6 7 2.84 2.137 261 7 2478 5
Mainland Columbia
Hudson Strait Nunavut Gray Strait 5456 60.54 -64.69 6 6 2.63 2.110 6000 550 3307800 6979
Arctic Nunavut Labrador Narrows 7487 69.71 -82.59 6 6 2.63 2.110 1500 100 151950 321
Bay of Fundy New Clarks Ground 4340 44.59 -66.64 6 6 2.63 2.110 4092 22 102300 216
Brunswick
TOTAL 16441
4.2 TIDAL RESOURCE MAPS
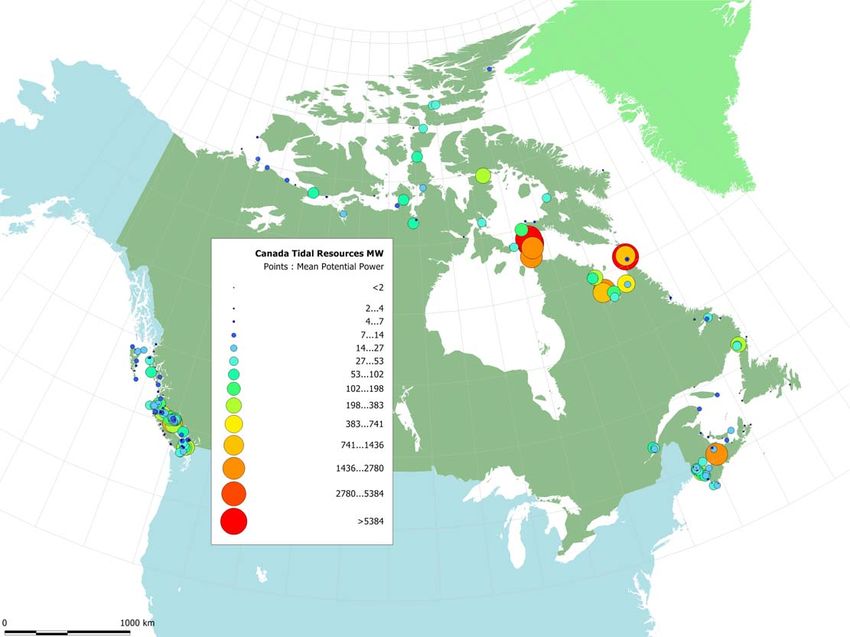
Figure 9 shows a map (in Manifold GIS) of the Canadian tidal current sites ranked by potential mean power. Figure 10, Figure 11 and
Figure 12 show detail areas of this map, namely: Pacific Coast, Hudson’s Strait/Ungava Bay and the Atlantic Coast respectively.
These latter three maps are at approximately the same scale.
Canadian Hydraulic Centre 21 Triton Consultants Ltd.
Natural Resources Canada May 2006Canada Ocean Energy Atlas
Triton Tidal Current Energy Resources
Figure 9: Canada Potential Tidal Current Resource Sites
Canadian Hydraulic Centre 22 Triton Consultants Ltd.
Natural Resources Canada May 2006Canada Ocean Energy Atlas
Triton Tidal Current Energy Resources
Figure 10: Potential Tidal Current Resource Sites - Pacific Coast
Canadian Hydraulic Centre 23 Triton Consultants Ltd.
Natural Resources Canada May 2006Canada Ocean Energy Atlas
Triton Tidal Current Energy Resources
Figure 11: Potential Tidal Current Resource Sites - Hudson's Strait and Ungava Bay
Canadian Hydraulic Centre 24 Triton Consultants Ltd.
Natural Resources Canada May 2006Canada Ocean Energy Atlas
Triton Tidal Current Energy Resources
Figure 12: Potential Tidal Current Resource Sites - Atlantic Coast
Canadian Hydraulic Centre 25 Triton Consultants Ltd.
Natural Resources Canada May 2006Canada Ocean Energy Atlas
Triton Tidal Current Energy Resources
4.3 POTENTIAL TIDAL CURRENT ENERGY DENSITY MAPS
Figure 13 through Figure 16 show maps of power density in units W/m for the Pacific Coast,
Hudson’s Strait, Atlantic Coast and Bay of Fundy North respectively. The power density
colour scales for all four maps are similar. These maps were developed from tidal model
results.
Figure 13: Power Density - Pacific Coast
Canadian Hydraulic Centre 26 Triton Consultants Ltd.
Natural Resources Canada May 2006Canada Ocean Energy Atlas
Triton Tidal Current Energy Resources
Figure 14: Power Density - Hudson's Strait
Canadian Hydraulic Centre 27 Triton Consultants Ltd.
Natural Resources Canada May 2006Canada Ocean Energy Atlas
Triton Tidal Current Energy Resources
Figure 15: Power Density - Atlantic Coast
Canadian Hydraulic Centre 28 Triton Consultants Ltd.
Natural Resources Canada May 2006Canada Ocean Energy Atlas
Triton Tidal Current Energy Resources
Figure 16: Power Density - Bay of Fundy North
Canadian Hydraulic Centre 29 Triton Consultants Ltd.
Natural Resources Canada May 2006Canada Ocean Energy Atlas
Triton Tidal Current Energy Resources
5. SUMMARY AND RECOMMENDATIONS FOR FURTHER STUDIES
5.1 SUMMARY
As detailed in this summary report, Phase 1 of the Canada Ocean Energy Atlas project has
identified a significant tidal current energy resource in Canada. The potential tidal energy in
this country is estimated to exceed a mean power of 42,000 MW or about 365
TW.hours/year. To put this figure in perspective, this represents over 70% of Canada’s
present annual electrical power consumption.
The estimated Canadian tidal current energy resource is an indication of the potential
energy available, not the actual power that can be exploited. Environmental, technological,
climate and economic factors will determine what proportion of the potential can be utilised.
5.2 RECOMMENDATIONS FOR FUTURE STUDIES
5.2.1 Modelling
This preliminary study has identified a number of major tidal current power resources across
Canada. It is recommended that near-term modelling studies should concentrate on three
specific areas.
• Minas Basin, Nova Scotia
• Georgia and Johnstone Straits, British Columbia.
• Hudson’s Strait and Ungava Bay
The objective of these modelling studies should be to improve the definition of the tidal
current resources available, to provide estimates of extractable energy and to make an initial
evaluation of the environmental impact of tidal energy extraction.
5.2.2 Mapping
A principal objective of the Canada Ocean Energy Atlas Project is to make information on
Ocean Energy readily available to the Public. As it is clear that Ocean Energy data is
primarily geographically-based, the value of a Geographic Information Systems (GIS) for
disseminating this information is clear. Over the course of this project, Manifold GIS
(www.manifold.net) has been used with success by Triton Consultants. Manifold provides an
ideal user-friendly and economic platform for displaying and interrogating geographical-
oriented data. GIS packages (such as Manifold) can be easily implemented as web-based
applications and this would appear to be the best way to make Canadian Ocean Energy
data available to the Public.
It is recommended that a web-based GIS system be implemented during the next phases of
the Ocean Energy Atlas Project.
Canadian Hydraulic Centre 30 Triton Consultants Ltd.
Natural Resources Canada May 2006Canada Ocean Energy Atlas
Triton Tidal Current Energy Resources
6. REFERENCES
Garrett, C. & Cummins, P., 2004. Generating power from tidal currents. J. Waterway Port
Coastal Ocean Eng 130 114-118
Garrett, C. & Cummins, P., 2005. The power potential of tidal currents in channels. Proc. R.
Soc. A (2005) 461, 2563-2572
Triton Consultants Ltd., 2002. Green energy study for British Columbia. Phase 2: Mainland.
Canadian Hydraulic Centre 31 Triton Consultants Ltd.
Natural Resources Canada May 2006Triton
APPENDICESTriton
APPENDIX A
CEAPack DescriptionCEAPACK CEATools
Coastal Engineering Analysis Package CEATools contains routines for completing sci-
entific and engineering calculations such as:
• Tidal harmonic analysis and prediction
OVERVIEW • Steady wind wave generation
CEAPack is a unified analysis and design tool- • Monochromatic and spectral wave transformation
box useful to the practicing coastal engineering design
consultant. It contains tools for tackling problems as nu- • Wave height distribution
merically intensive as spectral wave hindcasting and the • Propeller wash current generation
assessment of the dynamic behaviour of floating bodies, • Initiation of sediment transport
to simple but laborious tasks such as computing pile
interference and rubble-mound breakwater volume.
The modules within CEAPack are implemented
upon Microsoft Windows .NET framework with a stan-
dard user interface and data conventions common to all
modules. This standardization frees the user from focus-
ing on data manipulation and allows him to concentrate
on the engineering issues.
CEAPack is presently configured with over 30
routines implemented in the following four modules
which are called from the CEAPack Launcher interface
shown below:
• CEATools - Calculates scientific and engineering
properties indirectly related to coastal engineering CEADesign
design (e.g., tidal prediction, fluid properties, simple CEADesign contains routines to assist in the
wave generation/propagation, sediment transport) design of rubble-mound breakwaters, caisson struc-
• CEADesign - Design aids directly related to coastal tures, dredged channels, floating structures, piled struc-
engineering design (e.g., breakwater armour size tures, pipelines and ports. Design parameters such as
determination, submarine pipeline stability, floating minimum structure dimensions, applied forces, and
body stability) structure response and efficiency are calculated.
• CEAData - 1D, 2D and 3D constant and time-
varying dataset conversion, analysis, and visualiza-
tion (e.g., finite element grid generation, statistical
analysis, animation)
• Models - A number of individual programs for simu-
lating coastal processes. Many of these are based
on existing public-domain or research code that
have been modified to fit the CEAPack framework.
CEAData
CEAData is based on the National Center for
Supercomputing Applications Hierarchical Data Format
(HDF) with invented conventions for the storage of virtu-
ally any type of structured or unstructured mesh and
associated scalar and vector time-varying data.
CEAData contains routines for importing data,
performing correlation and event analyses, visualizing
data and exporting to other formats. In addition, several
simple models are included such as 1D wave genera-
tion, sediment transport calculation, tide prediction, etc.Models Supported Data Formats
CEAPack contains GUI interfaces and/or pre– CEAPack was designed to leverage the many
and post-processors to several industry-standard nu- advanced features that already exist in various industry-
merical models including the following: standard commercial software packages. In addition to
• SMP (US Navy) those formats supported implicitly in the models inter-
faces described previously, a wide variety of import and/
- vessel motion analysis for single free-floating or export file format options are supported including:
vessels of standard shape
• Standard
• DynMoor (Triton)
- ASCII format (DAT, CSV)
- dynamic mooring analysis model based on
SMP results - Binary format (XLS, PDF, MDF, DBF)
• AQWA (Century Dynamics) - Images formats (BMP, EMF, GIF, ICO, JPG,
PNG, TIF, WMF)
- vessel motion and mooring analysis for multi-
ple floating and fixed bodies of arbitrary shape - Animation formats (AVI)
• Data Visualization
- Golden Software Surfer Grid format (GRD)
- TecPlot format (DAT, PLT)
• Grid Generation
- TriGrid, Institute of Ocean Sci. format (NGH)
• Geographic Information Systems
• WaveHind (Triton) - ESRI Shape File format (SHP)
- 1D wave generation model - Manifold Project format (MAP)
- MapGen format (DAT)
• SWAN (Delft University)
- 2D shallow water wave generation and propa- • Engineering and Scientific
gation model - AutoDesk AutoCAD formats (DXF, SCR)
• WaveWatch III (US NOAA) - Danish Hydraulic Institute Litpack formats
- 2D coastal ocean water wave generation and - Canadian Marine Environmental Data Service
propagation model formats
• REFDIF (University of Delaware) - Meteorological Service of Canada formats
- 2D refraction-diffraction phase-averaging short - US NOAA meteorological formats
wave propagation model - US NOAA raster nautical chart format (BSB)
• FUNWAVE (University of Delaware) - World Meteorological Organization Gridded
- 2D refraction-diffraction phase-resolving short Binary format (GRB)
wave propagation model - Unidata NetCDF format (NC, CDF)
- US National Center for Supercomputing Appli-
cations HDF5 format (H5)
- Canadian Hydrographic Service water level,
current and bathymetry formats
- Geodetic Survey Division, Natural Resources
Canada format (GHOST)
- various meteorological and oceanographic
• Tide2D (Roy Walters) instruments from vendors such as InterOcean,
- 2D harmonic tidal model Sontek, Seabird, RD Instruments
• RICOM (Roy Walters)
- 2D/3D semi-implicit semi-Lagrangian hydrody-
namic model TRITON CONSULTANTS LTD.
• SEDX (Public Works Canada) 3530 West 43rd Avenue, Vancouver
- alongshore sediment transport calculator British Columbia V6N 3J9 CANADA
• SBeach and Genesis (US Army) Telephone: 604 263-3500
- 2D vertical and 2D horizontal shoreline evolu- Fax: 604 676-2252
tion models Website: www.triton.ca
Email: info@triton.caTriton
APPENDIX B
Hydrodynamic Model Tide 2D
DescriptionTRITON
Technical Data Sheet
HYDRODYNAMIC MODELLING
Triton maintains a suite of finite element programs for the assessment of free surface flow in two
and three dimensions. All programs were developed by Dr. Roy Walters formerly of the US
Geological Survey. Th e program modules include:
Tide2D Two-dimensional frequency WEq Two dimensional time domain solution
domain solution of the non-linear of the non-linear shallow water
shallow water equations equations
Tide3D Three-dimensional frequency XTide Two dimensional frequency domain
domain solution of the non-linear solution of the non-linear shallow
shallow water equations water and advection-dispersion
equations
Depending on the application, either a frequency domain (harmonic) or time domain (time-
stepping) solution may be more appropriate. All modules use a finite element discretisation in
space and a harmonic expansion or predictor-corrector approach in time (Walters, 1987). The
shallow water equations solve the two or three-dimensional continuity and momentum equations
using standard Galerkin techniques. The spatial domain is discretised by defining a set of two-
dimensional triangular elements in the horizontal plane, and a sigma coordinate system in the
vertical for the third dimension if required.
A typical analysis sequence following the finite element grid generation stage (using the
commercially-available TriGrid package) begins with the computationally efficient two-dimesional
frequency domain analysis (Tide2D) of steady conditions and harmonic driving components.
Short (two to three week) time segments of particular interest are examined using the more-
computationally intensive and detailled two-dimensional timestepping solution (WEq). Depending
on the importance of three dimensional effects (e.g., salinity, temperature, freshwater influx),
Tide3D can be used to with marginal computational penalties over Tide2D. XTide is used to
quickly assess dispersion of conservative pollutants.You can also read