SUMMER PERFORMANCE HOUSE DESIGNS AND ANALYSIS
←
→
Page content transcription
If your browser does not render page correctly, please read the page content below
CALIFORNIA
                                                                     ENERGY
                                                                     COMMISSION

            SUMMER PERFORMANCE HOUSE
                  DESIGNS AND ANALYSIS

                                                                         TECHNICAL REPORT
Summer Performance Houses for California Climate Builder
Information

Inland Climate House Performance Analysis Report

                                                                     February 2004
                                                                     P500-04-009-A2

                                                   Arnold Schwarzenegger, Governor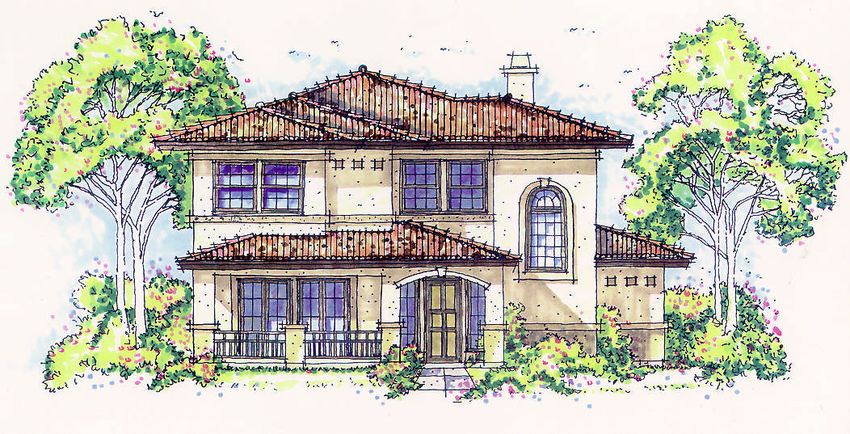
Prepared By:
Davis Energy Group
Dave Springer
123 C Street
Davis, California 95616
Contract No. 500-98-024

Prepared For:
California Energy Commission
Phil Spartz
Project Manager

Nancy Jenkins
PIER Buildings Program Manager

Terry Surles
PIER Program Director

Robert L. Therkelsen
Executive Director

                      DISCLAIMER
This report was prepared as the result of work sponsored by the
California Energy Commission. It does not necessarily represent
the views of the Energy Commission, its employees or the State
of California. The Energy Commission, the State of California, its
employees, contractors and subcontractors make no warrant,
express or implied, and assume no legal liability for the
information in this report; nor does any party represent that the
uses of this information will not infringe upon privately owned
rights. This report has not been approved or disapproved by the
California Energy Commission nor has the California Energy
Commission passed upon the accuracy or adequacy of the
information in this report.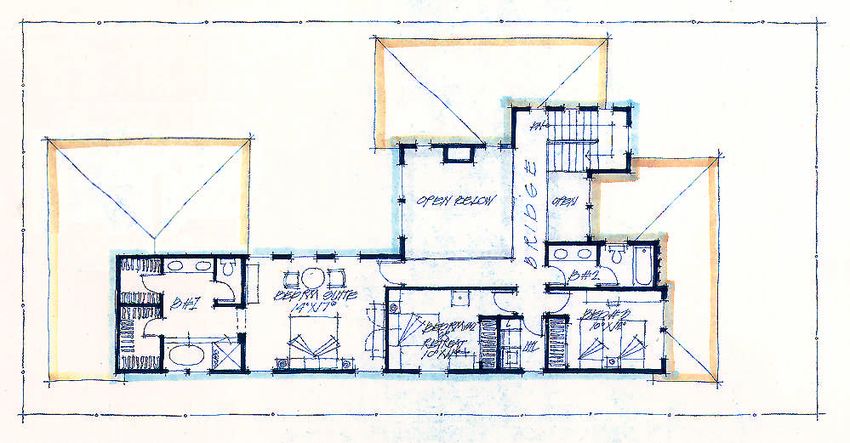
Preface
The Public Interest Energy Research (PIER) Program supports public interest energy
research and development that will help improve the quality of life in California by
bringing environmentally safe, affordable, and reliable energy services and products to
the marketplace.
The PIER Program, managed by the California Energy Commission (Commission),
annually awards up to $62 million to conduct the most promising public interest energy
research by partnering with Research, Development, and Demonstration (RD&D)
organizations, including individuals, businesses, utilities, and public or private research
institutions.
PIER funding efforts are focused on the following six RD&D program areas:
   •   Buildings End-Use Energy Efficiency
   •   Industrial/Agricultural/Water End-Use Energy Efficiency
   •   Renewable Energy
   •   Environmentally-Preferred Advanced Generation
   •   Energy-Related Environmental Research
   •   Energy Systems Integration
What follows is an attachment to the final report for the Alternatives to Compressor
Cooling Phase V project, Contract Number 500-98-024, conducted by Davis Energy
Group. This project contributes to the PIER Building End-Use Energy Efficiency
program.
This attachment, “Summer Performance House Designs and Analysis” (Attachment A-2),
provides supplemental information to the project’s final report and includes the following
two documents:
   •   Summer Performance Houses for California Climate Builder Information
   •   Inland Climate House Performance Analysis Report
For more information on the PIER Program, please visit the Commission's Web site at:
http://www.energy.ca.gov/research/index.html or contact the Commission's Publications
Unit at 916-654-5200.
Abstract
This “Summer Performance House Designs and Analysis” attachment is a set of two documents
produced by the Alternatives to Compressor Cooling Phase V project, funded by the California
Energy Commission’s Public Interest Energy Research (PIER) Program.
The multi-year Alternatives to Compressor Cooling Phase V (ACC) Project has the goal of
reducing residential peak load in California by using nighttime ventilation to cool houses that are
designed for optimal summer performance and that potentially eliminate the need for air
conditioning in transition climates.
This attachment, “Summer Performance House Designs and Analysis” (Attachment A-2),
provides supplemental information to the project’s final report and includes the following
reports:
Summer Performance Houses for California Climate Builder Information
Three prototype Summer Performance House designs ranging from 1,700 to 2,400 square feet
are available to residential builders and developers in the State of California: Two-Story Side
Court House, Single-Story Forecourt House and Single-Story Compact House. The Summer
Performance design strikes a balance between using a mechanical system and the construction of
the house itself to provide comfort for the occupants. The house uses the cool air of a California
summer night to prepare for the following day. This is made possible by increasing the quality of
the building shell and using a heating-cooling system that ventilates the house with cool night
air.
Inland Climate House Performance Analysis Report
This reports describes results of DOE2 modeling on one of the “Summer Performance House”
designs to estimate the potential energy savings, peak demand reduction, and economics of
residential ventilation cooling in California.
SUMMER PERFORMANCE HOUSES
      for CALIFORNIA CLIMATES

       BUILDER INFORMATION

      Loisos / Ubbelohde - Davis Energy Group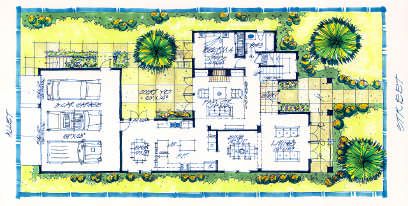
All ideas, designs, arrangements and plans indicated or represented by these drawings where
created, evolved and developed by Loisos/Ubbelohde and the Davis Energy Group (DEG)
under contract to the California Institute for Energy Efficiency (CIEE) and subsequently under
a Public Interest Energy Research (PIER) contract with the California Energy Commission
(CEC). Structural design was developed by Horowitz Taylor Engineering under contract to
Loisos/Ubbelohde.

The research reported here was funded by the California Institute for Energy Efficiency
(CIEE), a research unit by the University of California and subsequently under a Public
Interest Energy Research (PIER) with the California Energy Commission (CEC). Publication of
research results does not imply CIEE or CEC endorsement or agreement with these findings
nor that of any CIEE sponsor.

© 2001 Loisos / Ubbelohde and Davis Energy Group

 For more information please contact:

Loisos / Ubbelohde                            Davis Energy Group
5806 Lawton Ave                               123 C Street
Oakland, CA 94618                             Davis, CA 95616

510-547-4199                                  530-753-1100
510-653-3763                                  530-753-4125

george@coolshadow.com                         deg@davisenergy.com
WHAT IS A SUMMER PERFORMANCE HOUSE ?

Summer Performance Houses are responsive to California residential markets, increase occupant com-
fort, reduce electrical demand and offer a new marketing approach responsive to environmental and
energy concerns.

Production housing is a competitive field. Houses are becoming more sophisticated and offering more
and more features. New houses have to be better built, more comfortable and deliver excellent perform-
ance. At the same time, California has entered a period of energy instability and skyrocketing prices that
will effect homeowners for years to come. The Summer Performance house addresses both aspects of
the current situation by offering a high quality home, increased comfort and lowered energy use. These
are not demonstration houses for extreme low-energy solutions, but rather market-responsive designs
which reduce electrical demand by reducing the need for compressive air conditioning.

The Summer Performance design strikes a balance between using a mechanical system and the construc-
tion of the house itself to provide comfort for the occupants. The house uses the cool air of a California
summer night to prepare for the following day. This is made possible by increasing the quality of the
building shell and using a heating-cooling system that ventilates the house with cool night air. Care in
the design of cross ventilation, insulation, overhangs for shading and interior materials help reduce the
necessity for air conditioning.

These houses will appeal to customers and provide a product that developers can build and sell with
reduced risk. The house construction is based on standard industry techniques and materials; concrete
slab on grade, wood frame walls, wood truss roof, batt insulation and exterior stucco. Windows and
French doors are vinyl frame with double pane insulated glass. Interior options include tile or slate
floors on the ground floor to replace carpeting. Industry provided cost estimates confirm that the house
is close to the typical square foot cost assumed by most developers. The houses performs in any orienta-
tion, as residential developments seldom match specific design elements with particular lot conditions.

Three prototype Summer Performance House designs ranging from 1,700 to 2,400 square feet are avail-
able to residential builders and developers in the State of California: Two-Story Side Court House, Single-
Story Forecourt House and Single-Story Compact House. the prototype designs have been developed,
through the support of the California Energy Commission and the California Institute for Energy
Efficiency, by a team of architects, engineers and researchers in to offer improved energy conserving
houses to the public.
                                                                                                         1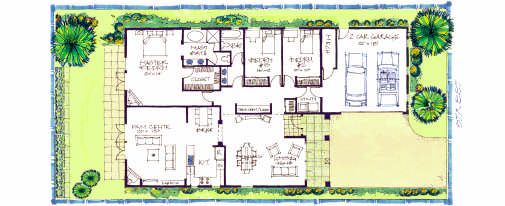
The prototype house designs, including full architectural drawings and specifications, structural designs,
and mechanical designs are available from the Davis Energy Group and Loisos+Ubbelohde. Plans need
only to be adapted to specific site and location criteria and are otherwise ready for permitting. We offer
both expertise and financial support to the builder to prepare the designs for construction, as well as
assistance in commissioning and training homeowners on operation of the house after construction.1

WHY BUILD A SUMMER PERFORMANCE HOUSE ?

* Lower energy use Between California’s energy shortages and rapidly escalating electricity costs,
homebuyers will be including energy efficiency at the top of their list of preferred amenities. Summer
Performance Houses use less energy than the average house. Depending on how they are built (for
example, with certified lumber), they can be classified as Green, creating a great marketing opportunity.
As designed they will comply with all energy codes. The prototype houses also can comply with
California state and utility programs, such as PG&E’s Comfort Home and EPA’s Energy Star. These pro-
grams deliver a marketing edge and incentives, thereby reducing their cost to the builder.

* Reduced power demand on the utilities Title 24 , our energy code, keeps home energy
consumption within reasonable limits, , but does not necessarily provide comfortable interiors during
hot summer days. As a result, air conditioning is being installed, even in houses built near the coast.
Houses with large air conditioners that are used only on the hottest days put the worst kind of stress on
the local utility. Residential air conditioning in areas of new residential growth is one of the least cost-
effective electrical loads to serve. Residential utility rates are adversely impacted by the high generation,
distribution, and transmission capacity development costs to serve summer peak loads. Managing the air
conditioning load will have far-reaching impacts on the ability of utilities to continue to serve new devel-
opments in this rapidly growing state.

* Lower risk through improved comfort and better ventilation and comfort
Solid construction coupled with well-engineered comfort systems that regularly ventilate the house with
filtered fresh outside air will reduce customer complaints about comfort, mold, and allergic reactions to
new building materials. Superior summer and winter comfort and quiet operation will convey a feeling
of quality to the buyer.

                                                                                                            2
MARKET FEATURES OF THE SUMMER PERFORMANCE HOUSES

The three houses offered in this package are designed to be attractive to California residential customers
and the building industry in terms of design features and cost. Our goal is to effect performance
improvements in the houses that are already the backbone of the residential market, not to change the
type or look of the proven house designs in the name of conserving energy. The design of these houses
offer premium amenities and features:

* A Solid House. The construction of the house feels solid. The prospective homeowner will appre-
ciate the permanent feel of the house.
* A Healthy House. In summer and winter the mechanical system ventilates the house with fil-
tered outdoor air, removing allergens, VOC’s, carbon dioxide, and household odors. In addition the fin-
ishes of the house are designed to reduce the most common sources of allergies.
* A Cool Interior. Night ventilation keeps the house cool most days, thus creating a more comfort-
able environment without the high cost of operating an air conditioner.
* A Secure House . Ventilation systems provided with these designs do not require windows to be
opened to obtain fresh air. This means owners can leave the house knowing it is secure and know they
will be returning to a well ventilated, comfortable environment.
* Sound Walls. The construction of the house will provide a quieter interior. Parents will be able to
retreat while their children enjoy their music, video games and such.
* Increased Fire Safety. The walls provide increased fire separation within the house. The walls
are built to commercial one-hour fire separation levels.
* Porches. All designs offer real porches that provide outdoor sitting areas connected to the living
room and with eyes on the street.
* Large Spaces and High Ceilings. The house designs offer large ceiling heights in the com-
mon areas with vistas creating a spacious feeling.
* Modern Large Master Bedroom Suites. All designs offer large spaces for the homeowners
and include walk in closets and large bathrooms.
* Modern Amenities. All designs have spaces for Media Centers to allow the most current home
entertainment systems.
* Fireplaces. All designs have fireplaces in the great rooms to increase the warmth and comfort of
the family center.
* Hidden Garages (in most design options). Both homeowners and local planning officials will
appreciate the lack of garage doors on the street side elevation.
                                                                                                      3
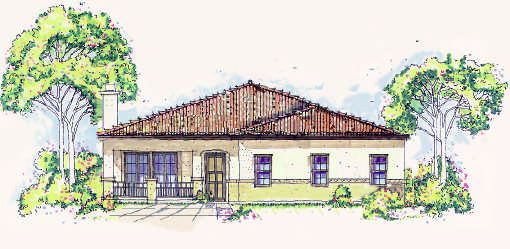
TWO-STORY SIDE COURT HOUSE
Figure 1 Street Side Elevation - Two Story House
A two story, single-family detached house on a standard size lot with 3 bedrooms, 1 bonus room (office/bed-
room), 3 bathrooms, and a three car garage.
Detached Garage Attached Garage
Lot Size (approx): ~6,000 sf ~5,000 sf
First Floor Area: 1,349 sf 1,310 sf
Second Floor Area: 1,033 sf 1,092 sf
Total: 2,382 sf 2,401 sf
Figure 2. Two Story House Street Access - Rendered plan of ground floor and site conditions
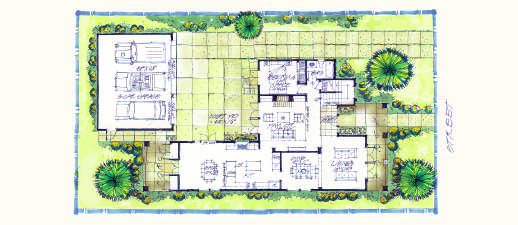
4Figure 3. Two Story House Alley Access - Rendered plan of ground floor and site conditions
• garage accessible by a driveway on the side of the house (zero lot line)
• front porch and windows onto the street bring back traditional street relationship
• front porch entry off the street into a double height entry space
• view from entry through to the shaded courtyard
• formal living room with double French doors onto a small porch
• double-height family great room with media wall, fireplace and
• kitchen with breakfast nook facing onto the shaded courtyard
• paved and shaded courtyard accessible from kitchen and great room is
• great room features media wall and fireplace
• additional room w/ bath is provided to serve as extra bedroom, office or in-law room
• upstairs laundry center
Figure 4. Two Story House - Rendered plan of upper floor
5SINGLE-STORY FORE COURT HOUSE.
Figure 5. Street Side Elevation - Single Story Forecourt House
A single story, single-family detached house on a standard size lot with 3 bedrooms, 2 bathrooms and a two car
garage accessible by a court on the front of the house.
Lot Size (approx): 5,400 sf Floor Area: 1,998 sf
• front entrance off a court serves as formal entry and driveway to the garage.
• formal living room and dining room connected to front porch
• raised sloping ceiling of the living/dining area provides expansive space view from entry to back garden
• high volume great room, kitchen and breakfast nook areas give onto back garden through French doors
• great room features fireplace and media wall
• private bedroom area separated from living room by tech center and linen closet
• tech center provides place for homework and home office activities
• double doors lead into master bedroom suite, featuring a walk-in closet, large bathroom
Figure 6. Single Story Forecourt House - Rendered plan and site conditions
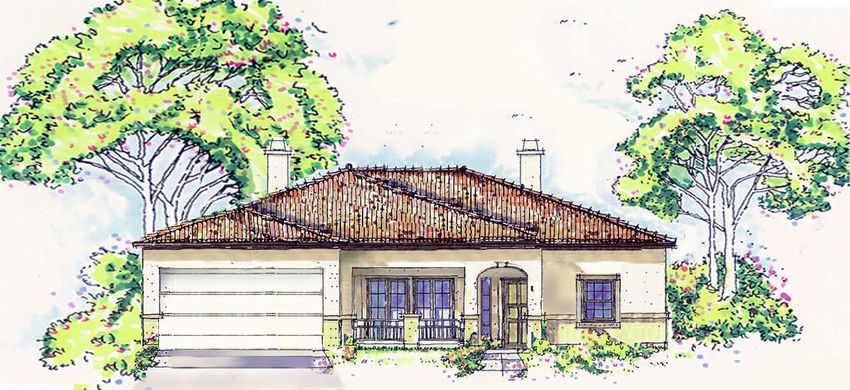
6SINGLE-STORY COMPACT HOUSE
Figure 7. Street Side Elevation - One Story House
A compact single story, single-family detached house on a standard size lot with 3 bedrooms, 2 bathrooms, a two
car garage accessible by a standard driveway on the front of the house.
Lot Size (approx): 5,400 sf Floor Area: 1,762 sf
• compact design especially appropriate for the hotter inland valley climates
• high ceilings throughout spacious and formal living/dining rooms
• long views through the house give spacious feel
• kitchen, breakfast nook and great room connect directly to the back yard through double French doors
• high volume great room creates family realm with media wall and fireplace adjacent to kitchen and nook
• master bedroom suite is separated from the children's bedrooms
Figure 8. Street Side Elevation - One Story House
7ENERGY FEATURES OF THE SUMMER PERFORMANCE HOUSES
The Summer Performance House designs rely on both construction features and the mechanical system
to provide performance and comfort. An improved building shell, thermal mass, high performance win-
dows, and an advanced mechanical system integrate to provide superior summer performance through-
out most of California.
CONSTRUCTION FEATURES
* Roof. Roof insulation is R38; truss construction accommodates higher insulation levels if desired.
Roof sheathing with a laminated reflective barrier (Louisiana Pacific TechShield) is used in warmer cli-
mates.
* Windows. The windows specified comply with the new Title 24 requirements. Their performance is
equal to or better than Milgard PPG Sungate 1000, and provide a U-value of 0.31 or lower, a Solar Heat
Gain Factor of 0.37 or lower, and a Visible transmission of 0.6 or higher.
* Shading. Traditional elements such as overhangs, porches and trellises are included in the Summer
Performance Houses. These offer both marketing and shading benefits, improving summer performance.
* Infiltration. The tightness of the building envelope is similar to a moderately tight house with a
specific leakage area (SLA) of 3.9 or less.
* Walls. House thermal mass is increased by applying 5/8" gypsum wallboard to all walls. The massive
walls absorb more heat, resulting in more moderate indoor temperatures. The heavier walls also make
the house feel more substantial, as well as improving sound insulation and fire safety. The walls are insu-
lated with R15 fiberglass batt between the 2 x 4 studs. An exterior air barrier is used to reduce infiltra-
tion. Additional insulation external to the studs such as "Tuff-R", or an insulation-based stucco lathe is
used to reduce heat conductance through studs.
* Floors. The concrete slab, which also contributes thermal mass, is covered with stone or tile to facil-
itate absorption of heat by the floor. Plans show tile floors covering 50% of the ground floor. To mini-
mize heat gain and loss with the outside slab edge insulation is specified.
8Figure 9. Typical Eave Detai
Figure 10. Typical Wall to Grade Detail
9MECHANICAL SYSTEMS.
Figure 11. Schematic of the “Smart Mechanical System”
The houses are designed to require less cooling than current production houses This allows air condi-
tioners to be smaller than typical, and means air conditioners can be eliminated in some climates.
Cooling is primarily provided using nighttime ventilation and storage of "coolth" in the building mass.
The mechanical system offers the following features:
10* Variable speed hot water furnace delivers heating efficiently and quietly
* Location of ducts inside the building envelope improves efficiency
* High recovery water heater efficiently heats the house and domestic hot water
* Outside air damper provides ventilation cooling on summer nights and fresh air in the winter
* Controls integrate all functions and predict indoor summer temperatures based on user settings
The "NightBreeze" heating-cooling-ventilation system is manufactured by Enviromaster International of
Rome, NY, and was developed with support from the California Institute for Energy Efficiency and the
California Energy Commission. The system has been thoroughly field-tested. See the NightBreeze
brochure for more details.
COMFORT ISSUES AND PERFORMANCE
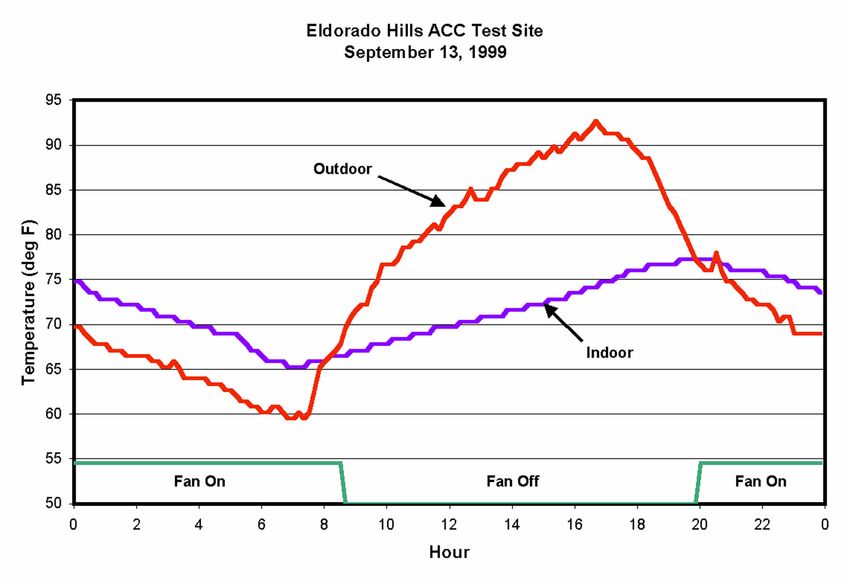
Figure 12. Monitored performance in a existing house with the prototype controller / thermostat and some of the archi-
tectural and mechanical features of the Summer Performance House
The summer comfort target recommended by the Air Conditioning Contractors of America (ACCA) man-
ual is 78 degrees plus or minus 3 degrees F. The three houses have been designed to achieve this level
of comfort or better. Additonal comfort is provided by ceiling fans located in primary rooms.
Beyond maintaining the interior temperature, Summer Performance houses will deliver more pleasing
comfort than an air-conditioned Title 24 house. Summer cooling that relies on conventional air condi-
tioning often is accompanied by much warmer temperatures on the second floor of two-story houses,
11drafts, and noise. In contrast, cool wall and floor surfaces of the Summer Performance house surround
the occupants , providing even comfort throughout the house. When the air conditioner does run there
is less noise from ducts because the air conditioner can be much smaller.
NEW THERMOSTAT
Figure 13. The new thermostat built by Z-Tech with software authored specially
for the Summer Performance House
Available thermostats are not capable of integrating ventilation cooling, heating, and air conditioning.
A collaborative of manufacturers, engineers, architects, and social scientists worked to develop a control
system that would provide this integration while effectively conveying the concepts of ventilation cooling
to the homeowner. The thermostat includes a large LCD screen that displays different information
depending on what settings are being made (heating, cooling, etc.).
The figure below shows the "Long Term" cooling settings screen, and shows how the thermostat allows
the owner to make two temperature settings for controlling ventilation cooling and air conditioning.
The "Low" setting indicated above the horizontal "comfort bar" is the lowest temperature that the house
will be cooled to by ventilation, and the "Hi" setting is the maximum desired temperature, and also the
temperature at which the air conditioner will run. The shaded portion of the bar indicates the predicted
range of indoor temperatures for the next day, and changes as the low and high temperature settings are
changed. If the shaded bar crosses the "Hi" setting, a message is displayed that indicates the "Air
Conditioner Will Run".
12Figure 14. General range of Applicability
for different Cooling Systems associated
with the Summer Comfort Houses
Programs and other Benefits
Summer Performance houses can be built to comply with Energy Star ®. To
do so the builder will have to participate in the program by signing a memo-
randum of understanding, and following a short proceedure. For more infor-
mation please visit: http://www.energystar.gov/ and navigate to the home
Using Products with the Energy Star ®
builder’s site.
label can save energy. Saving energy
reduces air polution and lowers utili- Participation in this program may qualify buyers for preferential financing and
ty bills. access to other financial incentives from local utilities such as the PG&E
Comforrt home etc.
13Inland Climate House Performance Analysis Report
Alternatives To Compressor
Cooling Project
Inland Climate House
Performance Analysis Report
PIER Contract #500-98-024
Date Completed: June 6, 2002
Presented to: Phillip Spartz
California Energy Commission
Prepared by: David Springer
Leo Rainer
Bill Dakin
Davis Energy Group June 6, 2002Inland Climate House Performance Analysis Report
1 Background and Objectives
1.1 Background
This report presents the results of work completed under Task 2.3.2 of the Public Interest
Energy Research multi-phase project titled Alternatives to Compressor Cooling (ACC).
Under a prior project task Loisos/Ubbelohde developed a house design optimized for
summer performance in California's warm inland valleys. The architectural style is in the
genre of California production homes.
A version of the DOE-2 hourly simulation model was developed in a prior project phase
and was equipped with a special function that emulates the advanced control developed
in Task 2.2 of the current phase, and used in the “NightBreeze” integrated ventilation
cooling, air conditioning, and heating system developed under this project. This model
was previously employed to optimize ventilation cooling control parameters.
The work described in this report builds on the prior work, applying the summer
performance house design, ventilation cooling control functions, fan energy use
characteristics, and specialized simulation model, to estimate potential energy savings,
peak demand reduction, and economics of ventilation cooling.
1.2 Objectives
The objective of this work task is to determine how well the inland climate house and
integrated ventilation cooling system performs in various California climate zones.
Specific performance objectives include the determination of:
• Air conditioner sizing reduction potential
• Predicted energy use and demand
• Predicted energy savings and demand reduction
A secondary objective of this task is to determine the relative contributions of building
envelope improvements and ventilation cooling to peak demand reduction and air
conditioner sizing, and to energy savings.
Results of this task test the original premise of the Alternatives to Compressor Cooling
Project that air conditioning in coastal transition zones can be eliminated by combining
house design features with ventilation cooling. Final evidence that air conditioning can
be eliminated must be obtained through actual installations and surveys.
2 Methods
2.1 Approach
Performance was analyzed using two models of the Inland Valley House1: the house as
designed, and a model that represents the baseline condition. These two models were
simulated using DOE-2 to separately identify incremental improvements due to the
envelope design and night ventilation cooling. Simulation results were compared to
determine energy savings and improvement in demand. Since natural ventilation
assumptions used in the baseline model affect performance comparisons, two baseline
1
Developed previously under Task 2.3.
Davis Energy Group Page 1 June 6, 2002Inland Climate House Performance Analysis Report ventilation case were evaluated. Although the advanced control includes variable volume heating and fresh air ventilation functions, this analysis focused on summer performance. 2.2 DOE-2 Model A version of the DOE-2 hourly simulation model was developed under Task 2.2 of the current project phase that uses a function that includes the same control algorithms that were developed for the advanced control. In cooling mode these algorithms vary the volume of ventilation air and the indoor low limit temperature for ventilation cooling as a function of current weather conditions. The model also includes control functions for heating and air conditioning. In heating mode the algorithms vary the air volume as a function of indoor temperature and thermostat setting. The control function in the model also has the capability to simulate fan energy consumption for fresh air ventilation, but this function was disabled2. Also in Task 2.2 optimal values for certain control parameters (such as ventilation cooling airflow rate) were determined. 2.3 House Models The Inland Valley House designed by Loisos/Ubbelohde under Task 2.3 of this project was also used in simulations to optimize control functions. The 1860 ft² one story house incorporates several features to improve summer performance, including 50% of slab floor exposed (tiled) and 5/8” drywall for added thermal mass, slab perimeter insulation, radiant barrier roof sheathing, high performance windows, and exterior window shading. All analyses were completed using the worst-performing orientation (front facing west)3. A baseline house design was needed to assess the contribution of the building envelope characteristics (thermal mass, shading, etc.) to the improvement in performance. This baseline model was developed by applying prescriptive Title 244 design features to the Inland Valley House. The primary differences between the original Inland Valley House and the prescriptive house designs are overhang length (the Inland House design included 36” overhangs whereas the Title 24 design used 12” overhangs), and thermal mass (the Inland House includes 50% exposed floor mass and 5/8” instead of ½” drywall). Simulations assumed that the mechanical system was the only source of ventilation (no window operation), since DOE-2 cannot model fan and stack/wind-driven ventilation concurrently. Both the baseline house and the Inland Valley House design were modeled with 10 SEER air conditioners. The same equation for fan energy use was used for both cases, implying that the baseline cooling system includes a high efficiency (ECM) fan. 2.4 Ventilation Assumptions The greatest complication in determining the reduction in energy use stemming from mechanical night ventilation cooling is in determining what natural ventilation baseline 2 Since the baseline house does not include fresh air ventilation, none was assumed in the Inland Valley House model. 3 The house was designed to perform similarly in all orientations. Building performance for the Inland Valley House does not vary significantly with orientation due to window placement and overhangs. 4 California Energy Commission 2001 Residential Building Standards Davis Energy Group Page 2 June 6, 2002
Inland Climate House Performance Analysis Report

                                                    assumptions should be used. If the assumption is that windows are used liberally for
                                                    natural ventilation, energy savings predictions will be lower than if windows are kept
                                                    continuously closed5. For this reason, two alternatives were simulated for the baseline
                                                    house. One assumed that windows were not opened at all (no natural ventilation), and
                                                    the other assumed that windows were open whenever outdoor temperatures were lower
                                                    than indoor temperatures, but closed between the hours of 11 PM to 6 AM6. For the
                                                    latter case it was assumed that the inlet and outlet areas were each 2.5% of the total
                                                    window area. This is half the window area assumed by the California energy standards.
                                                    These assumptions are justified by Figure 1, which compares monitored indoor-outdoor
                                                    temperature differences for nine monitored sites with no mechanical ventilation and one
                                                    site with mechanical ventilation cooling, to temperature differences obtained from DOE-
                                                    2 simulations7.

                                                    Figure 1: Comparison of Indoor-Outdoor Temperature Differences from
                                                    Monitored Houses and DOE-2 Simulations
                                               20
                                                                                                                                             DOE2 No Vent
                                               18                                                                                            DOE2 Nat. Vent 5%
                                                                                                                                             DOE2 Nat. Vent 2.5%
                                               16
Indoor to Outdoor Temperature Difference (F)

                                                                                                                                             DOE2 Mech Vent
                                                                                                                                             Mech Vent Monitored
                                               14                                                                                            Nat Vent Monitored

                                               12

                                               10

                                                8

                                                6

                                                4

                                                2

                                                0
                                                    60        61         62        63         64        65         66        67         68            69           70
                                                                                            Outdoor Temperature (deg F)

                                                    5
                                                      See the Human Comfort Field Studies Report for a survey of window use.
                                                    6
                                                      This schedule is consistent with proposed Title 24 Residential Standards modifications for 2005.
                                                    Currently, California standards assume that windows are open throughout the night.
                                                    7
                                                      Curves were developed by fitting linear regression lines to monitored and simulated temperature data for
                                                    the months of June through September. Monitored natural vent sites (9) were from PG&E and SMUD heat
                                                    pump studies. The monitored mechanical vent data is a two-year average of data from a Winters, CA
                                                    house with a prototype NightBreeze system. Regression coefficients from the monitored sites were
                                                    averaged.

                                                    Davis Energy Group                               Page 3                                         June 6, 2002
Inland Climate House Performance Analysis Report Referring to Figure 1, more effective ventilation would result in lower indoor-outdoor temperature differences. Monitored temperature differences were much higher than simulated temperature differences using the proposed Title 24 standard assumptions (5% vent area), suggesting the proposed assumptions overestimate ventilation. Simulations also showed that 5% vent area achieves more ventilation cooling than mechanical ventilation, indicating that the effect of natural ventilation is overestimated. Lowering the vent area to 2.5% brought the monitored and simulated curves to within 0-1°F of each other. Monitored and simulated mechanical vent curves are also very close, but have different slopes. Consistent with results from control parameter optimization studies, the maximum ventilation cooling rate for the mechanical ventilation case was fixed at 1147 CFM. The control algorithm varies this ventilation rate with changing weather conditions using the predictive functions described in the Advanced Control Functional Specification. DOE-2 cannot model fan driven and natural (stack effect and wind-driven) ventilation concurrently. Therefore, no natural ventilation is included in the mechanical ventilation simulations, causing energy use predictions to be somewhat higher than reality for the mechanical ventilation cases. Figure 1 illustrates the significant impact that window- opening area has on ventilation cooling effectiveness. 2.5 Temperature Settings Air conditioning thermostat settings for both the baseline and mechanical ventilation cases were 80°F8. A 65°F low limit setting was used for the mechanical ventilation cases. Control algorithms adjust the ventilation cooling "target temperature" upward from the low limit setting during mild weather. 2.6 Climate Zones Analysis was completed in each of six climate zones, including Zone 4 (Sunnyvale), Zone 6 (Long Beach), Zone 10 (Riverside), Zone 12 (Sacramento), and Zone 13 (Fresno), and Zone 14 (China Lake). Zones 4 and 6 offer potential for the elimination of compressor cooling, consistent with the ideal project goal. 2.7 Modeling and Data Analysis Simulations were completed for each of the six climate zones and five cases (baseline without natural vent, baseline with natural vent, Inland Valley House with and without natural vent, and Inland Valley House with mechanical ventilation). Simulations included winter heating and summer cooling electrical energy use for fans, compressors, and pumps9. Gas consumption for winter heating is approximately equivalent for all cases. Electrical energy use was compared to obtain demand reduction and energy savings. In addition, effective seasonal efficiencies were calculated for the ventilation cooling cases by dividing the computed cooling load by the total ventilation and air conditioning energy use. 8 An 80°F setting is likely to provide adequate comfort when ceiling fans are used and results in conservative estimates of energy savings. 9 The integrated ventilation cooling & heating system employs a pump to circulate hot water from the water heater to the air handler coil. Davis Energy Group Page 4 June 6, 2002
Inland Climate House Performance Analysis Report

3 Results
3.1 Demand Reduction
Table 1 shows the estimated peak cooling demand for the five cases by climate zone and
includes both ventilation fan power and air conditioning compressor power. Figures 2
and 3 show the reduction in cooling peak demand in the six climate zones evaluated.
Results in Figure 2 assume no natural ventilation is applied (windows closed); Figure 3
results apply natural ventilation as described in Section 2.4. The lower section of the bars
represents the demand reduction resulting from building envelope improvements between
the Title 24 baseline and “summer performance” versions of the Inland Valley House.
The upper section of the bars indicates demand reduction resulting from the addition of
night ventilation cooling to the Inland Valley House design.

The percentage reduction in peak demand is nearly identical for the “no ventilation” and
“natural ventilation” cases. The probable explanation for this result is that natural
ventilation provides little or no benefit on the hottest days. Table 1 further illustrates this
fact. There is little demand reduction between natural ventilation and no natural
ventilation.

                         Table 1: Simulated Peak Demand (kW)

                   No Natural Vent With Natural Vent                Inland House
                            Inland          Inland                   with Mech
          Location Baseline House Baseline House                     Ventilation
          CZ04       1.9      1.2    1.8      1.1                        0.3
          CZ06       2.8      1.0    2.6      0.9                        0.2
          CZ10       2.7      1.8    2.7      1.9                        1.5
          CZ12       3.1      2.0    3.0      2.1                        1.6
          CZ13       3.3      2.3    3.3      2.4                        1.8
          CZ14       3.1      2.3    3.1      2.3                        2.2

                     Figure 2: Dem and Reduction, No Natural Vent
          100%
           90%
           80%
           70%
           60%                                                               Vent
           50%
           40%                                                               Envelope
           30%
           20%
           10%
            0%
                     CZ04    CZ06     CZ10     CZ12    CZ13     CZ14

Davis Energy Group                           Page 5                                 June 6, 2002
Inland Climate House Performance Analysis Report
Figure 3: Dem and Reduction, w ith Natural Vent
100%
90%
80%
70%
60% Vent
50%
40% Envelope
30%
20%
10%
0%
CZ04 CZ06 CZ10 CZ12 CZ13 CZ14
Table 2 shows the air conditioner downsizing opportunities by going from the Title-24
baseline house to the Inland Valley House and due to mechanical ventilation. The DOE-2
model was set up initially to auto-size the equipment. The capacity reduction between the
baseline house and the Inland Valley House was determined by comparing the DOE-2
sizing for each run and rounding up to the nearest nominal AC size. Because ventilation
contributions are not accounted for in DOE-2’s AC sizing, manual AC sizing was used in
the input files to determine the capacity reduction due to mechanical ventilation. Air
conditioner sizing was reduced in the mechanical ventilation runs as low as possible
while still maintaining the same level of comfort in the zones10. As Table 2 indicates,
mechanical ventilation on the Inland Valley House can eliminate air conditioning in
Climate Zones 4 and 6 and reduce AC sizing by 20 to 50% in the other climate zones.
Table 2: Air Conditioner Size (kBtuh)
Inland House
Inland With Mech
Location Baseline House Ventilation
CZ04 24 18 -
CZ06 30 18 -
CZ10 30 24 18
CZ12 30 24 18
CZ13 36 24 18
CZ14 30 24 24
10
To ensure that the air conditioners were still adequately sized, the DOE-2 outputs were used to ensure
that the number of “under-cooled” hours and the maximum zone temperatures did not change when
reducing capacity.
Davis Energy Group Page 6 June 6, 2002Inland Climate House Performance Analysis Report
3.2 Energy Savings
Table 3 lists energy use for each of the analysis cases. Figures 4 and 5 graph the total
electrical energy savings resulting from summer ventilation cooling and winter variable
speed fan operation, as predicted by the DOE-2 model. Similar to Figures 2 and 3, the
bottom portion of the bars represents building envelope savings and the top portion the
added increment of energy savings resulting from mechanical ventilation.
The summer performance house design has the greatest percentage impact in Climate
Zones 4 and 6, where natural ventilation provides sufficient savings to make the addition
of mechanical ventilation unnecessary. As shown in Table 3, mechanical ventilation
results in greater energy use in these coastal climates if windows are used to provide for
natural ventilation11. Mechanical ventilation has more significant value in the inland
climate zones, when natural ventilation is used.
Table 3: Simulated Energy Use, kWh per year
No Natural Vent With Natural Vent
Inland Inland Inland House
Location Baseline House Baseline House w/ Mech Vent
CZ04 632 347 233 94 120
CZ06 1,519 187 336 22 96
CZ10 1,702 1,219 1,273 952 603
CZ12 1,547 936 1,001 510 417
CZ13 2,635 2,095 2,258 1,778 1,370
CZ14 2,306 1,790 1,933 1,502 1,249
Figure 4: Energy Savings, No Natural Vent
100%
90%
80%
70%
60% Vent
50%
40% Envelope
30%
20%
10%
0%
CZ04 CZ06 CZ10 CZ12 CZ13 CZ14
11
Since DOE-2 does not allow natural and mechanical ventilation to be used together, the negative value of
mechanical ventilation is probably inaccurate.
Davis Energy Group Page 7 June 6, 2002Inland Climate House Performance Analysis Report
Figure 5: Energy Savings, w ith Natural Vent
100%
90%
80%
70%
60%
Vent
50%
40% Envelope
30%
20%
10%
0%
CZ04 CZ06 CZ10 CZ12 CZ13 CZ14
Ventilation cooling fan operation expends energy while displacing air conditioner
compressor energy. This tradeoff is shown in Figures 6 and 7, which plot only fan and
compressor energy savings resulting from the application of mechanical ventilation to the
Inland Valley House design with no natural ventilation, and with natural ventilation
enabled. The values above the bars are net energy savings in percent. The low Zone 12
energy savings for the natural ventilation case shows how effective natural ventilation is
in that climate zone. Figure 7 also shows again that no energy savings occur from
mechanical ventilation in the coastal climate zones (4 and 6) if natural ventilation is used.
Mechanical ventilation will likely provide improved comfort and control over natural
ventilation.
Figure 6: Cooling Energy Savings
vs. no natural ventilation case
1000
Savings, kWh per year
800 34%
51%
57% 30%
600
400 71%
50%
200
0
CZ04 CZ06 CZ10 CZ12 CZ13 CZ14
-200
CZ0
CZ04 CZ0
CZ06 CZ1
CZ10 CZ1
CZ12 CZ1
CZ13 CZ1
CZ14
Cooling Energy Fan Energy Net Energy Savings
Davis Energy Group Page 8 June 6, 2002Inland Climate House Performance Analysis Report
Figure 7: Cooling Energy Savings
vs. natural ventilation case
1000
Savings, kWh per year
800
600
36% 22%
400
15%
13%
200 0% 0%
0
CZ04 CZ06 CZ10 CZ12 CZ13 CZ14
-200
CZ0
CZ04 CZ0
CZ06 CZ1
CZ10 CZ1
CZ12 CZ1
CZ13 CZ1
CZ14
Cooling Energy Fan Energy Total Energy Savings
The use of a hot water fan coil (air handler) instead of a furnace allows a fully variable
speed fan to be employed that, under low heating loads, can operate at airflow rates as
low as 200 CFM. The variable speed ECM fan motor that is used in the air handler is
also more efficient than permanent split capacitor motors typically used in medium
efficiency furnaces. Simulation results indicated that winter fan energy savings
attributable to variable speed operation ranged from a low of 15 kWh in Zone 6 to a high
of 69 kWh in Zone 12. Winter fan energy savings were 76 to 77% in all climate zones.
3.3 Seasonal Efficiency Improvements
Another way to evaluate the efficiency of mechanical ventilation cooling is to calculate
an effective seasonal efficiency by dividing the seasonal cooling load by the sum of
ventilation fan energy and cooling system energy. These “Seasonal Efficiency” values
are displayed in Table 4. Cooling system energy use was based on the performance
curves for a 10 SEER air conditioner, so these values represent an improvement over 10
SEER. They were also calculated relative to the “no natural ventilation” baseline case.
These results show that the added thermal mass and other features of the Inland Valley
House design clearly work to improve the effectiveness of mechanical ventilation
cooling. The high Seasonal Efficiency values for Climate Zone 4 are representative of
the performance of the ventilation system only since no air conditioning operation was
needed.
Davis Energy Group Page 9 June 6, 2002Inland Climate House Performance Analysis Report
Table 4: Effective Seasonal Efficiency of Mechanical Ventilation Cooling
Location Title 24 House Inland House
CZ04 21.3 34.3
CZ06 17.7 19.9
CZ10 15.6 20.3
CZ12 15.9 23.3
CZ13 12.6 15.2
CZ14 13.0 14.2
3.4 Economic Analysis
Costs for both the baseline AC/furnace and a “NightBreeze” system were used to
evaluate cost effectiveness of the “NightBreeze” system in two representative climate
zones (CZ04 and CZ12). Table 5 summarizes the results. Because the “NightBreeze”
system provides ventilation air, an outside air ventilation system (utilizing the furnace
fan) was included in the basecase system costs12. Operational costs for both cases assume
the Inland Valley House, and the baseline case assumes no natural ventilation cooling.
Current average residential electric rates for California ($0.13/kWh) were used to
estimate annual energy savings. In milder climates, where there is an opportunity to
eliminate the need for an air conditioner, the incremental cost for a “NightBreeze” system
is less than the basecase. In hotter climates, there are air conditioner downsizing
opportunities but the incremental cost for the “NightBreeze” system is still higher.
Table 5: “NightBreeze” Economics
Location Baseline NightBreeze Incremental Annual Simple
System System Cost Cost Savings Payback
Cost ($/yr) (yrs)
CZ04 $3,234 $3,046 -$188 $30 $92 (NPV)
CZ12 $3,369 $4,008 $640 $68 9.5
4 Conclusions & Recommendations
- Simulations showed potential for downsizing air conditioners by up to 1½ tons and
reducing peak load by up to 2.6 kW.
- Simulations showed overall annual energy savings of 113 to 1,422 kWh depending
climate zone and natural vent use.
- The results revealed synergies between house design features and ventilation cooling.
Vent cooling works best with a well-designed house (increased amounts of exposed
12
No additional fan energy was assumed for ventilation in the base case.
Davis Energy Group Page 10 June 6, 2002Inland Climate House Performance Analysis Report
mass and reduced solar gain), allowing for opportunities to eliminate air conditioning
in transition zones.
- Vent cooling savings are dependent on how homeowner uses windows for natural
ventilation. While proper use of windows for ventilation in milder climates can
eliminate air conditioner use in a well-designed house, window use cannot do the job
in warmer climates or in milder climates without proper house design.
Paybacks at current flat rates are not particularly attractive; would be better under time-
of-use rates. To facilitate optimal user settings of ventilation airflow rate, a simple
multiplier to determine ventilation rate from house floor area is suggested. Using the
results from this report, this value should be 0.6 CFM per square foot in all climate zones.
A value of 0.4 CFM per square foot could be applied in Climate Zone 4 if air
conditioning is installed.
Davis Energy Group Page 11 June 6, 2002You can also read