Modelling of Wastewater Heat Recovery Heat Pump Systems - SDEWES
←
→
Page content transcription
If your browser does not render page correctly, please read the page content below
ISSN 1848-9257

                       Journal of Sustainable Development of Energy, Water                            Journal of Sustainable Development
                                                                                                       of Energy, Water and Environment
                                                                                                                                  Systems

                                     and Environment Systems

                                         http://www.sdewes.org/jsdewes
                                                                                                   http://www.sdewes.org/jsdewes

                                        Year 2021, Volume 9, Issue 1, 1080330

          Modelling of Wastewater Heat Recovery Heat Pump Systems

                                 Nicholas R. Smith*1, Gregor P. Henze2
 1
   Department of Civil, Environmental and Architectural Engineering, University of Colorado-Boulder,
                                      Boulder, CO 80309, USA
                                e-mail: nicholas.r.smith@colorado.edu
 2
   Department of Civil, Environmental and Architectural Engineering, University of Colorado-Boulder,
                                 UCB 428, Boulder, CO 80309, USA
                  National Renewable Energy Laboratory, Golden, CO 80401, USA
                                   e-mail: gregor.henze@nrel.gov

 Cite as: Smith, N. R., Henze, G. P., Modelling of Wastewater Heat Recovery Heat Pump Systems, J. sustain. dev.
          energy water environ. syst., 9(1), 1080330, 2021, DOI: https://doi.org/10.13044/j.sdewes.d8.0330

ABSTRACT
          Wastewater heat recovery is currently an underutilized technology that could be part of
          solving the climate crisis. A large portion of the heat that leaves a building in the form of
          wastewater is potentially recoverable for pre-heating domestic hot water or other service
          water systems. While there are several different approaches to wastewater heat recovery,
          this project focused on creating detailed, integrated building models for wastewater heat
          recovery heat pump systems. EnergyPlus models were developed featuring inputs and
          assumptions corresponding to manufacturers’ specifications, performance lab test data
          and feedback from engineering consultants. EnergyPlus’s supervisory control Energy
          Management System objects were heavily relied upon to overcome modelling
          challenges. The developed EnergyPlus model was integrated into U.S. Department of
          Energy New Construction Reference Building models for various climate zones and
          building types to assess potential energy use, energy cost and greenhouse gas
          emission reductions.

KEYWORDS
          Wastewater heat recovery, Heat pump, Modelling, EnergyPlus.

INTRODUCTION
    In October of 2018, the Intergovernmental Panel on Climate Change (IPCC) issued a
dire warning to the world. If global warming is not limited to 1.5 °C relative to
pre-Industrial Revolution levels, the effects to human and natural systems could be
“irreversible” [1]. The IPCC report details that preventing global temperature increases
above 1.5 °C will require “rapid and far-reaching” transitions in energy, industry, buildings
and cities [1]. For this reason, engineers, scientists and policy makers are researching and
analysing a plethora of solutions to reduce Greenhouse Gas (GHG) emissions.
    One technology that is vastly underutilized in the building sector is Wastewater Heat
Recovery (WWHR). WWHR has been the subject of a great deal of enthusiasm and study
over the past several years. The River Network, a Colorado based environmental
advocacy organization, estimated that 383 GWh of energy were used for water heating in

     *
         Corresponding author

                                                         1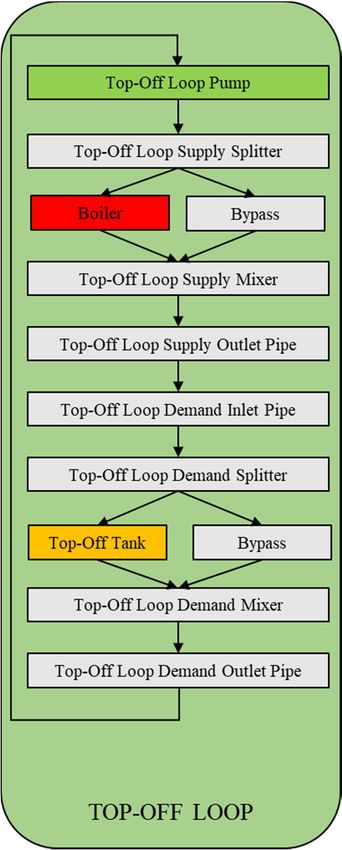
Smith, N. R., Henze, G. P.                                                                    Year 2021
 Modelling of Wastewater Heat Recovery ...                                    Volume 9, Issue 1, 1080330
the United States in 2005. It was also estimated that 204.9 million metric tons of carbon
emissions were released associated with water heating [2].
    Similarly, the U.S. Department of Energy (DOE) estimates that 350 GWh of hot
water is lost to drains annually in the United States [3]. To put this last estimate in
perspective, 350 billion kWh is roughly the amount of energy required to heat 7,088,000
Olympic-sized swimming pools from 10 °C to 27 °C. A large portion of the heat that
leaves a building in the form of wastewater is potentially recoverable for pre-heating
Domestic Hot Water (DHW) or other service water systems. While several drain water
heat recovery technologies exist, this project focused on a wastewater heat recovery heat
pump (WWHR-HP) system developed by a Canadian company. This WWHR-HP unit
operates at the building level and is typically installed in facilities with large DHW usage
rates, such as apartment buildings and hotels.
    There were two main objectives for this research project. The first was to create a
high-fidelity model of a WWHR-HP system using EnergyPlus (E+). Model fidelity is a
measure of a computer models’ ability to replicate reality. One potential factor in the
current underutilization of this technology is the difficulty that stakeholders have in
accurately predicting potential energy and energy cost savings for customers and/or
financiers. By developing and demonstrating the value of high-fidelity WWHR models,
practitioners will be more likely to include WWHR in early design sustainability
charrettes. The second objective was to assess building types and climates that might be
conducive to WWHR for DHW heating. The Department of Energy EnergyPlus
Reference Building Model library was used to conduct feasibility assessments and
allowed for heuristics to be developed as to what inputs are most critical to the economic
and environmental viability of WWHR systems.
    Prior to this project, no detailed, integrated building EnergyPlus model of a
WWHR-HP system was known to exist. This conclusion was drawn following a
literature review. It was hypothesized that a high-fidelity integrated building model could
be developed and used to identify the potential climates and building types most well
suited for WWHR from an economic and environmental perspective.

 Literature review
    In order to better understand the current state of the industry and establish the present
gaps in academic knowledge, a literature review was conducted. Specifically, publications
sought for review were those focusing on WWHR systems using heat pumps, raw sewage,
EnergyPlus and operating at the building level rather than at the district level. Ultimately, a
great deal of insight was gained from the wide variety of publications reviewed.
    Ni et al. [4] investigated a novel residential grey water energy-recovery system using
heat pumps and EnergyPlus. However, the heat pump studied was an air source heat
pump and EnergyPlus was used exclusively to estimate building heating and cooling
loads. A numerical model was used to estimate energy impacts in various residential
home settings. This study did not feature a water source heat pump fully integrated into
the building model like that proposed for this project.
    Hepbasli et al. [5] provided a comprehensive review of wastewater heat pump system
publications from across the globe as recent as 2014. The authors reviewed 33+
publications and summarized each source’s methods, analysis types (energy, exergy,
economic, environmental) and main conclusions. Only one of the 33+ studies explicitly
used EnergyPlus for modelling. That study was the previously mentioned residential grey
water energy-recovery system authored by Ni et al. [4].
    Kahraman and Alaeddin [6] used an experimental setup like the one analysed in this
study. The experimental data obtained from their measurements showed a mean
uncertainty value of ±2.47% for the measurement parameters. The authors reported that

Journal of Sustainable Development of Energy, Water and Environment Systems                                2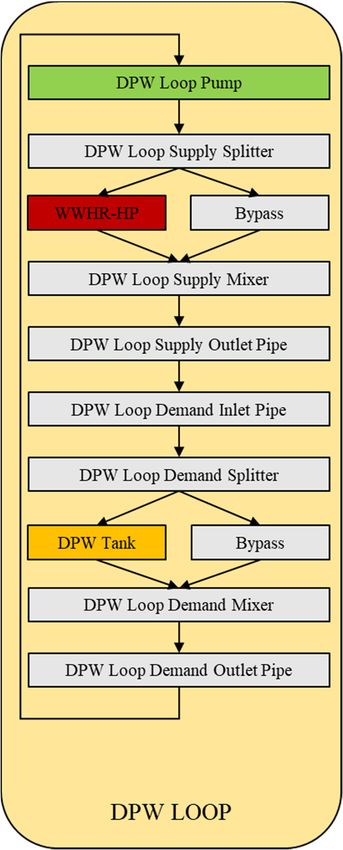
Smith, N. R., Henze, G. P.                                                                               Year 2021
    Modelling of Wastewater Heat Recovery ...                                               Volume 9, Issue 1, 1080330

the heating Coefficient of Performance (COP) values were 3.36, 3.43 and 3.69 at the
wastewater temperatures of 20 °C, 30 °C and 40 °C, respectively. It was also found that
the maximum temperature in the energy storage tank was 50.6 °C. These insights served
as good benchmarks for the computational models created for this project. It should be
reiterated that while the wastewater heat pump setup was similar, no holistic building
energy model was created that could be used in energy simulations.
    Chao et al. [7] analysed the field performance of a WWHR-HP installed at a spa in
Shenzhen, China. The authors pointed out that the volume, temperature and cleanliness
of bath water captured at the building level is very different from wastewater at the
district treatment plant level. The system evaluated by the author is very similar to the
system that was analysed for this project, except for the type of heat pump heat exchanger
and the cleanliness of the heat source water. The data collected found that higher
wastewater temperatures correlated to higher COPs. Higher wastewater temperatures led
to higher refrigerant temperatures at the evaporator inlet (17.9 °C, 16.6 °C, 14.8 °C) and
led to COPs of 3.38, 3.01, 2.87, respectively.
    Culha et al. [8] conducted a review of many wastewater heat pump/heat exchanger
publications. Swiss researchers reported that more than 15% of the thermal energy
supplied to buildings was lost through the sewer system. The review separated systems
and equipment studied into broad classifications. According to these classifications, the
WWHR-HP system investigated for this project is a “monovalent, domestic usage system
with a shell-tube wastewater heat exchanger.” Of the 27+ papers that were reviewed,
none were categorized as a shell-tube wastewater heat exchanger used in a domestic
setting and none explicitly were noted as having created integrated holistic building
models using EnergyPlus.
    The 2017 publication by Zhang et al. [9] investigated the performance of an installed
sewage source heat pump system in China. Located within a 15,000 m2 hotel, the average
COP of the heat pump was found to be 6.0 and the average COP of the overall heat pump
system was found to be 3.9. The heat pump was used sewer water as a heat source and
sink in order to meet both building heating and cooling loads. The payback period of the
system was found to be 4.7 years. Two-thirds of the power consumed by the system was
used by the heat pump, while the remaining one-third was used by the system pumps.
This led to the recommendation that variable frequency drive pumps should be used to
adjust to varying load conditions, resulting in energy and maintenance savings.
The sewage inlet temperature correlated nearly linearly and was directly proportional to
the COP of the heat pump.
    Spriet and Henrick [10] investigated WWHR using heat pumps and sewer integrated
heat exchangers in downtown Brussels, Belgium. The heat pumps used in the study
featured a COP between 3.7 and 5.0 and the sewer wastewater temperature fluctuated
between 8 °C and 16 °C when measured between December and April. Monte Carlo
simulations were used to predict the levelized cost of energy and total equivalent
warming impact. The WWHR-HP system reduced the total equivalent warming impact
by 49% compared to a natural gas water heater, but also had a greater levelized cost of
energy, except for high heating demand buildings.
    In the publications reviewed, none of the research involved constructing a building
integrated EnergyPlus model for a WWHR-HP system. Thus, the opportunity was
available to test the hypothesis that such a model could be constructed.

 Wastewater Heat Recovery Heat Pump background
    Because WWHR using heat pumps is relatively new and with few installed instances
at the onset of this project, a deeper dive into the physical components of the WWHR-HP
and overall DHW production system is provided. The Canadian manufacturer of the

3                                               Journal of Sustainable Development of Energy, Water and Environment Systems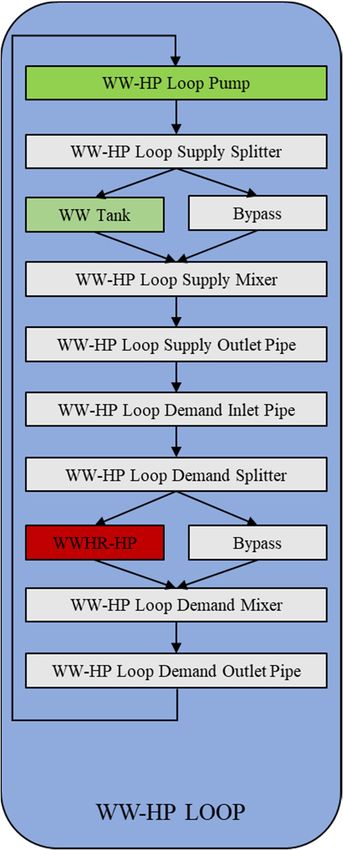
Smith, N. R., Henze, G. P.                                                                                              Year 2021
 Modelling of Wastewater Heat Recovery ...                                                              Volume 9, Issue 1, 1080330

WWHR system that was analysed describes it as a self-contained thermal energy
recovery system that is designed to produce DHW at high efficiencies [11]. The system
heating capacity is available in several different sizes including 35,170 W
(10 refrigeration tons, i.e., the T-10 unit), which was the unit used during lab performance
testing. Table 1 displays greater detail about the T-10 unit.

                                                   Table 1. WWHR-HP T-10 specifications

  Cabinet volume                          Approximate         Wastewater Refrigeration Refrigerant Domestic water
       [m3]                                mass [kg]          content [L]  type [-]    charge [kg] flow rate [L/s]
       2.26                                  517                1,303       R134a          9.1          1.51

 Lab test performance data
    The T-10 unit manufacturer contracted an independent 3rd party to conduct
performance testing on the WWHR-HP [12]. The testing involved supplying a constant
wastewater temperature to the evaporator side of the heat pump and measuring the
condenser side water heat transfer. The condenser and evaporator water flow rates were
held constant. Five different constant wastewater temperatures were tested: 18 °C, 21 °C,
24 °C, 27 °C, 30 °C. The condenser water temperature was free to increase during testing.
This water was circulated between the plate-frame condenser and a nearby tank. The heat
pump COP was calculated as seen in eq. (1) [12]:

                                                   Condenser water heat transfer rate [W]
                                          COP =
                                                          Heat pump power [W]
                                                                                                                               (1)

   Figure 1 displays the results from the five performance tests. As the difference
between the wastewater temperature and the condenser water temperature increased,
more work was required by the heat pump, which led to a decay in the heat pump COP.

                                                  Lab test performance at specified wastewater temperatures
                               8,0
                                                                                                               18 ºC
                               7,0
                                                                                                               21 ºC

                                                                                                               24 ºC
             WWHR-HP COP [-]

                               6,0
                                                                                                               27 ºC

                               5,0                                                                             30 ºC

                               4,0

                               3,0

                               2,0
                                     25      30       35      40       45         50        55            60           65
                                                    WWHR-HP condenser water outlet temperature [°C]

                                                     Figure 1. WWHR-HP lab test results

 Typical Domestic Hot Water production system
    The WWHR-HP unit is one of five components found in a typical DHW production
system. The other components are: Domestic Pre-heated Water (DPW tank) storage tanks,

Journal of Sustainable Development of Energy, Water and Environment Systems                                                          4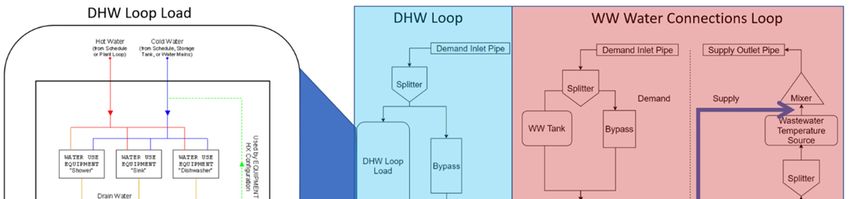
Smith, N. R., Henze, G. P.                                                                               Year 2021
    Modelling of Wastewater Heat Recovery ...                                               Volume 9, Issue 1, 1080330
Wastewater storage tank (WW tank), Top-Off storage tanks (Top-Off tank) and Top-Off
boilers. Figure 2 shows how a typical system might be connected.

                                                                WWHR-HP

                          Figure 2. Typical setup of a WWHR-HP DHW system

    Domestic pre-heated water tanks. The first stop for domestic water entering the
system is the DPW tanks. Cold water from a well or city water main enters the bottom of
the tank(s) and rises as it is heated. The EnergyPlus models assumed the tank(s) were
fully mixed. This is likely a conservative assumption since most designs prefer water
tank stratification so that the warmest water (closest to setpoint) can be drawn from the
top of the tank. Water from the top of the DPW tanks then travels to the Top-Off tanks.
Water is also circulated between the tanks and the WWHR-HP unit in order to heat
the water.

    Wastewater storage tank. According to the manufacturer, it is recommended that a
3,785 L tank be installed in conjunction with the T-10 unit. This storage tank (WW tank)
receives wastewater from the building and holds it until it is drawn to the WWHR-HP
unit or it overflows to the main sewer. The WW tank is sized large enough to fill the
WWHR-HP internal heat exchanger tank and still have reserve wastewater available, as
well as provide a large enough heat reservoir for the system. A solids-handling pump is
installed at the bottom of the collection pit and uses float valves to control wastewater
flow to the WWHR-HP.

   Top-off tanks. The Top-Off tanks receive water from the DPW tanks and are
connected to boilers to heat the water to a desired setpoint temperature. Similar to the
DPW tanks, the tanks are assumed to be fully mixed. Building flow fixtures draw water
from the tanks as it is demanded.

    Boilers. The purpose of the boilers is to ensure that the DHW supplied to fixtures
meets the temperature setpoint. While the WWHR-HP unit is capable of meeting a
majority of a building’s water heating load, varying wastewater temperatures, water
consumption rates and other conditions require a supplemental heating system. Typically,
the boilers are natural gas fired and heat the water to a minimum of 60 °C in commercial
buildings in order to prevent water-borne diseases.

5                                               Journal of Sustainable Development of Energy, Water and Environment Systems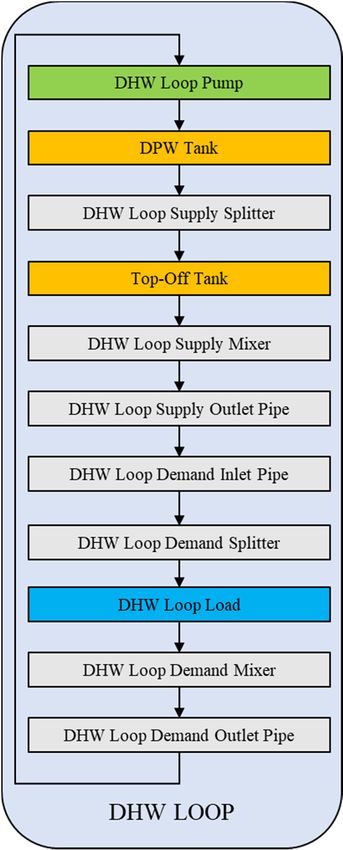
Smith, N. R., Henze, G. P.                                                                    Year 2021
 Modelling of Wastewater Heat Recovery ...                                    Volume 9, Issue 1, 1080330

METHODS
    All models were simulated using EnergyPlus version 8.8. EnergyPlus is an open
source, holistic building simulation tool that features hundreds of pre-defined objects that
can be used in sub-hourly energy calculations. The Input Data File (IDF) is where a user
adds, deletes and connects the pre-defined objects. Development of E+ began in 1997 and
over USD 80 million has been invested to date to make EnergyPlus as accurate, flexible
and robust as possible for its approximately 43,000+ users [13]. E+ is an integrated
simulation engine that solves thermodynamic state equations simultaneously rather than
sequentially as with legacy software such as DOE-2 [14] (p 25). When a simulation is run,
E+ calls upon modules to do calculations and pass outputs to other parts of the program.
Branches, nodes and loops are used in energy and mass balance calculations.
    Model inputs were based upon manufacturer provided drawings, references and other
materials. E+ default input values were used when available and reasonable.
Additional inputs were determined by consulting licensed engineering professionals at
several design firms. The E+ heat pump object was calibrated using WWHR-HP
manufacturer lab testing data and a publicly available EnergyPlus auxiliary calibration
spreadsheet tool. As with any computer model, several key assumptions were made to
simplify model formulation. These assumptions were made with high regard as to their
possible impacts on model fidelity. These assumptions included the following:
    • All pipes were modelled as adiabatic;
    • Wastewater was modelled as pure water (i.e., no solids);
    • Constant heat pump source (evaporator) water flow;
    • Frictionless pipes;
    • Linear water pump curves.
    The DOE Reference Building feasibility case models were created by deleting the
original DHW heating objects and replacing them with the T-10 unit model objects via a
text editor. The original and modified model simulated energy use, energy cost and GHG
emissions were used to determine if WWHR would be feasible in the given building type
and climate.

 EnergyPlus model description
    Plant loops were created to best mimic the real-life behaviour of the WWHR-HP
system. The formulation of this model was based upon the typical hot water production
setup like that in Figure 2. In total, five plant loops were required to model the system. The
plant loops were the: DHW loop, DPW loop, Top-Off loop, WW-HP loop, and WW-Water
loop. The branch connection diagram for all five of these loops is seen in Figure 3.
    Each plant loop can be broken into a supply and demand side. The supply side contains
equipment that meets the heating or cooling load created by equipment on the demand side.
The E+ Plant Manager simulates the demand half-loops simultaneously and then all the
supply half-loops simultaneously and uses a series of complex integral functions and
predictor/corrector equations to converge on a solution for each simulated timestep.
Several of the most important governing equations are listed below. One should refer to the
EnergyPlus Engineering Reference and EnergyPlus Input-Output Reference for more
detailed information.

    Loops. Heating or cooling demand that the supply half-loop serves (LoopDemand) is
determined via eq. (2), where LoopSetPoint is the supply half-loop leaving water
temperature setpoint, LoopTempIn is the supply loop entering water temperature, mdot is
the water mass flow rate and cp is the specific heat of the loop water [14] (p 467):

               LoopDemand =                    ×      × (LoopSetPoint − LoopTempIn)                  (2)

Journal of Sustainable Development of Energy, Water and Environment Systems                                6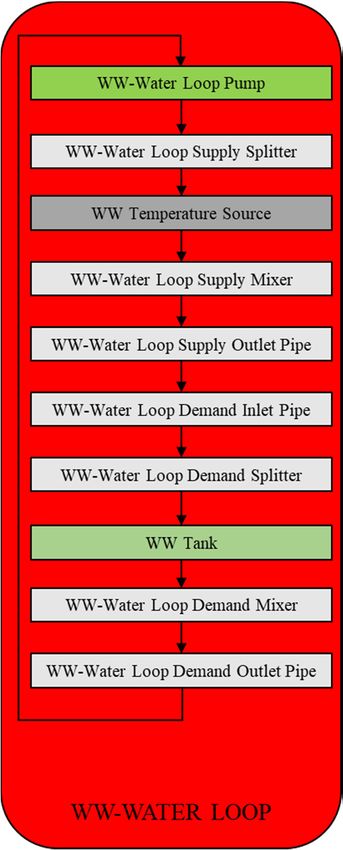
Smith, N. R., Henze, G. P.                                                                               Year 2021
    Modelling of Wastewater Heat Recovery ...                                               Volume 9, Issue 1, 1080330

                      Figure 3. EnergyPlus model loop branch connection diagrams

   Pumps. Each plant loop contains a circulation pump that was modelled as a variable
speed pump. The pump is governed by eqs. (3-6) found in section 18.4.3 of the

7                                               Journal of Sustainable Development of Energy, Water and Environment Systems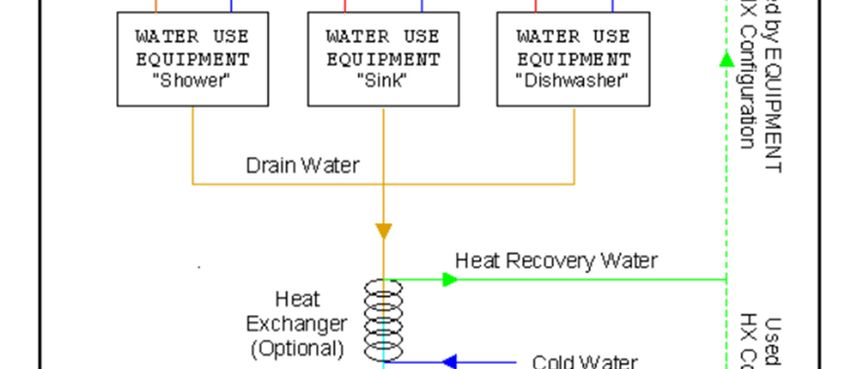
Smith, N. R., Henze, G. P.                                                                             Year 2021
 Modelling of Wastewater Heat Recovery ...                                             Volume 9, Issue 1, 1080330
EnergyPlus Engineering Reference [14] (p 1275). Each pump was modelled with
A1 = A3 = A4 = 0 and A2 = 1 in order to produce a linear pump curve:

           FracFullLoadPower = A, + A. × PLR 0 + A1 × PLR 0 . + A2 × PLR 0 1                                    (3)

   The part load ratio (PLRp), is the volumetric flow rate at a given timestep
(VolFlowRate), divided by the E+ autosized maximum pump volumetric flow rate
(NomVolFlowRate):

                                                      VolFlowRate
                                         PLR 0 =
                                                    NomVolFlowRate
                                                                                                                (4)

    The loop water volumetric flow rate (VolFlowRate), is equal to the loop mass flow
rate (PumpMassFlowRate), divided by the loop water density (LoopDensity).
The LoopDensity is determined by E+ during the simulation via interpolating internal
program fluid property tables:

                                                        PumpMassFlowRate
                                 VolFlowRate =
                                                           LoopDensity
                                                                                                                (5)

   The electric power consumed by the pump is a function of pump curve value
(FracFullLoadPower), multiplied by the pump maximum power (NomPowerUse):

                     PumpPower = FracFullLoadPower × NomPowerUse                                                (6)

    Boiler. The natural gas fuelled boiler found in the Top-Off loop is governed by
eqs. (7-9) [14] (p 718). The amount of natural gas consumed by the boiler (FuelUsed), is
the heating demand calculated via eq. (2) (BoilerLoad), divided by the user-input thermal
efficiency (NominalThermalEfficiency), and the boiler efficiency performance curve
value (BoilerEfficiencyCurveOutput):

                                               BoilerLoad
         FuelUsed =
                          NominalThermalEfficiency × BoilerEfficiencyCurveOutput
                                                                                                                (7)

    The boiler efficiency curve is a biquadratic function with six coefficients. Twater is the
boiler operating temperature:

   BoilerEfficiencyCurve = B, + B. × PLR ; + B1 × PLR ; . + B2 × ?@A + BB × ?@A . + BC × ?@A × PLR ;   (8)

    The boiler part load ratio (PLRb) is the boiler heating load (BoilerLoad), divided by
the E+ autosized heating capacity (BoilerNomCapacity):

                                                      BoilerLoad
                                      PLR ; =
                                                  BoilerNomCapacity
                                                                                                                (9)

    Mixed thermal water tanks. The water tanks used in the model loops, including the
WW tank, DPW and Top-Off tanks are thermodynamically governed by eqs. (10-14) as
featured in section 20.3.1 of the EnergyPlus Engineering Reference [14] (p 1481).
The tank energy balance is governed by the differential equation in eq. (10) with the tank
water net heat transfer rate (qnet), being equal to the product of: the density of the tank
water (ρ), the tank volume (V), the specific heat of water (cp), and temperature variation
with respect to time (dT/dt):

Journal of Sustainable Development of Energy, Water and Environment Systems                                         8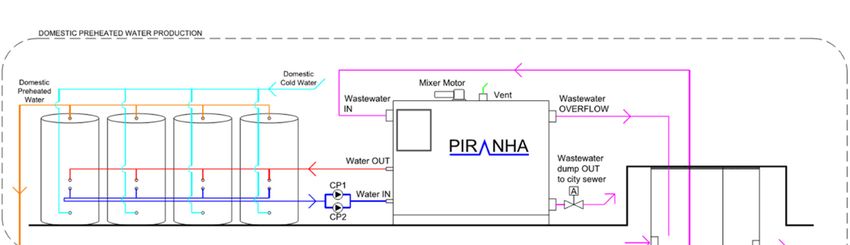
Smith, N. R., Henze, G. P.                                                                               Year 2021
    Modelling of Wastewater Heat Recovery ...                                               Volume 9, Issue 1, 1080330

                                                                       <
                                          DE@? = F × G ×          ×                                                  (10)

    The tank water net heat transfer is the sum of three components: the water entering the
tank, the water leaving the tank, and the losses to the ambient environment. Eq. (11) is a
simplification of the full E+ equation, which allows for the tanks to function as water heaters:

                                     DE@? = DHI@ + DIJHAK@ + DJLLKMKNJII                                             (11)

    Eq. (12) and eq. (13) use the specific heat of water (cp), the heat exchanger
effectiveness (ε), mass flow rate of the water ( O ), temperature of the entering water
(Tuse/Tsource), and temperature of the tank water (T). The heat exchanger effectiveness was
input as 1 for all tank use and source sides. The use-side water is the water entering the
tank and the source-side water is the water leaving the tank:

                                   DHI@ = PHI@ × O HI@ ×         × (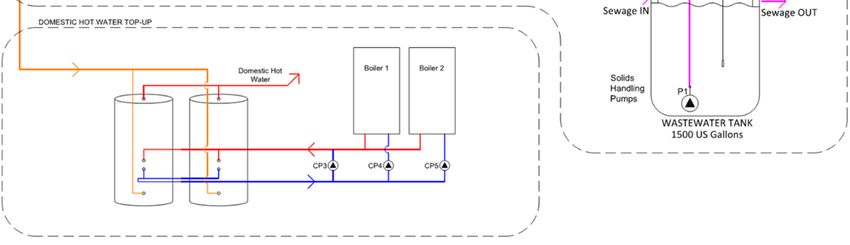
Smith, N. R., Henze, G. P.                                                                                                   Year 2021
 Modelling of Wastewater Heat Recovery ...                                                                   Volume 9, Issue 1, 1080330
                                            Table 2. EnergyPlus heat pump coefficients for eq. (15)

                                       C1                       C2                        C3                   C4                C5
   Initial                         1.51439831              −0.491629991               4.62356048               0             −5.2734375
  Adjusted                        −3.50792302              −0.491629991               4.62356048               0                  0

                                            Table 3. EnergyPlus heat pump coefficients for eq. (16)

                                      D1                       D2                    D3                    D4                        D5
   Initial                        0.43647803               3.89611258            0.64400684            −0.00781250                   −5
  Adjusted                       −4.33286711               3.89611258            0.64400684                 0                         0

    The TU,A@L and PowerU,A@L quantities in eq. (15) and eq. (16), respectively, were taken
to be the largest condenser heat transfer rate (43,890 W) and compressor power draw
(12,625 W) found in the lab testing data. These values were input into the auxiliary
program and model as such. GOZ,A@L was taken to be the constant lab test data condenser
flow rate, 0.00166 m3/s and GO^,A@L was taken to be 0.00662 m3/s, the typical
recommended T-10 wastewater solids handling pump flow rate.
    As mentioned in the Lab Test Performance Data section of this manuscript, the
condenser and evaporator side flow rates were held constant during testing. It was
therefore deemed inappropriate to calibrate the heat pump object based on constant flow
conditions to then simulate with potentially varying flow rates. To correct this
inconsistency, the initial values of C4 and C5 were combined with C1. Coefficients C4
and C5 were then set to zero. This was repeated for the D coefficients. The adjusted
coefficients can be seen in Table 2 and Table 3. Figure 4 displays the EnergyPlus heat
pump performance using eqs. (15-18) with the adjusted coefficients overlaid on the
original lab test data. The graph shows that the model’s heat pump object is well
calibrated to mimic the actual performance of the T-10 unit.

                                                 Lab test & EnergyPlus performance at various wastewater temperatures
                                 8,0
                                                                                                            Lab Test 18 ºC
                                                                                                            E+ Adjusted 18 ºC
                                 7,0                                                                        Lab Test 21 ºC
                                                                                                            E+ Adjusted 21 ºC
                                                                                                            Lab Test 24 ºC
                                 6,0
               WWHR-HP COP [-]

                                                                                                            E+ Adjusted 24 ºC
                                                                                                            Lab Test 27 ºC
                                                                                                            E+ Adjusted 27 ºC
                                 5,0
                                                                                                            Lab Test 30 ºC
                                                                                                            E+ Adjusted 30 ºC

                                 4,0

                                 3,0

                                 2,0
                                       25        30         35        40         45         50         55        60             65
                                                      WWHR-HP condenser water outlet temperature [°C]

          Figure 4. Original lab test data and adjusted EnergyPlus heat pump performance

 Energy Management System
   The Energy Management System (EMS) is a ‘high level, supervisory control’ feature
of EnergyPlus [17]. EMS involves creating customized programs using the EnergyPlus

Journal of Sustainable Development of Energy, Water and Environment Systems                                                               10
Smith, N. R., Henze, G. P. Year 2021
Modelling of Wastewater Heat Recovery ... Volume 9, Issue 1, 1080330
Runtime Language. For this model, EMS was used to transmit virtual wastewater from
the DHW loop to the WW-Water loop. This EMS work around is required because the
domestic water connections object is an open loop and E+ does not allow for open loop
water to be easily incorporated into a closed plant loop. EnergyPlus calculates the
demanded flow rates for both hot and cold water, as well as the resultant wastewater
temperature. Figure 5 is a diagram of a generalized domestic water connections object
from the EnergyPlus Input-Output Reference [18] (p 2200). The built-in WWHR feature
seen in Figure 5 attempts to capture the effects of a drain pipe wrap gravity film heat
exchanger coil and is not flexible enough to model a heat pump system properly.
The built-in heat recovery feature can only recover heat for pre-heating water at the
fixture. If this feature was used in the model, it would not properly capture the
temperature and mass flow rate profiles seen by the T-10 heat pump. Thus, EMS
was used.
Figure 5. EnergyPlus WaterUse: Connections diagram [14] (p 1510)
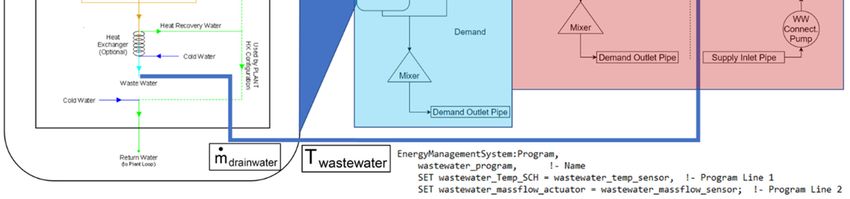
An EMS program was written to use the wastewater outlet temperature and drain
water mass flow rate to control the flow of water to the WW-Water plant loop (Figure 6).
This loop connects the WW tank to a temperature source object. The temperature source
object outputs water at a scheduled temperature without using any virtual fuel resources
[18] (p 832). Not using any virtual fuel resources allows for accurate accounting of
11 Journal of Sustainable Development of Energy, Water and Environment SystemsSmith, N. R., Henze, G. P. Year 2021
Modelling of Wastewater Heat Recovery ... Volume 9, Issue 1, 1080330
energy transfers during simulations since, in reality, no resources are required to generate
the warm wastewater in the storage tank. EMS resets the scheduled output temperature
and mass flow rate of the temperature source object to match the calculated drain water
temperature from the domestic water end uses at each timestep. The result is that the
WW-Water loop demand side, which contains the WW tank, sees water with the same
temperature and mass flow rate as actual wastewater entering the tank.
Figure 6. EMS solution to the WaterUse:Connections challenge
Model inputs
To prevent redundancy, Table 4 displays model inputs that were consistent across
several objects. Table 5 displays where inputs deviated from those in Table 4.
Table 4. Global EnergyPlus model inputs
Object name Field Input Source
Ambient temperature Schedule value [°C] 22 General room temperature
EnergyPlus Engineering
Design power
Autosize Reference, EnergyPlus
consumption [W]
Input-Output Reference
Pumps
Motor efficiency [-] 0.9 EnergyPlus default
Performance curve [-] Linear Engineering consulting firm
Type [-] Adiabatic EnergyPlus default
Pipes
Pressure loss [-] None EnergyPlus default
Use/Source side
Tanks 1 EnergyPlus default
effectiveness [-]
Several parameters were set to autosize. This was done to allow for models to run
without capacity constrictions. The linear performance curves in the components that
were autosized prevented this model flexibility from distorting the results. Additionally,
some objects were modelled that are not present in an installed system. An example is the
WW-Water loop. As described in the Energy Management System section, this loop was
added to improve model fidelity. Thus, the loop pump power was set to zero to prevent
accounting for excess energy consumption.
Journal of Sustainable Development of Energy, Water and Environment Systems 12Smith, N. R., Henze, G. P. Year 2021
Modelling of Wastewater Heat Recovery ... Volume 9, Issue 1, 1080330
Table 5. Specific EnergyPlus model inputs
Object name Field Input Source
WW water Design pump head [Pa] 179,352 EnergyPlus default
loop pump Design power consumption [W] 0 Pseudo loop object
Pump manufacturer,
WW-HP pump Design pump head [Pa] 59,782
Engineering consulting firm
Pump manufacturer,
DPW loop pump Design pump head [Pa] 59,782
Engineering consulting firm
Top-Off Pump manufacturer,
Design pump head [Pa] 59,782
loop pump Engineering consulting firm
DHW
Design pump head [Pa] 179,352 EnergyPlus default
loop pump
EnergyPlus engineering reference,
Nominal capacity [W] Autosize
EnergyPlus input-output reference
Nominal thermal efficiency [-] 80% ASHRAE 90.1 2010 min. = 80% [19] (p 63)
Curve coefficient C1 [-] 1.1249 EnergyPlus dataset [20]
Curve coefficient C2 [-] 0.0149 EnergyPlus dataset [20]
Boiler Curve coefficient C3 [-] −0.0259 EnergyPlus dataset [20]
Curve coefficient C4 [-] 0 EnergyPlus dataset [20]
Curve coefficient C5 [-] 0 EnergyPlus dataset [20]
Curve coefficient C6 [-] −0.0015 EnergyPlus dataset [20]
DOE reference building models
Operating temperature [°C] 82.2, 54.4
(large hotel, mid-rise apartment)
Reference load side flow rate [L/s] 1.64 Maximum from lab test data/product cut sheet
Reference source side flow rate [L/s] 6.62 Represents constant flow from lab test
WWHR-HP
Ref. heating capacity [W] 43,892 Maximum from lab test data
Ref heating power consumption [W] 12,625 Maximum from lab test data
Example project from
Off-Cycle loss coefficient [W/K] 2.36
WWHR-HP manufacturer
WW tank
Example project from
Tank volume [m3] 3.785
WWHR-HP manufacturer
Off-Cycle loss coefficient [W/K] 6.311 R-25 equivalent, well insulated tank
DPW tank Example project from
Tank volume [m3] 1.514
WWHR-HP manufacturer
Uniform skin loss coefficient per unit area
6.311 R-25 equivalent, well insulated tank
to ambient [W/K]
Top-Off tank
Example project from
Tank volume [m3] 1.514
WWHR-HP manufacturer
Economics
Economic viability was established using Simple Payback Period (SPP). This simple
economic metric is calculated using eq. (19) where CF0 is the annual net cost savings and
I is the initial investment [21]:
CFc
SPP =
I
(19)
SPP is measured in years and does not account for the time value of money, but
provides a good proxy for the quality of the investment opportunity. The shorter the SPP,
the more attractive the investment is. For context, a 2010 white paper by Siemens
displayed the results of an energy efficiency survey in which only 21% of respondents
were willing to accept a payback of longer than four years, while 39% of respondents
required a shorter payback period to invest in a project [22]. The remaining proportion
used other metrics such as internal rate of return to make decisions.
REFERENCE BUILDING MODEL DESCRIPTIONS
Once the EnergyPlus model was assembled, it was integrated into holistic building
energy models in order to quantify potential environmental and cost impacts in different
climate zones and building types. The U.S. DOE has teamed up with 3 of its national
13 Journal of Sustainable Development of Energy, Water and Environment SystemsSmith, N. R., Henze, G. P. Year 2021
Modelling of Wastewater Heat Recovery ... Volume 9, Issue 1, 1080330
laboratories to create reference commercial building energy models. There are 16
different reference building types that cover approximately 70% of the U.S. national
building stock [23]. The previously described T-10 unit setup was integrated into these
reference buildings with few other modifications. The Large hotel and Mid-rise
apartment building models were chosen, as these building types traditionally have above
average DHW consumption rates and thus the greatest opportunity for WWHR. The two
mentioned building types were modelled in 4 different climate zones, as each
geographical location featured different ground water-main temperatures, primary fuel
costs and electricity source fuel ratios. The four ASHRAE climate zones used were:
1A-Miami, Florida, 4C-Seattle, Washington, 5B-Boulder, Colorado and
7A-Duluth, Minnesota.
The unmodified reference model is henceforth referred to as the ‘Baseline’ model.
Version 1.4_7.2 was used for all DOE reference buildings, which was last updated in
2012 [24]. For each climate zone and building type combination, a ‘T-10 unit’ model was
created by removing the existing service hot water system objects from the model IDF
and replacing those objects with the loop objects shown in Figure 3. Component names
were modified to make connections as needed.
Large hotel
The Large hotel model features 11,345 m2 of conditioned spaces in six above-ground
floors and a basement. The baseline model consumes 44,333 m3 of domestic hot and cold
water per annum, which results in a large volume of wastewater. Baseline model water
heating is done with 80% efficient natural gas-fired boilers with a supply water setpoint
of 60 °C. The average utility costs are seen in Table 6 [24].
Table 6. Average utility prices and costs for the Large hotel baseline model
Miami Seattle Boulder Duluth
Average annual rate [USD/kWh] 0.073 0.066 0.037 0.053
Electric utility rates
Total cost [USD/m2] 26.54 13.79 7.85 11.28
Average annual rate [USD/MJ] 0.0104 0.0081 0.0073 0.0067
Gas utility rates
Total cost [USD/m2] 4.75 7.21 6.91 8.87
Mid-rise apartment
The Mid-rise apartment model features 3,135 m2 of conditioned spaces in 4
above-ground stories. The baseline model consumes 1,875 m3 of domestic hot and cold
water per annum. Baseline model water heating is done with 80% efficient natural-gas
fired boilers with a supply water setpoint of 60 °C. The average utility costs are seen in
Table 7 [24].
Table 7. Average utility prices and costs for the Mid-rise apartment baseline model
Miami Seattle Boulder Duluth
Average annual rate [USD/kWh] 0.079 0.072 0.038 0.057
Electric utility rates
Total cost [USD/m2] 8.04 4.92 2.72 4.01
Average annual rate [USD/MJ] 0.0104 0.0081 0.0073 0.0067
Gas utility rates
Total cost [USD/m2] 4.75 7.21 6.91 8.87
Results: Large hotel
Table 8 shows the results of the 8 Large hotel simulations. Significant savings were
seen in all climate zones and categories. The greatest energy savings percentage occurred
in climate zone 4C-Seattle. The greatest energy cost savings occurred in climate zone
Journal of Sustainable Development of Energy, Water and Environment Systems 14Smith, N. R., Henze, G. P. Year 2021
Modelling of Wastewater Heat Recovery ... Volume 9, Issue 1, 1080330
7A-Duluth. Also, the greatest GHG reduction by percentage occurred in Seattle, while
the greatest absolute GHG reduction occurred in Duluth.
Table 8. Large hotel model results
Energy cost
EUI Energy Energy cost GHG emissions GHG reduction
Model run savings SPP [yrs]
[MJ/m2yr] savings [%] [USD/yr] [MT CO2e/yr] [%]
[USD/yr]
1A Baseline 1,192 - 242,200 - - 504 -
1A T-10 Unit 1,001 16 219,400 22,800 6.6 479 5
4C Baseline 1,528 - 221,000 - - 314 -
4C T-10 Unit 1,149 25 184,700 36,300 4.1 254 19
5B Baseline 1,639 - 156,500 - - 673 -
5B T-10 Unit 1,249 24 123,400 33,100 4.5 619 8
7A Baseline 2,076 - 215,100 - - 650 -
7A T-10 Unit 1,602 23 177,500 37,600 4.0 573 12
The cost of a WWHR system for a typical large hotel with the specifications of the
reference model was estimated by the T-10 manufacturer to be about USD 150,000.
This estimate was for WWHR equipment only and did not include installation, design or
other equipment. Nevertheless, USD 150,000 was used to estimate SPPs. Duluth featured
the shortest SPP of 4.0 years. Figure 7 shows Energy Use Intensity (EUI) reductions by
end use for the entire building.
Large hotel energy end-use
2.500
22.9%
Energy Use Intensity [MJ/m2yr]
2.000
23.8%
24.8%
1.500
16.0%
1.000
500
0
Lighting Elec. Equipment Fans Pumps
Space Cooling Space Heating Service HW Process Cooling
Process Heating Exterior Use Energy Savings
Figure 7. Large hotel model EUI and energy end-use reductions
Results: Mid-rise apartment
Table 9 shows the results of the 8 Mid-rise apartment simulations. In contrast to the
Large hotel results, savings were either minimal or non-existent across almost all
categories. In fact, GHG emissions increased in 3 out of 4 climate zones. The greatest
15 Journal of Sustainable Development of Energy, Water and Environment SystemsSmith, N. R., Henze, G. P. Year 2021
Modelling of Wastewater Heat Recovery ... Volume 9, Issue 1, 1080330
EUI reduction occurred in climate zone 7A-Duluth. The greatest energy cost savings
occurred in climate zone 5B-Boulder and the greatest GHG reduction occurred in Seattle,
which was the only climate zone that resulted in a GHG reduction.
Table 9. Mid-rise apartment model results
Energy cost
EUI Energy Energy cost GHG emissions GHG reduction
Model run savings SPP [yrs]
[MJ/m2yr] savings [%] [USD/yr] [MT CO2e/yr] [%]
[USD/yr]
1A Baseline 413 - 26,700 - - 60 -
1A T-10 Unit 384 7 26,000 700 114 61 −1
4C Baseline 435 - 20,500 - - 27 -
4C T-10 Unit 377 13 19,700 800 100 26 7
5B Baseline 470 - 13,200 - - 71 -
5B T-10 Unit 412 12 12,100 1,100 73 74 −3
7A Baseline 672 - 21,500 - - 69 -
7A T-10 Unit 599 11 20,500 1,000 80 70 −2
The cost of a WWHR system for a Mid-rise apartment was estimated by the T-10 unit
manufacturer to be about USD 80,000. This estimate only includes the cost the T-10 heat
pump units and does not include installation, design, other pieces of equipment in the
DHW production system or taxes. Nevertheless, USD 80,000 was used to estimate SPPs.
All payback periods were unacceptably long with Boulder having the shortest at 73 years.
Figure 8 shows EUI reductions by end use for the entire building.
Mid-rise apartment energy end-use
700 10.9%
600
Energy Use Intensity [MJ/m2yr]
500 12.4%
7.1% 13.2%
400
300
200
100
0
Lighting Elec. Equipment Fans Pumps
Space Cooling Space Heating Service HW Process Cooling
Process Heating Exterior Use Energy Savings
Figure 8. Mid-rise apartment model EUI and energy end-use reductions
DISCUSSION
The reason that the GHG percentage reduction and energy use percentage reduction
are not equal in some cases is due to the electricity source mix. The U.S. Northwest takes
advantage of a lot of hydropower and has a low carbon footprint. Because natural gas is
Journal of Sustainable Development of Energy, Water and Environment Systems 16Smith, N. R., Henze, G. P. Year 2021
Modelling of Wastewater Heat Recovery ... Volume 9, Issue 1, 1080330
the baseline water heating fuel, reductions in natural gas use (by recovering wastewater
heat to preheat water) have an outsized impact for buildings in Seattle. In essence, the
T-10 unit displaces natural gas water heating and replaces it with more efficient
electricity. This is economically conducive for states with low electricity rates.
Additionally, the unacceptably long SPPs for the Mid-rise apartment models are a
result of the relatively low initial energy usage. DHW demand, and thus potential heat
recovery, is not large enough to justify the initial investment required. Also, the global
hydraulic fracturing and shale oil boom have led to relatively inexpensive natural gas.
Cheap natural gas depresses the economic incentives to invest in heat recovery systems
of all types including the WWHR-HP systems.
SPP for the Large hotel was much more reasonable. While a 4-7 year SPP is likely
longer than the leisure and hospitality industry is accustomed to, the recent increase in
environmental activism and social responsibility by corporations may help to overcome
the longer SPP.
Additionally, cities and municipalities in the United States are beginning to enact
regulations to reduce GHG emissions. New York City’s Climate Mobilization Act
imposes GHG emission limits on building owners [25]. The City of Berkeley, California
recently banned new natural gas connections [26]. These new regulations could provide a
tailwind for WWHR adoption and lead to system cost reduction over time. Until that
point, WWHR systems will likely not be cost competitive with traditional technologies
and will likely only be installed on projects where governments, designers, and building
owners have aggressive sustainability goals.
CONCLUSIONS
The development of this EnergyPlus model will allow practitioners to consider WWHR
systems more often due to the increased ease of modelling. DOE reference building models
were successfully used as test cases for the model and were indicators of WWHR potential.
At this time, WWHR is likely only appropriate for large commercial buildings and not for
small residential settings. Projects with net-zero energy ambitions will also want to further
explore WWHR solutions. As more WWHR systems are installed, initial capital costs will
likely decrease, leading to positive momentum in the market. In summary, both of the main
objectives for this project, creating a high-fidelity EnergyPlus model for a WWHR-HP
system and assessing the potential building types/climates that would be most ideal for
system deployment, were successfully achieved.
There remains a plethora of opportunities for future work following this project.
One of these opportunities is to develop a WWHR OpenStudio measure. The National
Renewable Energy Laboratory is currently developing this measure, which is simply a
computer script that will add the WWHR-HP system to a wholistic building energy
model in a single step. Additionally, controls for the T-10 unit model could be improved.
In the models created for this project, the evaporator side of the heat pump was assumed
to have continuous flow. Batch flow behaviour would more accurately represent actual
system performance and would capture more nuanced performance effects. There is
likely the potential to use EMS to model this behaviour. Finally, WWHR metered data or
additional lab testing data would help to improve model validation. Installed T-10 unit
metered data, including usage rates, COP, energy consumption, wastewater temperatures,
etc., would allow for better calibration and validation of the EnergyPlus model.
ACKNOWLEDGMENT
The authors would like to thank the University of Colorado-Boulder Architectural
Engineering Department, the National Renewable Energy Lab and Sharc Energy
Systems for their time, resources and technical support.
17 Journal of Sustainable Development of Energy, Water and Environment SystemsSmith, N. R., Henze, G. P. Year 2021
Modelling of Wastewater Heat Recovery ... Volume 9, Issue 1, 1080330
NOMENCLATURE
A water tank surface area [m2]
A1-A4 pump curve coefficients [-]
B1-B6 boiler curve coefficients [-]
BoilerEfficiencyCurveOutput boiler efficiency curve value [-]
BoilerLoad boiler heating demand [W]
BoilerNomCapacity boiler maximum heating capacity [W]
C1-D5 heat pump equation fit coefficients [-]
CF0 annual net cost savings [USD/yr]
cp specific heat of water [kJ/kgK]
COPh heat pump coefficient of performance [W/W]
FracFullLoadPower fraction of full load pump power [-]
FuelUsed boiler fuel consumption rate [W]
LoopDemand loop heating or cooling demand [W]
LoopDensity loop water density [kg/m3]
LoopSetPoint loop supply-side outlet setpoint [°C]
temperature
LoopTempIn loop supply-side inlet temperature [°C]
I initial investment [USD]
mdot loop mass flow rate [kg/s]
NomPowerUse pump maximum power [W]
NominalThermalEfficiency user-input boiler thermal efficiency [-]
NomVolFlowRate maximum pump volumetric flow rate [m3/s]
PLR part load ratio [-]
Powerh heat pump power consumption [W]
PumpMassFlowRate loop water mass flow rate [kg/s]
PumpPower pump electrical power [W]
Qh heat pump load side heat transfer rate [W]
q heat transfer rate [W]
Qsource,h heat pump source side heat transfer rate [W]
SPP simple payback period [yr]
TL,in heat pump entering load side water [K]
temperature
Tref heat pump reference temperature [K]
TS,in heat pump entering source side [K]
water temperature
Twater boiler operating temperature [°C]
UA off cycle loss coefficient [W/K]
V tank water volume [m3]
VolFlowRate loop water volumetric flow rate [m3/s]
GOZ heat pump load side volumetric [m3/s]
flow rate
GO^ heat pump source side volumetric [m3/s]
flow rate
Greek letters
ρ tank water density [kg/m3]
Subscripts
amb ambient
b boiler
Journal of Sustainable Development of Energy, Water and Environment Systems 18Smith, N. R., Henze, G. P. Year 2021
Modelling of Wastewater Heat Recovery ... Volume 9, Issue 1, 1080330
h heating
L load
net net
offcycloss water tank heater off cycle loss
p pump
ref reference
S source
source water tank source side
use water tank use side
Abbreviations
CO2e Carbon Dioxide Equivalent
DHW Domestic Hot Water
DOE Department of Energy
DPW Domestic Pre-heated Water
E+ EnergyPlus
EMS Energy Management System
EPW EnergyPlus Weather File
EUI Energy Use Intensity
GHG Greenhouse Gas
HP Heat Pump
IDD Input Data Dictionary
IDF Input Data File
IPCC Intergovernmental Panel on
Climate Change
WW Wastewater
WWHR Wastewater Heat Recovery
REFERENCES
1. Intergovernmental Panel On Climate Change (IPCC), Summary for Policymakers of
IPCC Special Report on Global Warming of 1.5°C, Incheon, Republic of Korea,
2018.
2. Griffiths-Sattenspiel, B., The Carbon Footprint of Water, A River Network Report,
Portland, Oregon, USA, 2009, https://www.rivernetwork.org/wp-content/uploads/
2015/10/Toolkit_Emissions2-8-12.pdf, [Accessed: 11-April-2020]
3. U. S. Department of Energy, Federal Energy Management Program,
Heat Recovery from Wastewater Using a Gravity-Film Heat Exchanger,
Report, Washington, D. C., USA, 2005, https://www.fpl.fs.
fed.us/documnts/informationalkits/infokit_0003_DrainwaterFact%20Sheet.pdf,
[Accessed: 11-April-2020]
4. Ni, L., Lau, S. K., Li, H., Zhang, T., Stansbury, J. S., Shi, J. and Neal, J.,
Feasibility Study of a Localized Residential Grey Water Energy-Recovery System,
Applied Thermal Engineering, Vol. 39, pp 53-62, 2012,
https://doi.org/10.1016/j.applthermaleng.2012.01.031
5. Hepbasli, A., Biyik, E., Ekren, O., Gunerhan, H. and Araz, M., A Key Review of
Wastewater Source Heat Pump (WWSHP) Systems, Energy Conversion and
Management, Vol. 88, pp 700-722, 2014,
https://doi.org/10.1016/j.enconman.2014.08.065
6. Kahraman, A. and Alaeddin, C., Investigation of the Performance of a Heat Pump
Using Waste, Energies, Vol. 2, No. 3, pp 697-713, 2009,
https://doi.org/10.3390/en20300697
19 Journal of Sustainable Development of Energy, Water and Environment SystemsSmith, N. R., Henze, G. P. Year 2021
Modelling of Wastewater Heat Recovery ... Volume 9, Issue 1, 1080330
7. Chao, S., Yiqiang, J., Yang, Y., Shiming, D. and Xinlei, W., A Field Study of a
Wastewater Source Heat Pump for Domestic Hot Water, Journal of Building Services
Engineering Research & Technology, Vol. 34, No. 4, pp 433-448, 2012,
https://doi.org/10.1177/0143624412463571
8. Culha, O., Gunerhan, H., Biyik, E., Ekren, O. and Hepbasli, A., Heat Exchanger
Applications in Wastewater Source Heat Pumps for Buildings: A Key Review,
Energy and Buildings, Vol. 104, pp 215-232, 2015,
https://doi.org/10.1016/j.enbuild.2015.07.013
9. Zhang, Q., Wang, Z., Yin, C., Nie, Q. and Jin, L., Field Test Analysis of a Urban
Sewage Source Heat Pump System Performance, Energy Procedia, Vol. 143,
pp 131-136, 2017, https://doi.org/10.1016/j.egypro.2017.12.660
10. Spriet, J. and Hendrick, P., Wastewater as a Heat Source for Individual Residence
Heating: A Techno-economic Feasibility Study in the Brussels Capital Region,
J. Sustain. Dev. Energy Water Environ. Syst., Vol. 5, No. 3, pp 289-308, 2017,
https://doi.org/10.13044/j.sdewes.d5.0148
11. International Wastewater Systems, Piranha Wastewater Thermal Energy Recovery
System: Installation & Operation Manual, 2017.
12. LabTest Certification Inc., Test Report for International Wastewater Systems, Port
Coquitlam, Canada, 2017.
13. U.S. Department of Energy, Office of Energy Efficiency & Renewable Energy,
Energyplus, Washington, D. C., USA, https://www.energy.gov/eere/buildings/
downloads/energyplus-0, [Accessed: 01-June-2019]
14. U.S. Department of Energy, EnergyPlus Version 8.8: Engineering Reference,
Washington, D. C., USA, 2017.
15. Tang, C. C., Modeling Packaged Heat Pumps in Quasi-Steady State Energy
Simulation Program, MS.c. Thesis, Oklahoma State University, Stillwater,
Oklahoma, USA, 2005.
16. U.S. Department of Energy, Parametric Spreadsheets for HeatPump WatertoWater
WatertoAir, Washington, D. C., USA, 2017, http://energyplus.helpserve.com/
knowledgebase/article/View/83/39/heatpump-watertowater-watertoair-spreadsheets-
and-docs, [Accessed: 11-April-2020]
17. U.S. Department of Energy, EnergyPlus Version 8.8: EMS Application Guide,
Washington, D. C., USA, 2017.
18. U.S. Department of Energy, EnergyPlus Version 8.8: Input Output Reference,
Washington, D. C., USA, 2017.
19. American Society of Heating, Refrigerating and Air-Conditioning Engineers, Inc.,
ASHRAE Standard 90.1-2010: Energy Standard for Buildings Except Low-Rise
Residential Buildings, IP Edition, Atlanta, Georgia, USA, 2010.
20. U.S. Department of Energy, EnergyPlus v8.8: Datasets: Boilers, Washington, D. C.,
USA, 2020.
21. Krarti, M., Energy Audit of Building Systems (2nd ed.), CRC Press, Boca Raton,
Florida, USA, 2011.
22. Siemens, Economics of Energy Upgrades, National League of Cities, Washington,
D. C., USA, 2010.
23. National Renewable Energy Laboratory (NREL), U. S. Department of Energy,
Commercial Reference Building Models of the National Building Stock, Technical
Report, Golden, Colorado, USA, 2011, https://www.nrel.gov/docs/fy11osti/
46861.pdf, [Accessed: 11-April-2020]
24. U.S. Department of Energy, New Construction — Commercial Reference Buildings,
Washington, D. C., USA, 2012, https://www.energy.gov/eere/buildings/new-
construction-commercial-reference-buildings, [Accessed: 11-April-2020]
Journal of Sustainable Development of Energy, Water and Environment Systems 20Smith, N. R., Henze, G. P. Year 2021
Modelling of Wastewater Heat Recovery ... Volume 9, Issue 1, 1080330
25. John, J. St., New York City Set to Pass Ambitious Energy Efficiency Mandate,
Greentech Media, New York, USA, 2019, https://www.greentechmedia.com/
articles/read/new-york-city-set-to-pass-ambitious-building-energy-efficiency-bill,
[Accessed: 11-April-2020]
26. Cagle, S., Berkeley Became First US City to Ban Natural Gas. Here’s What that May
Mean for the Future, The Guardian, London, UK, 2019,
https://www.theguardian.com/environment/2019/jul/23/berkeley-natural-gas-ban-en
vironment, [Accessed: 11-April-2020]
Paper submitted: 11.12.2019
Paper revised: 27.04.2020
Paper accepted: 28.04.2020
21 Journal of Sustainable Development of Energy, Water and Environment SystemsYou can also read