Fact Sheet - US Army Yakima Training Center
←
→
Page content transcription
If your browser does not render page correctly, please read the page content below
Fact Sheet
                         The U.S. Environmental Protection Agency (EPA)
       Proposes to Reissue a National Pollutant Discharge Elimination System (NPDES)
       Permit to Discharge Pollutants Pursuant to the Provisions of the Clean Water Act
                                          (CWA) to:
                                  Yakima Training Center

   Public Comment Start Date: June 15, 2021
   Public Comment Expiration Date: July 15, 2021
   Technical Contact: Cody Piscitelli
                      (206) 553-1169
                      800-424-4372, ext. 1169 (within Alaska, Idaho, Oregon and Washington)
                      Piscitelli.Cody@epa.gov

   EPA Proposes To Reissue NPDES Permit
   EPA proposes to reissue the NPDES permit for the facility referenced above. The draft
   permit places conditions on the discharge of pollutants from the wastewater treatment plant
   to waters of the United States. In order to ensure protection of water quality and human
   health, the permit places limits on the types and amounts of pollutants that can be discharged
   from the facility.
   This Fact Sheet includes:
   ▪   information on public comment, public hearing, and appeal procedures
   ▪   a listing of proposed effluent limitations and other conditions for the facility
   ▪   a map and description of the discharge location
   ▪   technical material supporting the conditions in the permit
   State Certification
   EPA is requesting that the Washington Department of Ecology (Ecology) provide a
   certification of the permit for this facility under Section 401 of the Clean Water Act.
   Comments regarding Ecology’s intent to certify the permit should be directed to Angela
   Zeigenfuse at azei461@ECY.WA.GOV.
   Public Comment
   Because of the COVID-19 virus, access to the Region 10 EPA building is
   limited. Therefore, we request that all comments on EPA’s draft permits or requests for a
   public hearing be submitted via email to Cody Piscitelli (piscitelli.cody@epa.gov). If you are
   unable to submit comments via email, please call 206-553-1169.

Fact Sheet: WA0021962 - Yakima Training Center                                             Page 1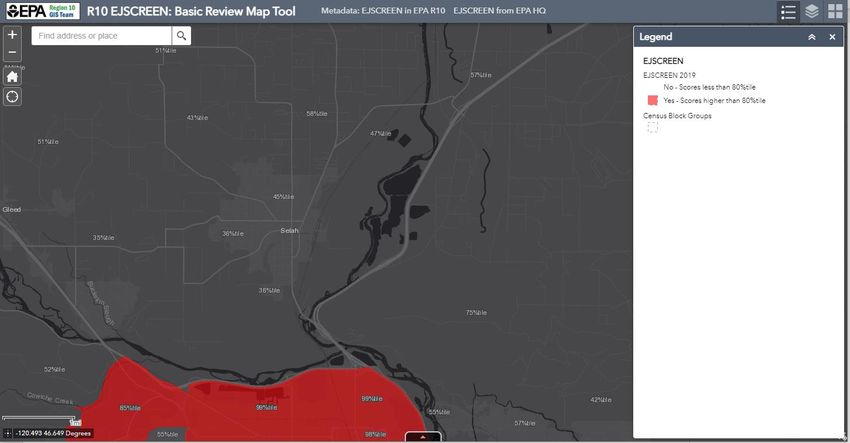
Persons wishing to comment on, or request a Public Hearing for, the draft permit for this
   facility may do so in writing by the expiration date of the Public Comment period. A request
   for a Public Hearing must state the nature of the issues to be raised as well as the requester’s
   name, address and telephone number. All comments and requests for Public Hearings must
   be in writing and should be submitted to EPA as described in the Public Comments Section
   of the attached Public Notice.
   After the Public Notice expires, and all comments have been considered, EPA’s regional
   Director for the Water Division will make a final decision regarding permit issuance. If no
   substantive comments are received, the tentative conditions in the draft permit will become
   final, and the permit will become effective upon issuance. If substantive comments are
   received, EPA will address the comments and issue the permit. The permit will become
   effective no less than 30 days after the issuance date, unless an appeal is submitted to the
   Environmental Appeals Board within 30 days pursuant to 40 CFR 124.19.
   Documents are Available for Review
   The draft permit, this Fact Sheet and the Public Notice can also be found by visiting the
   Region 10 website at https://www.epa.gov/npdes-permits/Washington-npdes-permits.
   Because of the COVID-19 virus and limited building access, we cannot make hard copies
   available.
   For technical questions regarding the Fact Sheet, contact Cody Piscitelli at (206) 553-1169 or
   Piscitelli.Cody@epa.gov. Services can be made available to persons with disabilities by
   contacting Audrey Washington at (206) 553-0523.

Fact Sheet: WA0021962 - Yakima Training Center                                               Page 2
Acronyms ........................................................................................................................................5
I. Background Information ......................................................................................................7
     A.      General Information ...................................................................................................7
     B.      Permit History ............................................................................................................7
     C.      Tribal Consultation .....................................................................................................8
II. Facility Information ..............................................................................................................8
     A.      Treatment Plant Description.......................................................................................8
III. Receiving Water...................................................................................................................10
     A.      Receiving Water .......................................................................................................10
     B.      Water Quality Standards ..........................................................................................10
     C.      Water Quality ...........................................................................................................11
     D.      Water Quality Limited Waters .................................................................................11
     E.      Low Flow Conditions ...............................................................................................11
IV. Effluent Limitations and Monitoring ................................................................................11
     A.      Basis for Effluent Limits ..........................................................................................15
     B.      Pollutants of Concern ...............................................................................................15
     C.      Technology-Based Effluent Limits ..........................................................................15
     D.      Water Quality-Based Effluent Limits ......................................................................17
     E.      Antibacksliding ........................................................................................................18
V. Monitoring Requirements...................................................................................................19
     A.      Basis for Effluent and Surface Water Monitoring ...................................................19
     B.      Effluent Monitoring..................................................................................................19
     C.      Surface Water Monitoring ........................................................................................20
     D.      Electronic Submission of Discharge Monitoring Reports........................................20
VI. Other Permit Conditions ....................................................................................................20
     A.      Quality Assurance Plan ............................................................................................20
     B.      Operation and Maintenance Plan .............................................................................20
     C.      Environmental Justice ..............................................................................................21
     D.      Standard Permit Provisions ......................................................................................22
VII. Other Legal Requirements .................................................................................................22
     A.      Endangered Species Act ...........................................................................................22
     B.      Essential Fish Habitat ...............................................................................................22
     C.      CWA § 401 Certification .........................................................................................23
     D.      Antidegradation ........................................................................................................23
     E.      Permit Expiration .....................................................................................................23
VIII.     References ...................................................................................................................23
Appendix A. Facility Information ..........................................................................................25
Figure A-1: Yakima Training Center Wastewater Treatment Plant and Outfall Map ...................25
Appendix B. Water Quality Data ...........................................................................................27

Fact Sheet: WA0021962 - Yakima Training Center                                                                                          Page 3
A. Treatment Plant Effluent Data..................................................................................27
Appendix C. Essential Fish Habitat Assessment...................................................................30
A. Listing of EFH Species in the Facility Area ............................................................30
B. Description of the Facility and Discharge Location.................................................30
C. EPA’s Evaluation of Potential Effects to EFH.........................................................30
Appendix D. Antidegradation Analysis .................................................................................32
Fact Sheet: WA0021962 - Yakima Training Center Page 4Acronyms
BO or
Biological Opinion
BiOp
BOD5 Biochemical oxygen demand, five-day
°C Degrees Celsius
CFR Code of Federal Regulations
CFU Colony Forming Units
CWA Clean Water Act
DMR Discharge Monitoring Report
DO Dissolved oxygen
EFH Essential Fish Habitat
EPA U.S. Environmental Protection Agency
ESA Endangered Species Act
HUC Hydrologic Unit Code
ICIS Integrated Compliance Information System
LA Load Allocation
lbs/day Pounds per day
mg/L Milligrams per liter
mL Milliliters
mgd Million gallons per day
MDL Maximum Daily Limit or Method Detection Limit
MPN Most Probable Number
NOAA National Oceanic and Atmospheric Administration
NPDES National Pollutant Discharge Elimination System
O&M Operations and maintenance
QAP Quality assurance plan
RP Reasonable Potential
RWC Receiving Water Concentration
SPCC Spill Prevention and Control and Countermeasure
SS Suspended Solids
s.u. Standard Units
TKN Total Kjeldahl Nitrogen
Fact Sheet: WA0021962 - Yakima Training Center Page 5TMDL Total Maximum Daily Load
TRC Total Residual Chlorine
Technical Support Document for Water Quality-based Toxics Control
TSD
(EPA/505/2-90-001)
TSS Total suspended solids
USFWS U.S. Fish and Wildlife Service
UV Ultraviolet
WD Water Division
WLA Wasteload allocation
WQBEL Water quality-based effluent limit
WQS Water Quality Standards
WWTP Wastewater treatment plant
Fact Sheet: WA0021962 - Yakima Training Center Page 6I. Background Information
A. General Information
This fact sheet provides information on the draft NPDES permit for the following entity:
Table 1. General Facility Information
NPDES Permit #: WA0021962
Applicant: Yakima Training Center
Type of Ownership Federal
Physical Address: Department of the Army – Yakima Training Center
Wastewater Treatment Plant (WWTP)
160 North T.P. Road
Yakima, WA 98901-9399
Mailing Address: Yakima Training Center
Directorate of Public Works
970 Fire Center Road, Building 810
Yakima, WA 98901-9399
Facility Contact: Brenda A. Bach
Water/Wastewater Operator
WDMLVII/WWTPOLVII/CCS
Yakima Training Center/DPW
970 Firing Center Road,
Building 831
Yakima, WA 98901-9399
(509) 225-8046
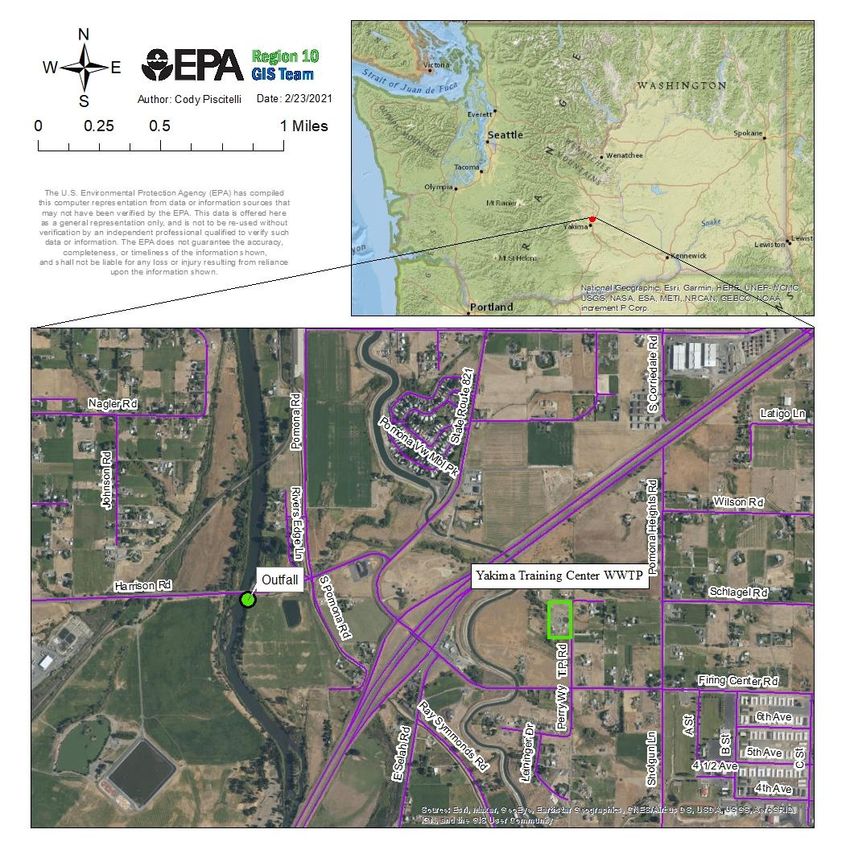
Facility Location: 46.678056° N, 120.472139° W
Receiving Water Yakima River
Facility Outfall 46.679194° N, 120.491056° W
B. Permit History
EPA retains permitting authority over federal facilities in the State of Washington; therefore,
EPA is the permitting authority for this facility. The most recent NPDES permit for the
Yakima Training Center WWTP was issued on February 11, 1975, became effective on
March 13, 1975, and expired on September 30, 1979. An NPDES application was submitted
by the permittee on August 13, 1998. The facility continues to comply with the terms of the
expired NPDES permit.
Fact Sheet: WA0021962 - Yakima Training Center Page 7C. Tribal Consultation
As part of Tribal Coordination, EPA shared the preliminary draft permit and draft fact sheet
with the Yakama Nation prior to public notice for their review.
At the start of the comment period, EPA sent a letter to the Yakama Nation offering the
opportunity for them to request Tribal Consultation on the draft permit.
II. Facility Information
A. Treatment Plant Description
Service Area
The Department of the Army operates the Yakima Training Center WWTP located in
Yakima, WA. The collection system has no combined sewers. The facility serves a resident
population of 100 but increases to around 10,000 during training exercises. There are no
major industries discharging to the facility.
Treatment Process
The design flow of the facility is 0.72 mgd. The reported actual flows from the facility range
from 0.003 mgd to 0.082 mgd (average monthly flow) between July 2015 and November
2020. The treatment process consists of activated sludge, and disinfection using ultraviolet
light. A schematic of the wastewater treatment process and a map showing the location of the
treatment facility and discharge are included in Appendix A. Because the design flow is less
than 1 mgd, the facility is considered a minor facility.
Outfall Description
The outfall consists of an approximately 5000-foot long pipeline varying from 10” to 15”
diameter spanning from the final settling tanks to the Yakima River. The outfall line,
constructed in 1951 and last repaired/relined in 2000, contains 15 manholes, and crosses the
Roza Channel over a dedicated bridge, then passes under Interstate 82 and Highway 821,
with the final discharge location just downstream of the Harrison Street Bridge over the
Yakima River.
Effluent Characterization
To characterize the effluent, EPA evaluated the facility’s application form, discharge
monitoring report (DMR) data, and additional data provided by the Yakima Training Center.
The effluent quality is summarized in Table 2. Data are provided in Appendix B.
Table 2. Effluent Characterization
Parameter Minimum Maximum Limit
TSS Concentration (7-day) 2.3 mg/L 43.0 mg/L 45 mg/L
TSS Concentration (30-day) 2.0 mg/L 19.0 mg/L 30 mg/L
Fact Sheet: WA0021962 - Yakima Training Center Page 8Parameter Minimum Maximum Limit
TSS Loading (7-day) 0.5 lb/day 63.4 lb/day 270 lb/day
TSS Loading (30-day) 0.3 lb/day 13.0 lb/day 180 lb/day
TSS - % Removal 38% 98% 85% (minimum)
BOD Concentration (7-day) 2.8 mg/L 152.0 mg/L 45 mg/L
BOD Concentration (30-day) 2.0 mg/L 31.0 mg/L 30 mg/L
BOD5 Loading (7-day) 0.7 lb/day 58.0 lb/day 270 lb/day
BOD5 Loading (30-day) 0.4 lb/day 17.5 lb/day 180 lb/day
BOD5 - % Removal 70.0% 98% 85% (minimum)
pH 6.2 8.2 6.5-8.5
0 (#/100 mL) 470 (#/100 mL) 400 (#/100 mL)
Fecal Coliform (7-day)
(geomean) (geomean) (geomean)
0 (#/100 mL) 200 (#/100 mL) 200 (#/100mL)
Fecal Coliform (30-day)
(geomean) (geomean) (geomean)
Source: DMR data from ICIS July 2015 – July 2020
Compliance History
A summary of all effluent violations between July 2015 and May 2020 is provided in Table
3.
Additional compliance information for this facility, including compliance with other
environmental statutes, is available on Enforcement and Compliance History Online
(ECHO). The ECHO web address for this facility is: https://echo.epa.gov/detailed-facility-
report?fid=110001855653#history110001855653
Table 3. Summary of Effluent Violations (accessed January 28, 2021)
Number of
Parameter Limit Units
Instances
BOD % Removal Monthly Average mg/L 4
pH Inst. Minimum Standard Units 3
Fecal Coliform Weekly Geomean #/100 mL 1
BOD5 Monthly Average mg/L 1
BOD5 Weekly Average mg/L 1
EPA conducted an inspection of the Facility on June 6, 2017. This inspection encompassed
the wastewater treatment process, records review, operation and maintenance, and the
collection system. Overall, the inspection found that the facility was in generally good
Fact Sheet: WA0021962 - Yakima Training Center Page 9condition; however, with several minor issues. The secondary clarifiers contained duckweed,
dead snails, and brown clumps of floating solids which were observed to be passing through
the outlet weirs of the clarifiers. One of the contact chambers just after the secondary clarifier
contained duckweed and other floating debris. Brown clumps of floating solids were
observed periodically flowing from the UV disinfection to the outfall pipe.
III. Receiving Water
In drafting permit conditions, EPA must analyze the effect of the facility’s discharge on the
receiving water. The details of that analysis are provided in the Water Quality-Based Effluent
Limits section below. This section summarizes characteristics of the receiving water that
impact that analysis.
A. Receiving Water
This facility discharges to the Yakima River approximately 5 miles upstream of
the City of Yakima, Washington. At the point of discharge, the Yakima River is a
water of the State of Washington. The outfall is approximately 14 miles upstream
of the Yakama Nation, and is approximately 114 miles upstream of the
confluence with the Columbia River in Richland, Washington.
B. Water Quality Standards
Overview
Section 301(b)(1)(C) of the Clean Water Act (CWA) requires the development of
limitations in permits necessary to meet water quality standards. 40 CFR 122.4(d)
requires that the conditions in NPDES permits ensure compliance with the water
quality standards of all affected States. A State’s water quality standards are
composed of use classifications, numeric and/or narrative water quality criteria
and an anti-degradation policy. The use classification system designates the
beneficial uses that each water body is expected to achieve, such as drinking
water supply, contact recreation, and aquatic life. The numeric and narrative water
quality criteria are the criteria deemed necessary to support the beneficial use
classification of each water body. The anti-degradation policy represents a three-
tiered approach to maintain and protect various levels of water quality and uses.
Washington Water Quality Standards (WAC 173-201A) were utilized when
developing the effluent limitations in the draft permit.
Designated Beneficial Uses
This facility discharges to the Yakima River in the Upper Yakima Subbasin (HUC
17030001). At the point of discharge, the Yakima River is protected for the
following designated uses (WAC 173-201A-602 Table 602—Use designations for
fresh waters by water resource inventory area (WRIA 39)):
• primary contact recreation
Fact Sheet: WA0021962 - Yakima Training Center Page 10• all water supply uses - domestic, agricultural, industrial, and stock
watering
• salmonid spawning and rearing
• all miscellaneous uses - wildlife habitat, harvesting, commerce and
navigation, boating, and aesthetics
C. Water Quality
The water quality for the receiving water is summarized in Table 4.
Table 4. Receiving Water Quality Data
Parameter Units Percentile Value Source
Flow mgd 5th – 95th 464 – 2575 USGS NWIS
Flow mgd 5th – 95th 233 – 2880 Ecology EIM
Temperature C 95th 1.91 – 20.38 Ecology EIM
pH Standard units 5th – 95th 7.60 – 9.00 Ecology EIM
Hardness mg/L 5th – 95th 34.5 – 66.9 Ecology EIM
Ammonia mg/L 5th – 95th 0.006 – 0.028 Ecology EIM
Fecal Coliform #/100 ml 5th – 95th 1 - 173 Ecology EIM
Source:
United States Geological Survey’s National Water Information System collected at USGS Station 12484500,
Yakima River at Umtanum, WA (46.862778° N, 120.47889° W)
https://waterdata.usgs.gov/nwis/inventory?agency_code=USGS&site_no=12484500
Ecology’s Environmental Information Management System collected at the Harrison Street Bridge, Station ID 06-
YKHA (46.67946° N, 120.4912° W)
https://apps.ecology.wa.gov/eim/search/Detail/Detail.aspx?DetailType=Location&SystemStationId=19630343&Lo
cationUserIdSearchType=Equals&LocationUserId=06-YKHA
D. Water Quality Limited Waters
The State of Washington’s 2012 Integrated Report Section 5 (section 303(d)) lists the
Yakima River, in the vicinity of the Harrison Street Bridge as impaired for pH.
E. Low Flow Conditions
A mixing zone is not included because EPA recommends that state mixing zone
policies do not allow mixing zones for bacteria in waters designated for primary
contact recreation. Calculating low flow is not relevant to this permit. (40 CFR
131.13)
IV. Effluent Limitations and Monitoring
Table 5 below presents the existing effluent limits and monitoring requirements in the
Yakima Training Center Permit.
Fact Sheet: WA0021962 - Yakima Training Center Page 11Table 5. Existing Permit - Effluent Limits and Monitoring Requirements
Yakima Training Center Wastewater Treatment Plant
Unit of Monthly Weekly
Effluent Characteristic
Measurement Average Average
Effluent Concentrations
Biochemical Oxygen Demand,
mg/L 30 45
5-day (BOD5)
Suspended Solids mg/L 30 45
Fecal Coliform Bacteria Number/100 ml 200 400
pH Standard Units Within the range of 6.5 to 8.5
Effluent Loadings
Unit of Monthly Weekly
Effluent Characteristic
Measurement Average Average
BOD5 kg/day (lb/day) 82 (180) 123 (270)
Suspended Solids kg/day (lb/day) 82 (180) 123 (270)
The effluent BOD5 and suspended solids concentrations shall not exceed 15% of the
influent BOD5 and suspended solids concentrations.
Monitoring Requirements
Unit of Sampling Type of
Monitoring Requirements
Measurement Frequency Sample
Total flow cmd (mgd) Continuous Recording
24-hr
BOD5 mg/L Weekly
composite
24-hr
Suspended Solids mg/L Weekly
composite
Fecal Coliform Bacteria Number/100 ml Weekly Grab
pH pH Units Daily Grab
Chlorine Residual mg/L Daily Grab
Yakima Training Center Vehicle Wash Racks
Effluent Characteristics Discharge Limitations Monitoring Requirements
Fact Sheet: WA0021962 - Yakima Training Center Page 12Measurement Sample
Frequency Type
Oil and Grease – mg/L N/A Monthly Grab
Suspended Solids – mg/L N/A Weekly Grab
a. The pH shall not be less than 6.5 standard units nor greater than 8.5 standard units
and shall be monitored weekly
b. There shall be no discharge of floating solids or visible foam in other than trace
amounts
c. Samples taken in compliance with the monitoring requirements specified above
shall be taken at the following location: in open ditch at point where wash rack
discharges are combined, prior to discharge to unnamed water course
Effluent Limitation Changes The vehicle wash racks no longer discharge under this permit;
thus, conditions related to the discharge from the vehicle wash racks have been taken out of
the permit. The facility replaced chlorination treatment with ultraviolet disinfection,
therefore, daily monitoring of chlorine is no longer required. Additional monitoring
requirements are being proposed at this time. Table 7, below, presents the proposed effluent
limits and monitoring requirements in the draft permit.
Table 7. Effluent Limitations and Monitoring Requirements
Effluent Limitations Monitoring Requirements
Parameter Units Average Average Maximum Sample Sample
Monthly Weekly Daily Location Frequency Sample Type
Biochemical 24-hour
mg/L 30 45 -- Influent and
Oxygen Demand 1/week composite1
Effluent
(BOD5) lbs/day 180 270 -- Calculation2
BOD5 Percent 85
% -- -- -- 1/month Calculation3
Removal (minimum)
24-hour
Total Suspended mg/L 30 45 -- Influent and
1/week composite1
Solids (TSS) Effluent
lbs/day 180 270 -- Calculation2
TSS Percent 85
% -- -- -- 1/month Calculation3
Removal (minimum)
CFU/ 100 320 (instant.
E. coli4 (geomean) -- Effluent 1/week Grab
100 ml max)
pH std units Between 6.5 – 8.55 Effluent 1/day Grab
Total Ammonia (as mg /L Report -- Report Grab
Effluent 1/week
N) lbs/day Report -- Report Calculation1
Fact Sheet: WA0021962 - Yakima Training Center Page 13Effluent Limitations Monitoring Requirements
Parameter Units Average Average Maximum Sample Sample
Monthly Weekly Daily Location Frequency Sample Type
Total Phosphorus mg /L Report -- Report Grab
Effluent 1/quarter7
(as P) lbs/day Report -- Report Calculation1
Floating,
Visual
Suspended, or -- See Permit Part I.B.2. 1/month
Observation
Submerged Matter
Influent
Dissolved Oxygen mg/L Report Minimum and Average and 1/month Grab
Effluent
Total Kjeldahl 24-hour
mg/L Report -- Report Effluent 1/quarter6
Nitrogen (as N) composite
Orthophosphate 24-hour
mg/L Report -- Report Effluent 1/quarter6
(as P) composite
24-hour
Nitrate + Nitrite mg/L Report -- Report Effluent 1/quarter6
composite
Flow mgd Report -- Report Effluent Continuous Meter
Temperature °C -- Report Report Effluent 1/week Grab
Effluent Testing for Permit Renewal
Permit
Application
-- Effluent 1/year --
Effluent Testing
Data7
Notes
1. The composite sample must be time proportionate. See Permit Part VI.
2. Loading (in lbs/day) is calculated by multiplying the concentration (in mg/L) by the corresponding flow (in mgd) for the
day of sampling and a conversion factor of 8.34. For more information on calculating, averaging, and reporting loads and
concentrations see the NPDES Self-Monitoring System User Guide (EPA 833-B-85-100, March 1985).
3. Percent Removal. The monthly average percent removal must be calculated from the arithmetic mean of the influent values
and the arithmetic mean of the effluent values for that month using the following equation:
4. The average monthly E. coli bacteria counts must not exceed a geometric mean equal to the effluent limit based on a
minimum of five samples taken every 3 - 7 days within a calendar month. See Permit Part VI. for a definition of geometric
mean.
5. Reporting is required within 24 hours of a maximum daily limit or instantaneous maximum limit violation. See Permit Parts
I.B.2. and III.G.
6. For quarterly monitoring frequency, quarters are defined as: January 1 to March 31; April 1 to June 30; July 1 to September
30; and, October 1 to December 31.
7. Effluent Testing Data - See NPDES Permit Application Form 2A, Table B for the list of pollutants to be included in this
testing. The Permittee must use sufficiently sensitive analytical methods in accordance with Permit Part I.B.7.
Fact Sheet: WA0021962 - Yakima Training Center Page 14A. Basis for Effluent Limits
In general, the CWA requires that the effluent limits for a particular pollutant be the more
stringent of either technology-based limits or water quality-based limits. Technology-based
limits are set according to the level of treatment that is achievable using available
technology. A water quality-based effluent limit is designed to ensure that the water quality
standards applicable to a waterbody are being met and may be more stringent than
technology-based effluent limits.
B. Pollutants of Concern
Pollutants of concern are those that either have technology-based limits or may need water
quality-based limits. EPA identifies pollutants of concern for the discharge based on those
which:
• Have a technology-based limit
• Have an assigned wasteload allocation (WLA) from a TMDL
• Had an effluent limit in the previous permit
• Are present in the effluent monitoring. Monitoring data are reported in the application
and DMR and any special studies
• Are expected to be in the discharge based on the nature of the discharge
The wastewater treatment process for this facility includes both primary and secondary
treatment. Pollutants expected in the discharge from a facility with this type of treatment,
include but are not limited to: five-day biochemical oxygen demand (BOD5), total suspended
solids (TSS), E. coli and fecal coliform bacteria, pH, ammonia, temperature, phosphorus, and
dissolved oxygen (DO).
Based on this analysis, pollutants of concern are as follows:
• BOD5
• DO
• TSS
• E. coli and fecal coliform bacteria
• pH
• Temperature
• Ammonia
• Nitrogen
• Nitrate-Nitrite
• Phosphorus
• Orthophosphorus
C. Technology-Based Effluent Limits
Federal Secondary Treatment Effluent Limits
The CWA requires POTWs to meet performance-based requirements based on available
wastewater treatment technology. Section 301 of the CWA established a required
Fact Sheet: WA0021962 - Yakima Training Center Page 15performance level, referred to as “secondary treatment,” which POTWs were required to
meet by July 1, 1977. EPA has developed and promulgated “secondary treatment” effluent
limitations, which are found in 40 CFR 133.102. These technology-based effluent limits
apply to certain municipal WWTPs and identify the minimum level of effluent quality
attainable by application of secondary treatment in terms of BOD5, TSS, and pH. The
federally promulgated secondary treatment effluent limits are listed in Table 6. For additional
information and background refer to Part 5.1 Technology Based Effluent Limits for POTWs in
the Permit Writers Manual.
Table 6. Secondary Treatment Effluent Limits
Parameter 30-day average 7-day average
BOD5 30 mg/L 45 mg/L
TSS 30 mg/L 45 mg/L
Removal for BOD5 and TSS
85% (minimum) --
(concentration)
pH within the limits of 6.0 - 9.0 s.u.
Source: 40 CFR 133.102
Mass-Based Limits
The federal regulation at 40 CFR 122.45(f) requires that effluent limits be expressed in terms
of mass, except under certain conditions. The regulation at 40 CFR 122.45(b) requires that
effluent limitations for POTWs be calculated based on the design flow of the facility. The
mass-based limits are expressed in pounds per day and are calculated as follows:
Mass-based limit (lb/day) = concentration limit (mg/L) × design flow (mgd) × 8.341
Since the design flow for this facility is 0.72 mgd, the technology-based mass limits for
BOD5 and TSS are calculated as follows:
Average Monthly Limit = 30 mg/L × 0.72 mgd × 8.34 = 180 lbs/day
Average Weekly Limit = 45 mg/L × 0.72 mgd × 8.34 = 270 lbs/day
Chlorine
Chlorination is cited in the existing permit as a form of disinfection to the wastewater prior to
discharge. The facility confirmed that chlorine is no longer used anywhere within the facility.
As chlorine is no longer, EPA proposes to remove the chlorine effluent limits.
1
8.34 is a conversion factor with units (lb ×L)/(mg × gallon×106)
Fact Sheet: WA0021962 - Yakima Training Center Page 16D. Water Quality-Based Effluent Limits Statutory and Regulatory Basis Section 301(b)(1)(C) of the CWA requires the development of limitations in permits necessary to meet water quality standards. Discharges to State or Tribal waters must also comply with conditions imposed by the State or Tribe as part of its certification of NPDES permits under section 401 of the CWA. 40 CFR 122.44(d)(1) implementing Section 301(b)(1)(C) of the CWA requires that permits include limits for all pollutants or parameters which are or may be discharged at a level which will cause, have the reasonable potential to cause, or contribute to an excursion above any State or Tribal water quality standard, including narrative criteria for water quality. The regulations require the permitting authority to make this evaluation using procedures which account for existing controls on point and nonpoint sources of pollution, the variability of the pollutant in the effluent, species sensitivity (for toxicity), and where appropriate, dilution in the receiving water. The limits must be stringent enough to ensure that water quality standards are met and must be consistent with any available wasteload allocation for the discharge in an approved TMDL. If there are no approved TMDLs that specify wasteload allocations for this discharge; all of the water quality-based effluent limits are calculated directly from the applicable water quality standards. Reasonable Potential Analysis and Need for Water Quality-Based Effluent Limits EPA uses the process described in the Technical Support Document for Water Quality-based Toxics Control (TSD) to determine reasonable potential. To determine if there is reasonable potential for the discharge to cause or contribute to an exceedance of water quality criteria for a given pollutant, EPA compares the maximum projected receiving water concentration to the water quality criteria for that pollutant. If the projected receiving water concentration exceeds the criteria, there is reasonable potential, and a water quality-based effluent limit must be included in the permit. Reasonable Potential and Water Quality-Based Effluent Limits The reasonable potential and water quality-based effluent limit for specific parameters are summarized below. pH The water quality standards at WAC 173-201A-200(g), require pH values for the aquatic life use of the River to be within the range 6.5 to 8.5 standard units with a human-caused variation within the above range of less than 0.5 units. Mixing zones are generally not granted for pH, therefore the most stringent water quality criterion must be met before the effluent is discharged to the receiving water. Effluent pH data were compared to the water quality criteria. The effluent data for pH have been between the range of 6.2 and 8.2 standard units. Ambient pH monitoring is being proposed in the draft permit. Fact Sheet: WA0021962 - Yakima Training Center Page 17
Dissolved Oxygen (DO) and BOD5
   Natural decomposition of organic material in wastewater effluent impacts dissolved oxygen
   in the receiving water at distances far outside of the regulated mixing zone. The water quality
   criterion requires DO to be greater than a lowest 1-day minimum of 8.0 mg/L. The BOD5 of
   an effluent sample indicates the amount of biodegradable material in the wastewater and
   estimates the magnitude of oxygen consumption the wastewater will generate in the receiving
   water. Effluent and receiving water monitoring are proposed in the draft permit.
   Ammonia
   Ammonia criteria are based on a formula which relies on the pH and temperature of the
   receiving water, because the fraction of ammonia present as the toxic, un-ionized form
   increases with increasing pH and temperature. Therefore, the criteria become more stringent
   as pH and temperature increase. There are no effluent data for ammonia, so effluent and
   receiving water monitoring are proposed in the draft permit. The draft permit also requires
   that the permittee monitor the receiving water for pH and temperature in order to determine
   the applicable ammonia criteria for the next permit reissuance.
   Temperature
   The Washington water quality standards at WAC 173-201A-200(1)(c) establish criterion for
   the protection of salmonid spawning. As the facility currently does not collect effluent
   temperature monitoring data, the reasonable potential analysis for temperature was unable to
   be calculated. In order to calculate reasonable potential for the next permit, EPA is proposing
   effluent and ambient temperature monitoring.
   E. coli and Fecal Coliform
   The Washington water quality standards at WAC 173-201A-200(2)(b) state that in waters of
   the State of Washington, that are designated for recreation, E. coli organism levels within an
   averaging period must not exceed a geometric mean value of 100 CFU or MPN per 100 mL,
   with not more than 10 percent of all samples (or any single sample when less than ten sample
   points exist) obtained within the averaging period exceeding 320 CFU or MPN per 100 mL.
   Proposed effluent limitations for E. coli are based on the criteria with the geometric mean
   serving as the average monthly and the not to be exceeded value serving as the maximum
   daily.
   The Washington water quality standards at WAC 173-201A-200(2)(b) replaced fecal
   coliform with E. coli as the applicable criteria as of December 31, 2020. As such, the fecal
   coliform effluent limits have been removed from the permit.

   E. Antibacksliding
   Section 402(o) of the Clean Water Act and 40 CFR §122.44 (l) generally prohibit the
   renewal, reissuance or modification of an existing NPDES permit that contains effluent
   limits, permit conditions or standards that are less stringent than those established in the
   previous permit (i.e., anti-backsliding) but provides limited exceptions. For explanation of
   the antibacksliding exceptions refer to Chapter 7 of the Permit Writers Manual Final Effluent
   Limitations and Anti-backsliding.

Fact Sheet: WA0021962 - Yakima Training Center                                             Page 18
The effluent limitations proposed in the draft permit are as or more stringent than the current
   permit, so there is no backsliding.

V. Monitoring Requirements
   A. Basis for Effluent and Surface Water Monitoring
   Section 308 of the CWA and federal regulation 40 CFR 122.44(i) require monitoring in
   permits to determine compliance with effluent limitations. Monitoring may also be required
   to gather effluent and surface water data to determine if additional effluent limitations are
   required and/or to monitor effluent impacts on receiving water quality.
   The permit also requires the permittee to perform effluent monitoring required by the
   NPDES Form 2A application, so that these data will be available when the permittee applies
   for a renewal of its NPDES permit.
   The permit also requires the permittee to perform effluent monitoring required by Table B of
   the NPDES Form 2A application, so that these data will be available when the permittee
   applies for a renewal of its NPDES permit.
   The permittee is responsible for conducting the monitoring and for reporting results on
   DMRs or on the application for renewal, as appropriate, to EPA.

   B. Effluent Monitoring
   Monitoring frequencies are based on the nature and effect of the pollutant, as well as a
   determination of the minimum sampling necessary to adequately monitor the facility’s
   performance. Permittees have the option of taking more frequent samples than are required
   under the permit. These samples must be used for averaging if they are conducted using
   EPA-approved test methods (generally found in 40 CFR 136) or as specified in the permit.

   Monitoring Changes from the Previous Permit
   As listed in Table 7 both the BOD5 and TSS loadings must now be sampled weekly in the
   receiving water, as well as the monthly monitoring of percent removal, in addition to the
   weekly effluent TSS and BOD5 concentration monitoring required in the previous permit.
   Fecal coliform bacteria monitoring is no longer required and has been replaced by effluent
   limits and weekly monitoring of E. coli bacteria. Visual observations for floating, suspended,
   or submerged matter are proposed to be performed monthly. The draft permit proposes
   weekly effluent ammonia monitoring. The draft permit proposes that the receiving water and
   effluent be monitored monthly for dissolved oxygen concentrations and quarterly for
   orthophosphate (as P), Total Kjeldahl Nitrogen (as N), and nitrate-nitrite. Weekly
   temperature monitoring for both effluent and receiving water is also proposed. There is no
   longer a discharge from the Vehicle wash rack so the monitoring from the current permit is
   removed from the draft permit.

Fact Sheet: WA0021962 - Yakima Training Center                                             Page 19
C. Surface Water Monitoring
   In general, surface water monitoring may be required for pollutants of concern to assess the
   assimilative capacity of the receiving water for the pollutant. In addition, surface water
   monitoring may be required for pollutants for which the water quality criteria are dependent
   and to collect data for TMDL development if the facility discharges to an impaired water
   body. No ambient surface water monitoring was required in the previous permit, so Table 7
   presents the proposed surface water monitoring requirements for the draft permit. Surface
   water monitoring results must be submitted with the DMR.

   Table 7. Surface Water Monitoring in Draft Permit

                                                               Sampling             Type of
      Monitoring Requirements         Unit of Measurement
                                                               Frequency            Sample
      Dissolved Oxygen                mg/L                     Monthly              Grab
      Total Ammonia as N              mg/L                     Monthly              Grab
      Temperature                     °C                       Weekly               Grab
      pH                              pH Units                 Weekly               Grab

   D. Electronic Submission of Discharge Monitoring Reports
   The draft permit requires that the permittee submit DMR data electronically using NetDMR.
   NetDMR is a national web-based tool that allows DMR data to be submitted electronically
   via a secure Internet application.

VI.     Other Permit Conditions
   A. Quality Assurance Plan
   The Yakima Training Center is required to update the Quality Assurance Plan within 180
   days of the effective date of the final permit. The Quality Assurance Plan must consist of
   standard operating procedures the permittee must follow for collecting, handling, storing and
   shipping samples, laboratory analysis, and data reporting. The plan must be retained on site
   and made available to EPA and Ecology upon request.

   B. Operation and Maintenance Plan
   The permit requires the Yakima Training Center to properly operate and maintain all
   facilities and systems of treatment and control. Proper operation and maintenance is essential
   to meeting discharge limits, monitoring requirements, and all other permit requirements at all
   times. The permittee is required to develop and implement an operation and maintenance
   plan for their facility within 180 days of the effective date of the final permit. The plan must
   be retained on site and made available to EPA and Ecology upon request.

Fact Sheet: WA0021962 - Yakima Training Center                                             Page 20
C. Environmental Justice As part of the permit development process, EPA Region 10 conducted a screening analysis to determine whether this permit action could affect overburdened communities. “Overburdened” communities can include minority, low-income, tribal, and indigenous populations or communities that potentially experience disproportionate environmental harms and risks. EPA used a nationally consistent geospatial tool that contains demographic and environmental data for the United States at the Census block group level. This tool is used to identify permits for which enhanced outreach may be warranted. The facility is not located within or near a Census block group that is potentially overburdened. The draft permit does not include any additional conditions to address environmental justice. Regardless of whether a facility is located near a potentially overburdened community, EPA encourages permittees to review (and to consider adopting, where appropriate) Promising Practices for Permit Applicants Seeking EPA-Issued Permits: Ways To Engage Neighboring Communities (see https://www.federalregister.gov/d/2013-10945). Examples of promising practices include: thinking ahead about community’s characteristics and the effects of the permit on the community, engaging the right community leaders, providing progress or status reports, inviting members of the community for tours of the facility, providing informational materials translated into different languages, setting up a hotline for community members to voice concerns or request information, follow up, etc. For more information, please visit https://www.epa.gov/environmentaljustice and Executive Order 12898, Federal Actions to Address Environmental Justice in Minority Populations and Low-Income Populations. Fact Sheet: WA0021962 - Yakima Training Center Page 21
D. Standard Permit Provisions
   Permit Parts III., IV. And V. contain standard regulatory language that must be included in
   all NPDES permits. The standard regulatory language covers requirements such as
   monitoring, recording, and reporting requirements, compliance responsibilities, and other
   general requirements.

VII. Other Legal Requirements
   A. Endangered Species Act
   The Endangered Species Act requires federal agencies to consult with National Oceanic and
   Atmospheric Administration Fisheries (NOAA) and the U.S. Fish and
   Wildlife Service (USFWS) if their actions could beneficially or adversely affect any
   threatened or endangered species. A review of the threatened and endangered species located
   in Idaho finds that bull trout, Chinook Salmon (Snake River fall run) and
   steelhead are threatened. Based on the following considerations, EPA concludes that this
   permit has no effect on endangered or threatened species under the jurisdiction of NOAA or
   USFWS.

   Bull Trout
   1. The U.S. Fish and Wildlife Service Recovery Plan for the Coterminous United States
      Population of Bull Trout 2015 identified causes of the Bull Trout listing. They
      are isolation and habitat fragmentation, poaching, non-native species, residential
      development, mining, transportation networks and agricultural practices. Neither Yakima
      Training Center’s WWTP nor any sewage treatment plant is identified as a contributing
      factor to the decline in Bull Trout.
   2. High conservative dilution ratios of more than 300 to 1 (using the lower 5th percentile low
      flow from Table 4 and the design flow of 0.72 mgd).
   3. The design flow is low at 0.72 mgd and the actual flow is only between 0.003 and
      0.082 mgd, with an average actual flow of 0.04 mgd between 2015 and 2020.
   4. Compliance with water quality standards for pH and bacteria at the point of discharge.
   5. This permit requires compliance with the State of Washington Surface Water Quality
      Standards that protect aquatic organisms including threatened and endangered species.

   Steelhead
   Similar factors have likely caused the decline of steelhead. Based on the same reasons listed
   for Bull Trout, EPA determines this permit has no effect on the threatened species under the
   jurisdiction of NOAA or the USFWS.

   B. Essential Fish Habitat
   Essential fish habitat (EFH) is the waters and substrate (sediments, etc.) necessary for fish to
   spawn, breed, feed, or grow to maturity. The Magnuson-Stevens Fishery Conservation and
   Management Act (January 21, 1999) requires EPA to consult with NOAA Fisheries when a
   proposed discharge has the potential to adversely affect EFH (i.e., reduce quality and/or
   quantity of EFH). Essential Fish Habitat in the Upper Yakima consists of all life stages of

Fact Sheet: WA0021962 - Yakima Training Center                                              Page 22
Chinook and Coho Salmon according to NOAA Fisheries (https://www.habitat.noaa.gov/application/efhmapper/index.html - accessed January 22, 2021). There are no Habitat Areas of Particular Concern nor are there EFH Areas Protected from Fishing. The EFH regulations define an adverse effect as any impact which reduces quality and/or quantity of EFH and may include direct (e.g. contamination or physical disruption), indirect (e.g. loss of prey, reduction in species’ fecundity), site specific, or habitat-wide impacts, including individual, cumulative, or synergistic consequences of actions. EPA has prepared an EFH assessment which appears in Appendix C. EPA has determined that reissuance of this permit will not affect EFH in the Yakima River. C. CWA § 401 Certification Section 401 of the CWA requires EPA to seek State certification before issuing a final permit. EPA requested a prefiling meeting with Ecology on April 13, 2021. As a result of the certification, the State may require more stringent permit conditions or additional monitoring requirements to ensure that the permit complies with water quality standards, or treatment standards established pursuant to any State law or regulation. EPA had preliminary discussions with Ecology regarding the 401 Certification during development of the draft permit. EPA will seek State certification and include any resulting permit conditions (if applicable) in the final documents. D. Antidegradation EPA has completed an antidegradation review in Appendix D and finds that it is consistent with the State’s WQS and the State’s antidegradation implementation procedures. Comments on the 401-certification including the antidegradation review can be submitted to Ecology as set forth above (see State Certification on Page 1 of this Fact Sheet). E. Permit Expiration The permit will expire five years from the effective date. VIII. References EPA. 1991. Technical Support Document for Water Quality-based Toxics Control. US Environmental Protection Agency, Office of Water, EPA/505/2-90-001. https://www3.epa.gov/npdes/pubs/owm0264.pdf EPA. 2010. NPDES Permit Writers’ Manual. Environmental Protection Agency, Office of Wastewater Management, EPA-833-K-10-001. September 2010. https://www3.epa.gov/npdes/pubs/pwm_2010.pdf EPA. 2014. Water Quality Standards Handbook Chapter 5: General Policies. Environmental Protection Agency. Office of Water. EPA 820-B-14-004. September 2014. https://www.epa.gov/sites/production/files/2014-09/documents/handbook-chapter5.pdf Fact Sheet: WA0021962 - Yakima Training Center Page 23
U.S. Fish and Wildlife Service. 2015. Recovery plan for the coterminous United States
   population of bull trout (Salvelinus confluentus). Portland, Oregon. xii + 179 pages.
   https://www.fws.gov/pacific/bulltrout/pdf/Final_Bull_Trout_Recovery_Plan_092915.pdf

Fact Sheet: WA0021962 - Yakima Training Center                                       Page 24
Appendix A. Facility Information
      Figure A-1: Yakima Training Center Wastewater Treatment Plant and Outfall Map

Fact Sheet: WA0021962 - Yakima Training Center                                    Page 25
Figure A-2: Yakima Training Center Wastewater Treatment Plant Flow Schematic Fact Sheet: WA0021962 - Yakima Training Center Page 26
Appendix B. Water Quality Data
A. Treatment Plant Effluent Data
Flow, in
BOD,
conduit or BOD, 5- BOD, 5- BOD, 5- BOD, 5- BOD, 5- Solids, Solids, Solids, Solids, Solids, Solids,
Fecal Fecal 5-day,
Parameter thru day, 20 day, 20 day, 20 day, 20 day, 20 total total total total total pH pH total
Coliform Coliform 20 deg.
treatment deg. C deg. C deg. C deg. C deg. C suspended suspended suspended suspended suspended suspended
C
plant
Raw Raw
Monitoring Effluent Effluent Effluent Effluent Effluent Percent Effluent Effluent Effluent Effluent Percent Effluent Effluent Effluent Effluent
Sewage Sewage
Location Gross Gross Gross Gross Gross Removal Gross Gross Gross Gross Removal Gross Gross Gross Gross
Influent Influent
Statistical MO WKLY WKLY MIN % WKLY WKLY MIN % INST INST WKLY MO MO
MO MAX MO AVG MO AVG MO AVG MO AVG
Base AVG AVG AVG RMV AVG AVG RMV MAX MIN GEOMN GEOMN AVG
Limit
MGD mg/L lb/day mg/L lb/day % mg/L lb/day mg/L lb/day % SU SU #/100mL #/100mL mg/L mg/L
Units
Current
Report 30 180 45 270 85 30 180 45 270 85 8.5 6.5 400 200
Limit
07/31/2015 .032 6. 2. 8.4 2.2 90.6 2. .3 8.5 2.2 94. 7.9 6.9 0.00 0.00 65. 75.
08/31/2015 .046 15. 6. 22.0 9.8 94. 3. .35 9.8 4.4 97. 7.6 7.1 11.00 11.00 202. 280.
09/30/2015 .069 12. 7. 15.3 9. 94. 3. .9 9. 5. 95. 7.4 7.1 24.00 24.00 169. 228.
10/31/2015 .05 13. 6. 152.0 58. 87. 3. 1. 11. 4. 94. 7.4 6.8 148.00 49.00 93. 109.
11/30/2015 .037 28. 11. 36.0 14. 85.5 4. 1. 23. 9. 85. 7.4 6.9 19.00 19.00 157. 194.
12/31/2015 .036 21. 6. 22.0 10. 70. 4. 1. 4.5 2. 95. 7.5 7. 208.00 7.50 85. 70.
01/31/2016 .05 25. 10. 30.0 14. 74. 4. 1. 8. 4. 97. 7.4 7. 297.00 143.00 115. 102.
02/29/2016 .049 22. 12. 14.0 7. 91. 5. 1. 4. 4. 97. 8. 6.9 17.20 13.00 136. 187.
03/31/2016 .043 3. 1. 3.0 7. 98. 5. 1. 3. 12. 97. 8.1 7.3 0.00 0.00 138. 144.
04/30/2016 .034 3. 1. 4.0 1.1 96.6 5. 1.5 7. 2. 93. 8. 7.1 2.00 2.00 101. 111.
05/31/2016 .049 6. 3. 6.0 3. 95. 5. 1.6 6. 6. 94. 7.9 7. 36.00 143.00 148. 1474.
06/30/2016 .056 6. 3. 8.5 6. 92.1 5. 2. 9. 7.5 95.6 7.5 6.9 157.00 72.40 123. 90.
07/31/2016 .054 7. 4. 7.0 4. 97. 5. 2. 5. 5. 97. 7.6 6.8 9.75 9.75 181. 177.
08/31/2016 .061 11. 6. 11.0 6. 95.16 5. 2.1 6. 6. 96.1 7.1 6.6 22.00 22.00 200. 317.
09/30/2016 .065 11. 11. 11.0 11. 93. 5. 2.4 7. 7. 96. 7.1 6.5 20.00 81.00 187. 172.
10/31/2016 .071 6. 4. 6.0 4. 96. 5. 2.44 5. 5. 97. 7. 6.5 3.00 1.75 206. 196.
11/30/2016 .041 9. 3. 9.0 3. 93.4 5. 2.6 5. 5. 96. 7.1 6.6 4.00 22.00 127. 183.
12/31/2016 .025 6. 1. 6.0 1. 88. 6. 2.75 7. 7. 92. 7. 6.6 3.00 3.00 144. 109.
01/31/2017 .018 18. 3. 18.0 3. 93.5 6. 2.75 14. 3. 94.5 7. 6.5 46.00 46.00 253. 286.
Fact Sheet: WA0021962 - Yakima Training Center Page 27Flow, in
BOD,
conduit or BOD, 5- BOD, 5- BOD, 5- BOD, 5- BOD, 5- Solids, Solids, Solids, Solids, Solids, Solids,
Fecal Fecal 5-day,
Parameter thru day, 20 day, 20 day, 20 day, 20 day, 20 total total total total total pH pH total
Coliform Coliform 20 deg.
treatment deg. C deg. C deg. C deg. C deg. C suspended suspended suspended suspended suspended suspended
C
plant
Raw Raw
Monitoring Effluent Effluent Effluent Effluent Effluent Percent Effluent Effluent Effluent Effluent Percent Effluent Effluent Effluent Effluent
Sewage Sewage
Location Gross Gross Gross Gross Gross Removal Gross Gross Gross Gross Removal Gross Gross Gross Gross
Influent Influent
Statistical MO WKLY WKLY MIN % WKLY WKLY MIN % INST INST WKLY MO MO
MO MAX MO AVG MO AVG MO AVG MO AVG
Base AVG AVG AVG RMV AVG AVG RMV MAX MIN GEOMN GEOMN AVG
Limit
MGD mg/L lb/day mg/L lb/day % mg/L lb/day mg/L lb/day % SU SU #/100mL #/100mL mg/L mg/L
Units
Current
Report 30 180 45 270 85 30 180 45 270 85 8.5 6.5 400 200
Limit
02/28/2017 .038 15. 10. 15.0 10. 90. 6. 3. 5. 7. 95. 6.9 6.4 40.00 40.00 126. 151.
03/31/2017 .064 17. 12. 17.0 12. 92. 6. 3.05 6. 6. 97. 7.5 6.9 144.00 144.00 233. 246.
04/30/2017 .044 6. 2. 6.0 2. 98. 6. 3.08 5. 5. 98. 7.5 6.9 39.00 39.00 387. 436.
05/31/2017 .039 10. 4. 5.1 12.03 95.25 6. 3.25 8.7 4.1 96. 7.6 6.8 57.00 30.40 191. 211.
06/30/2017 .081 31. 16. 41.0 28. 95. 6. 4. 17. 10.7 94.2 7.6 6.9 400.00 200.00 351. 370.
07/31/2017 .037 14. 5. 16.9 6.6 91. 6. 4. 11.15 4.3 95. 7.6 6.8 9.00 4.00 130. 155.
08/31/2017 .05 6. 3. 7.1 3.9 93. 6. 4. 7.15 3.2 95.2 8. 7. 20.00 6.40 208. 113.
09/30/2017 .066 13. 7. 14.9 8.8 93. 6. 4. 9.3 5.6 97. 7.5 7. 135.00 35.00 181. 203.
10/31/2017 .058 2. 2. 2.8 2. 97. 6. 4. 7.8 4.3 95. 7.7 7.2 1.00 1.00 84. 75.
11/30/2017 .035 15. 4.7 22.7 7. 95. 7. 4.06 13.15 4.8 95. 7.8 6.9 6.00 6.00 557. 359.
12/31/2017 .016 7. 1. 14.3 1.6 94. 7. 4.2 9.7 1.4 94. 7.8 6.9 2.00 2.00 142. 153.
01/31/2018 .019 7. 1. 14.9 2.7 94. 7. 5. 8.4 1.1 96. 7.6 6.8 25.00 8.00 179. 152.
02/28/2018 .012 5. 1. 10.4 1.8 96. 7. 5. 2.3 .7 98. 7.4 6.8 7.00 1.60 381. 189.
03/31/2018 .008 7. .4 11.4 .7 96.8 7. 5. 6. .5 97.75 7.4 6.7 0.00 0.00 287. 278.
04/30/2018 .009 3. 1. 5.6 1. 98. 7. 5. 3.3 1. 98. 7.6 6.3 1.00 0.00 304. 240.
05/31/2018 .01 6. 1. 6.8 1. 96. 7.45 5. 11.3 1.7 94. 7.9 6.6 8.00 8.00 171. 167.
06/30/2018 .031 11. 3. 15.0 4.7 92.75 8. 5. 11.3 3.5 93.25 7.4 6.7 11.00 6.00 142. 179.
07/31/2018 .029 7. 2. 13.9 4.4 90.5 8. 5. 14.6 4.6 89.25 7.6 6.9 2.00 2.00 84. 84.
08/31/2018 .05 7. 3. 9.6 4.2 94.2 8.68 5.6 14.3 6.7 94.6 7.4 6.7 33.00 10.00 143. 148.
09/30/2018 .059 13. 7. 17.8 8.7 94. 9. 6. 12.6 7.8 92. 7.5 6.8 110.00 34.80 163. 240.
10/31/2018 .045 12. 5. 18.3 8.1 93.25 9. 6. 21.95 11.2 91.25 7.1 6.8 30.00 16.50 179. 212.
11/30/2018 .021 11. 2. 29.8 5.5 96. 10. 6. 13.8 2.9 95. 7.8 7.1 1.00 1.00 155. 224.
12/31/2018 .015 4. 1. 7.5 1. 97. 10. 6. 8.6 1. 96. 7.9 7.3 3.00 1.00 139. 172.
01/31/2019 .006 3. 1. 4.0 1. 97. 11. 6. 3.35 1. 97.6 7.9 6.9 3.00 3.00 130. 117.
02/28/2019 .003 10. 1. 12.6 1. 91. 12. 6. 3.85 1. 95. 7.9 7. 33.00 15.00 164. 192.
03/31/2019 .015 20. 1. 34.1 2.8 92.23 14. 6.76 14. 1. 96.96 7.9 6.9 80.00 30.25 290. 262.
04/30/2019 .015 16. 2. 24.5 3.8 96.67 14. 7. 15.5 2.37 97.52 7.54 6.83 400.00 7.00 392. 488.
05/31/2019 .026 24. 7. 73.3 25.7 92.1 14. 7. 43. 9. 92.2 7.5 6.83 134.00 134.00 391. 480.
Fact Sheet: WA0021962 - Yakima Training Center Page 28Flow, in
BOD,
conduit or BOD, 5- BOD, 5- BOD, 5- BOD, 5- BOD, 5- Solids, Solids, Solids, Solids, Solids, Solids,
Fecal Fecal 5-day,
Parameter thru day, 20 day, 20 day, 20 day, 20 day, 20 total total total total total pH pH total
Coliform Coliform 20 deg.
treatment deg. C deg. C deg. C deg. C deg. C suspended suspended suspended suspended suspended suspended
C
plant
Raw Raw
Monitoring Effluent Effluent Effluent Effluent Effluent Percent Effluent Effluent Effluent Effluent Percent Effluent Effluent Effluent Effluent
Sewage Sewage
Location Gross Gross Gross Gross Gross Removal Gross Gross Gross Gross Removal Gross Gross Gross Gross
Influent Influent
Statistical MO WKLY WKLY MIN % WKLY WKLY MIN % INST INST WKLY MO MO
MO MAX MO AVG MO AVG MO AVG MO AVG
Base AVG AVG AVG RMV AVG AVG RMV MAX MIN GEOMN GEOMN AVG
Limit
MGD mg/L lb/day mg/L lb/day % mg/L lb/day mg/L lb/day % SU SU #/100mL #/100mL mg/L mg/L
Units
Current
Report 30 180 45 270 85 30 180 45 270 85 8.5 6.5 400 200
Limit
06/30/2019 .047 19. 10.07 34.1 20.3 92.46 15. 7. 22. 14. 93.56 7.58 6.93 470.00 196.00 219. 248.
07/31/2019 .031 11. 3. 22.3 5.57 91.7 18. 7.1 14.6 3.65 91.06 7.81 6.93 0.00 0.00 94. 121.
07/31/2019 .031 11. 3. 22.3 5.6 91.7 3. 3. 15. 4. 87.4 7.81 6.93 0.00 0.00 94. 121.
08/31/2019 .058 16. 8. 19.1 10.5 92.4 5.01 3.7 20. 11. 90.7 7.58 7.03 96.00 28.00 183. 243.
09/30/2019 .052 11. 5. 11.0 5. 85.4 6. 5.01 9. 4. 91.8 7.51 7.15 11.00 4.00 144. 122.
10/31/2019 .041 13. 4. 28.5 8.1 84.2 6. 6. 12. 4. 88.1 7.5 7.02 28.00 7.00 104. 121.
11/30/2019 .03 11. 4. 14.9 14.88 94.9 7. 6. 8. 3. 95.26 7.51 7.16 18.00 10.00 185. 281.
12/31/2019 .061 20. 2. 5.2 3.88 91.5 7.26 7. 4. 2. 92.2 7.53 6.78 0.00 0.00 73. 69.
01/31/2020 .043 5.27 1.47 8.1 2.51 93.16 8.3 7.26 6. 2. 95.78 7.27 6.76 0.00 0.00 130. 70.
02/29/2020 .06 8.48 4.58 10.0 7.76 96.8 13. 8.3 9. 5.4 97. 6.99 6.63 0.00 0.00 269. 307.
03/31/2020 .082 11. 11.13 14.0 16.76 97.09 14.6 13. 9.1 12.9 96.92 6.99 6.22 4.00 2.00 292. 398.
04/30/2020 7.5 1.48 18.86 4.15 96. 9.9 9.9 16.3 8.1 94.31
05/31/2020 11.04 17.47 19.6 32.2 85. 18.98 4.85 38.6 63.42 91.35
06/30/2020 .038 10.5 5. 15.39 9.9 93.46 12.8 12.8 19.3 12.4 90.22 8.23 7.13 145. 59.00 145. 177.
07/31/2020 .037 6.97 2.16 9.86 3.37 70.88 14.24 4.09 23. 12.9 37.79 7.51 7.27 5. 3.00 64. 61.96
Average 0.04 11.33 4.65 17.98 7.99 92.28 7.66 4.40 11.06 6.07 93.57 7.54 6.86 58.97 29.41 185.17 219.00
Minimum .003 2.00 0.40 2.76 0.70 70.00 2.00 0.30 2.30 0.50 37.79 6.90 6.22 0.00 0.00 64.00 61.96
Maximum .082 31.00 17.47 152.00 58.00 98.00 18.98 13.00 43.00 63.42 98.00 8.23 7.30 470.00 200.00 557.00 1474.00
Count 60 62 62 62 62 62 62 62 62 62 62 60 60 60 60 60 60
Std Dev 0.02 6.40 3.91 20.75 9.19 5.72 3.80 2.68 7.61 8.17 7.71 0.31 0.23 103.65 48.29 96.65 193.02
CV 0.48 0.56 0.84 1.15 1.15 0.06 0.50 0.61 0.69 1.35 0.08 0.04 0.03 1.76 1.64 0.52 0.88
95th
Percentile 0.07 23.90 11.96 35.91 25.43 97.09 14.58 8.25 22.95 12.88 97.74 8.00 7.20 302.15 143.05 387.20 438.20
5th
Percentile 0.01 3.00 1.00 4.06 1.00 84.24 3.00 1.00 3.38 1.00 88.16 7.00 6.50 0.00 0.00 83.45 70.00
90th
percentile 0.06 20.00 10.91 29.98 14.79 97.00 14.00 7.00 19.93 11.18 97.00 7.90 7.13 148.90 86.30 308.70 360.10
Fact Sheet: WA0021962 - Yakima Training Center Page 29You can also read