Triangle Area Water Supply Monitoring Project, North Carolina-Summary of Monitoring Activities, Quality Assurance, and Data, October ...
←
→
Page content transcription
If your browser does not render page correctly, please read the page content below
Prepared in cooperation with the Triangle Area Water Supply Monitoring Project
Steering Committee

Triangle Area Water Supply Monitoring Project,
North Carolina—Summary of Monitoring Activities, Quality
Assurance, and Data, October 2017–September 2019

Open-File Report 2021–1020

U.S. Department of the Interior
U.S. Geological Survey
Cover. Morgan Creek near White Cross, North Carolina. Photograph taken by Jessica L. Cain,
U.S. Geological Survey.
Triangle Area Water Supply Monitoring
Project, North Carolina—Summary of
Monitoring Activities, Quality Assurance,
and Data, October 2017–September 2019

By Cassandra A. Pfeifle, Jessica L. Cain, and Ryan B. Rasmussen

Prepared in cooperation with the Triangle Area Water Supply Monitoring Project
Steering Committee

Open-File Report 2021–1020

U.S. Department of the Interior
U.S. Geological Survey
U.S. Geological Survey, Reston, Virginia: 2021 For more information on the USGS—the Federal source for science about the Earth, its natural and living resources, natural hazards, and the environment—visit https://www.usgs.gov or call 1–888–ASK–USGS. For an overview of USGS information products, including maps, imagery, and publications, visit https://store.usgs.gov/. Any use of trade, firm, or product names is for descriptive purposes only and does not imply endorsement by the U.S. Government. Although this information product, for the most part, is in the public domain, it also may contain copyrighted materials as noted in the text. Permission to reproduce copyrighted items must be secured from the copyright owner. Suggested citation: Pfeifle, C.A., Cain, J.L., and Rasmussen, R.B., 2021, Triangle Area Water Supply Monitoring Project, North Carolina— Summary of monitoring activities, quality assurance, and data, October 2017–September 2019: U.S. Geological Survey Open-File Report 2021–1020, 19 p., https://doi.org/10.3133/ofr20211020. Associated data for this publication: Cain, J.L., Pfeifle, C.A., and Rasmussen, R.B., 2020, Associated data for the Triangle Area Water Supply Monitoring Project, North Carolina, October 2017–September 2019: U.S. Geological Survey data release, https://doi.org/10.5066/P9KQ6KH2. ISSN 2331-1258 (online)
iii

Contents
Abstract�����������������������������������������������������������������������������������������������������������������������������������������������������������1
Introduction����������������������������������������������������������������������������������������������������������������������������������������������������1
Monitoring Network��������������������������������������������������������������������������������������������������������������������������������������2
     Streamflow-Gaging Stations���������������������������������������������������������������������������������������������������������������2
     Water-Quality Sites and Constituents�����������������������������������������������������������������������������������������������2
Quality Assurance�����������������������������������������������������������������������������������������������������������������������������������������8
Streamflow������������������������������������������������������������������������������������������������������������������������������������������������������9
Water Quality��������������������������������������������������������������������������������������������������������������������������������������������������9
Summary�������������������������������������������������������������������������������������������������������������������������������������������������������17
References Cited�����������������������������������������������������������������������������������������������������������������������������������������18

Figures
         1. Map showing locations of Triangle Area Water Supply Monitoring Project
            data-collection sites in the upper Cape Fear and Neuse River Basins,
            North Carolina, October 2017–September 2019�����������������������������������������������������������������������4
         2. Bar graphs showing annual runoff, in inches, measured from October 2017
            through September 2018 and from October 2018 through September 2019, and
            the long-term mean runoff for the period of record at 10 streamflow-gaging
            stations in the Triangle area of North Carolina����������������������������������������������������������������������10
         3. Maps showing sites in the Triangle area of North Carolina with one or
            more measurements of dissolved-oxygen concentration 110 percent, pH
            values >9 standard units, turbidity values >25 nephelometric turbidity ratio
            units for lakes and reservoirs or >50 nephelometric turbidity ratio units
            for streams, and concentrations of chlorophyll a >40 micrograms per liter,
            October 2017–September 2019 ������������������������������������������������������������������������������������������������16

Tables
         1. Water-quality and streamflow monitoring sites for the Triangle Area Water
            Supply Monitoring Project, October 2017–September 2019��������������������������������������������������5
         2. Physical properties measured in the field and chemical constituents
            analyzed at the U.S. Geological Survey National Water Quality Laboratory
            and the Analytical Trace Elements Chemistry and Geochemical Modeling
            of Acid Waters/Redox Chemistry Labs at the U.S. Geological Survey
            Water Mission Area Laboratories, Boulder, Colorado, for the Triangle
            Area Water Supply Monitoring Project and the methods used for analysis,
            October 2017–September 2019���������������������������������������������������������������������������������������������������6
         3. Summary of selected constituent data observed in blank and environmental
            samples from the Triangle Area Water Supply Monitoring Project,
            October 2017–September 2019���������������������������������������������������������������������������������������������������9
         4. Summary of water-quality results for sampled sites in the Triangle Area Water
            Supply Monitoring Project, October 2017–September 2019������������������������������������������������11
iv
Conversion Factors
U.S. customary units to International System of Units
Multiply By To obtain
Length
inch (in.) 25.4 millimeter (mm)
mile (mi) 1.609 kilometer (km)
Flow rate
cubic foot per second (ft3/s) 0.02832 cubic meter per second (m3/s)
Mass
ounce, avoirdupois (oz) 28.35 gram (g)
pound, avoirdupois (lb) 0.4536 kilogram (kg)
ton, short (2,000 lb) 0.9072 metric ton (t)
ton, long (2,240 lb) 1.016 metric ton (t)
Temperature in degrees Celsius (°C) may be converted to degrees Fahrenheit (°F) as follows: °F
= (1.8 × °C) + 32.
Supplemental Information
Water year is defined as the period from October 1 to September 30 and is identified by
the year in which the period ends. For example, water year 2018 is October 1, 2017, to
September 30, 2018.
Specific conductance is given in microsiemens per centimeter at 25 degrees Celsius (µS/cm
at 25 °C).
Turbidity is given in nephelometric turbidity ratio units (NTRU).
Concentrations of chemical constituents in water are given in either milligrams per liter (mg/L)
or micrograms per liter (µg/L).v Abbreviations L liter m meter mg/L milligrams per liter N nitrogen NCDWR North Carolina Division of Water Resources NTRU nephelometric turbidity ratio units NWISWeb U.S. Geological Survey National Water Information System NWQL National Water Quality Laboratory P phosphorous RPD relative percent difference TAWSMP Triangle Area Water Supply Monitoring Program TOC total organic carbon USGS U.S. Geological Survey
Triangle Area Water Supply Monitoring Project,
North Carolina—Summary of Monitoring Activities,
Quality Assurance, and Data, October 2017–
September 2019

By Cassandra A. Pfeifle, Jessica L. Cain, and Ryan B. Rasmussen

                                                                 increase the demand for water from public suppliers, most
Abstract                                                         of which draw from streams and lakes in the region. Growth
                                                                 also brings the threat of greater loads of pollutants and new
      Surface-water supplies are important sources of drinking
                                                                 contaminant sources that could adversely affect water quality
water for residents in the Triangle area of North Carolina,
                                                                 if not properly managed and mitigated.
which is located within the upper Cape Fear and Neuse                  The Triangle Area Water Supply Monitoring Project
River Basins. Since 1988, the U.S. Geological Survey and a       (TAWSMP) has tracked water-quality conditions and long-
consortium of local governments have tracked water-quality       term trends in many of the area’s water-supply lakes, rivers,
conditions and trends in several of the area’s water-supply      and tributaries for over 30 years. The project has progressed
lakes and streams. This report summarizes data collected         in phases, allowing for flexibility in the monitoring network
through this cooperative effort, known as the Triangle Area      and partners, and timely responses to emerging water-quality
Water Supply Monitoring Project, from October 2017 through       concerns. The most recent publication in this series, Pfeifle
September 2018 (water year 2018) and from October 2018           and others (2019), reported results for water years 2016 and
through September 2019 (water year 2019). Major findings for     2017. The objectives of the project for water years 2018 and
this period include the following:                               2019 were as follows:
    • More than 7,500 individual measurements of water qual-          • Extend the existing long-term water-quality dataset for
      ity were made at 20 sites—7 in the Neuse River Basin              nutrients, sediment, major ions, and selected metals to
      and 13 in the Cape Fear River Basin. For the lake sites,          track spatial variations in water quality, loads to reser-
      only measurements from the photic zone and 1 meter                voirs, and long-term water-quality trends.
      below the water surface are documented in this report.
                                                                      • Continue monitoring at tributary sites during high-flow
    • Thirty-six water-quality properties or constituents are           events to increase the understanding of constituent
      presented in this report; the State of North Carolina             concentrations and loads during extreme hydrologic
      water-quality thresholds are presented for 11 of these.           conditions.
    • All observations met the State of North Carolina water-         • Maintain a network of 10 continuous streamflow-
      quality thresholds for water temperature, hardness,               gaging stations in the study area.
      chloride, fluoride, sulfate, and nitrate plus nitrite.
                                                                      • Investigate the occurrence and distribution of addi-
    • The State of North Carolina water-quality thresholds              tional water-quality parameters, including bromide,
      were exceeded one or more times for dissolved                     1,4-dioxane, and chromium (hexavalent, filtered,
      oxygen, dissolved-oxygen percent saturation, pH,                  and total).
      turbidity, and chlorophyll a.
                                                                       Under an agreement with several local governments in
                                                                 North Carolina, the U.S. Geological Survey (USGS) monitors
                                                                 hydrologic conditions and collects water-quality samples.
Introduction                                                     One site in the Triangle area consists only of a streamflow
                                                                 gage. Continuous streamflow is recorded at most stream
     The Triangle area, located within the upper Cape Fear       sites and funded through the TAWSMP and other USGS
and Neuse River Basins, is one of the most rapidly developing    programs. The USGS is responsible for data quality assurance,
areas of North Carolina. Population growth continues to          analysis, and interpretation, providing the data to the public,
2 Triangle Area Water Supply Monitoring Project, North Carolina— Summary, October 2017–September 2019
and maintaining the database in perpetuity. Funding for the In August 2017, sample collection at Little River
project is provided by local government partners (see sidebar) Reservoir (site 5) and Lake Michie (site 7) resumed under
and by the USGS through Cooperative Matching Funds a new 5-year agreement with the Triangle J Council of
(https://www.usgs.gov/mission-areas/water-resources/science/ Governments. Changes in water-quality analyses for
usgs-cooperative-matching-funds?qt-science_center_objects= this reporting period included the addition of bromide,
0#qt-science_center_objects). The Triangle J Council of 1,4-dioxane, and chromium (hexavalent, filtered, and total)
Governments provides organizational support services for and pheophytin a. The data collected as part of this project
the TAWSMP. are available to project partners and the public through the
USGS National Water Information System (NWISWeb)
Triangle Area Water Supply Monitoring Project Partners, database (U.S. Geological Survey, 2020b) and Cain and
2018–19 others (2020).
Chatham County
Orange County
Town of Apex Streamflow-Gaging Stations
Town of Cary
Streamflow records are useful for managing water
City of Durham
supplies and essential for determining instream loads of
Town of Hillsborough
sediment, nutrients, and other constituents, and for interpreting
Town of Morrisville
water-quality trends. The USGS operates 10 continuous-record
Orange Water and Sewer Authority
streamflow-gaging stations funded through the TAWSMP
Triangle J Council of Governments
(table 1). These gages record water levels at 15-minute
U.S. Geological Survey
intervals and display this information along with calculated
For more information on the project, go to
discharge through the USGS NWISWeb database in near-real
https://tawsmp.org/.
time (U.S. Geological Survey, 2020b).
This report summarizes monitoring activities and data Water-Quality Sites and Constituents
collected by the USGS for the TAWSMP from October 2017
through September 2019, which is referred to as water Water-quality data are used to track current conditions
years 2018 (October 2017 to September 2018) and 2019 and analyze long-term water-quality trends and pollutant loads
(October 2018 to September 2019). Hydrologic conditions in the Triangle area. The USGS monitored water quality at
in the Triangle area are also described in this report. Ranges 20 sites in the TAWSMP study area during water years 2018
of concentrations for water-quality in situ measurements and 2019. More than 7,500 individual measurements of the
(dissolved oxygen, pH, specific conductance, water tempera- physical properties and water chemistry of these locations
ture, and turbidity), acid-neutralizing capacity, major ions were made during this time. The parameters measured
(calcium, magnesium, potassium, sodium, bromide, chloride, and the analytical methods used are presented in table 2.
fluoride, silica, and sulfate), nutrients (ammonia plus organic Measurements were made at 7 sites in the Neuse River Basin
nitrogen, ammonia, nitrate plus nitrite as nitrogen, orthophos- and 13 sites in the Cape Fear River Basin.
phate, and phosphorus), 1,4-dioxane, total organic carbon Nine sites at six public water-supply lakes were sampled,
(TOC), chlorophyll a, pheophytin a, chromium (hexavalent, including West Fork Eno River Reservoir (site 1), Little River
filtered, and unfiltered), and suspended sediment are presented Reservoir (site 5), and Lake Michie (site 7) in the Neuse
for each site sampled during this period. The supporting data River Basin, and Cane Creek Reservoir (site 9), University
for this report are available in Cain and others (2020). Lake (site 15), and Jordan Lake (sites 11, 18, 20, 21) in the
Cape Fear River Basin (table 1; fig. 1). Jordan Lake is a large,
multipurpose reservoir managed by the U.S. Army Corps
of Engineers. All four sites in Jordan Lake were sampled
Monitoring Network bimonthly during water years 2018 and 2019. The five smaller
reservoirs are used primarily for water supply; three also
Since the project began in 1988, several adjustments provide recreational access. One site in each of the smaller
were made to the sampling locations, sampling frequency, lakes was sampled six times per year.
and measured constituents. During 2018–19, the TAWSMP Lake samples were collected at multiple depths, but only
monitoring network comprised 22 sites, including streamflow- the samples collected within the photic zone and at 1 meter
gaging stations and stream and lake water-quality sampling (m) below the water surface are summarized in this report.
sites (fig. 1). Water-quality samples were collected at 20 sites Vertical profiles of field parameters (dissolved oxygen, pH,
during this period. Project sampling, analytical methods, and specific conductance, and water temperature) were measured
quality-assurance practices are described in Oblinger (2004). at 1-m depth intervals at the sampling location, along with
water transparency, which was measured by Secchi disk.Monitoring Network 3
Water samples were collected for the analysis of turbidity, sampled by the USGS during selected storm-runoff events,
acid-neutralizing capacity, major ions (calcium, magnesium, including Eno River at Durham (site 3), Little River near
potassium, sodium, bromide, chloride, fluoride, silica, and Orange Factory (site 4), Flat River at Bahama (site 6), Haw
sulfate), nutrients (ammonia plus organic nitrogen, ammonia, River near Bynum (site 10), New Hope Creek near Blands
nitrate plus nitrite, orthophosphate, and phosphorus), (site 12), Northeast Creek near Genlee (site 13), and Haw
1,4-dioxane, TOC, chlorophyll a, pheophytin a, chromium River below B. Everett Jordan Lake dam near Moncure (site
(hexavalent, filtered, and unfiltered), and unfiltered iron 22). These higher flow samples supplement fixed-interval data
and manganese during each sampling trip. In this report, collected by the North Carolina Division of Water Resources
turbidity values are reported in nephelometric turbidity ratio (NCDWR) as part of the Ambient Monitoring System
units (NTRU). Ammonia plus organic nitrogen, ammonia, (https://deq.nc.gov/about/divisions/water-resources/water-
and nitrate plus nitrite are reported in milligrams per liter as resources-data/water-sciences-home-page/ecosystems-branch/
nitrogen (mg/L as N), and orthophosphate and phosphorus are ambient-monitoring-system).
reported in milligrams per liter as phosphorus (mg/L as P). The four supplemental storm-runoff samples from Little
The USGS sampled four stream sites on a bimonthly River near Orange Factory (site 4) were collected using a
basis to measure water-quality field properties, major ions, portable automatic sampler according to USGS protocols
nutrients, 1,4-dioxane, TOC, chromium (hexavalent, filtered, (U.S. Geological Survey, variously dated). Once the prepro-
and unfiltered), and suspended sediment. These sites include grammed water-level condition for the stream was met, water
Eno River at Hillsborough (site 2), Cane Creek near Orange was collected through an intake line and directly composited
Grove (site 8), Morgan Creek near White Cross (site 14), into an 8-liter (L) plastic churn splitter. The samples were
and White Oak Creek (site 19) (fig. 1; table 1). Samples processed within 24 hours of collection using the same
were collected at multiple locations along a transect and processing techniques as the routine samples (U.S. Geological
were composited. Sampling was not conducted during Survey, variously dated). The 1,4-dioxane and TOC samples
no-flow conditions, which occasionally occurred at the were obtained by a grab sample when the 8-L plastic churn
smaller streams. splitter was retrieved from the portable automatic sampler
During water years 2018 and 2019, routine sampling at for processing. Dissolved oxygen, pH, and water temperature
the nine lake sites and the four bimonthly stream sites was were not measured for runoff samples because of changes
conducted according to the planned schedule. The analysis during storage in the automated sampler before processing.
for nutrients (ammonia plus organic nitrogen, ammonia, Occasionally, there was insufficient water to conduct all
nitrate plus nitrite, orthophosphate, and phosphorus), planned analyses. Water-quality results for the seven streams
1,4-dioxane, and TOC in several samples was potentially sampled only during high stream-runoff events likely do not
affected by a partial Federal Government shutdown begin- represent typical water-quality conditions for these sites.
ning in December 2018. The TOC samples were not filtered Acid-neutralizing capacity was determined within a few
or preserved with acid; therefore, the USGS National hours of sampling in the field or the office laboratory using
Water Quality Laboratory (NWQL) did not process the USGS standard methods (U.S. Geological Survey, variously
December 2018 TOC samples due to the potential for dated). The nutrient and major-ions analyses were conducted
microbial degradation after the established holding time was at the USGS NWQL in Denver, Colorado. The 1,4-dioxane
exceeded. The nutrient and 1,4-dioxane results potentially analyses were conducted at the Analytical Trace Elements
affected by a partial Federal Government shutdown are flagged Chemistry and Geochemical Modeling of Acid Waters/Redox
in Cain and others (2020). Chemistry Labs at the USGS Water Mission Area Laboratories
In addition to bimonthly sampling at the four stream in Boulder, Colorado. The water samples were analyzed for
sites, the study design included eight additional stream sites in suspended sediment concentrations at the USGS Eastern
the TAWSMP network to be sampled only during storm-runoff Region Sediment Laboratory in Louisville, Kentucky.
events when water levels rapidly increased because of rainfall
events. During 2018–19, seven additional stream sites were4 Triangle Area Water Supply Monitoring Project, North Carolina— Summary, October 2017–September 2019
79°15' 79° 78°45'
L Flat River
e
ittl
R iver Lake
6 GRANVILLE
Michie
1 7
4
5 Butner
Little River
Burlington ORANGE Reservoir
Mebane Eno River
2 3
Hillsborough Neuse River
Basin
Cane DURHAM
Creek Falls
36°
8 Lake
Durham
Ne w
M
org Carrboro
9 Cane Creek
an
Chapel k
Hop e Creek
ee
Reservoir Hill
Cr
Cr
14
ee
N ortheast
k
University 15 16 Raleigh-Durham
12 International
Lake Airport
13
17
ALAMANCE
Cape Fear
River Basin Cary Raleigh
18
H aw Jordan WAKE
Creek
Ri Lake ak
O
10 W h i t e 19
ve
r
35°45' Bynum
CHATHAM Pittsboro 20 Apex
21
11
22
Shearon
Harris
v Cape Fear Brickhaven Reservoir
er
Ri
D e ep River
LEE
HARNETT
Base from digital files of 0 5 10 MILES
U.S. Geological Survey, 1:100,000-scale hydrography
U.S. Department of Commerce, Bureau of Census, 2016 0 5 10 KILOMETERS
TIGER/Line Files–Political Boundaries
North Carolina Department of Transportation Municipal Boundaries
EXPLANATION
Basin boundary Cape Neuse
16 Streamflow only site and number Fear
21 Lake site and number
14 Stream site and number Location of study area in the Neuse and Cape Fear River
22 Stream site and number for supplemental Basins in North Carolina
storm runoff sampling
Figure 1. Map showing locations of Triangle Area Water Supply Monitoring Project data-collection sites in the
upper Cape Fear and Neuse River Basins, North Carolina, October 2017–September 2019.Monitoring Network 5
Table 1. Water-quality and streamflow monitoring sites for the Triangle Area Water Supply Monitoring Project, October 2017–
September 2019.
[USGS, U.S. Geological Survey; Lake, lake sites sampled bimonthly; Stream (routine), stream sites sampled bimonthly and during runoff; Stream (runoff),
stream sites sampled only during runoff events; n/a, not applicable; --, data were not collected (refer to footnote); SR, secondary road; USACE, U.S. Army Corps
of Engineers]
Data collected October 2017–September 2019
Map no. Site location in North Carolina and USGS station
(fig. 1) number (in downstream order) Water Continuous Period of record for con-
Site type
quality streamflow tinuous streamflow sites
Neuse River Basin
West Fork Eno River Reservoir at dam near
1 Lake Yes n/a n/a
Cedar Grove, 0208480275
2 Eno River at Hillsborough, 02085000 Stream (routine) Yes Yes 1928–1972; 1986–2019
3 Eno River near Durham, 02085070 Stream (runoff) Yes Yes 1963–2019
Little River at SR 1461 near Orange Factory,
4 Stream (runoff) Yes Yes 1987–2019
0208521324
Little River Reservoir at dam near Bahama,
5 Lake Yes n/a n/a
0208524845
6 Flat River at Bahama, 02085500 Stream (runoff) Yes Yes 1925–2019
7 Lake Michie at dam near Bahama, 02086490 Lake Yes n/a n/a
Cape Fear River Basin
8 Cane Creek near Orange Grove, 02096846 Stream (routine) Yes Yes 1989–2019
Cane Creek Reservoir at dam near White Cross,
9 Lake Yes n/a n/a
0209684980
10 Haw River near Bynum, 02096960 Stream (runoff) Yes (USACE)1 1973–2019
B. Everett Jordan Lake, Haw River arm near
11 Lake Yes n/a n/a
Hanks Chapel, 0209699999
12 New Hope Creek near Blands, 02097314 Stream (runoff) Yes Yes 1983–2019
Northeast Creek at SR 1100 near Genlee,
13 Stream (runoff) Yes Yes 1983–2019
0209741955
14 Morgan Creek near White Cross, 02097464 Stream (routine) Yes Yes 1989–2019
University Lake at intakes near Chapel Hill,
15 Lake Yes n/a n/a
0209749990
16 Morgan Creek near Chapel Hill, 02097517 Streamflow only n/a Yes 1983–2019
17 Morgan Creek near Farrington, 02097521 Stream (runoff) No --2 1983–2019
B. Everett Jordan Lake at buoy 12 at Farrington,
18 Lake Yes n/a n/a
0209768310
White Oak Creek at mouth near Green Level,
19 Stream (routine) Yes Yes 2000–2019
0209782609
B. Everett Jordan Lake above U.S. Highway 64
20 Lake Yes n/a n/a
at Wilsonville, 0209799150
B. Everett Jordan Lake at Bells Landing near
21 Lake Yes n/a n/a
Griffins Crossroads, 0209801100
Haw River below B. Everett Jordan Lake dam
22 Stream (runoff) Yes --3 1966–2019
near Moncure, 02098198
1Gage funded through separate agreement with the USACE.
2Streamflow from nearby gage, Morgan Creek near Chapel Hill, North Carolina (USGS station 02097517).
3Streamflow computed from USACE releases from the Jordan Lake dam.6 Triangle Area Water Supply Monitoring Project, North Carolina— Summary, October 2017–September 2019
Table 2. Physical properties measured in the field and chemical constituents analyzed at the U.S. Geological Survey (USGS) National
Water Quality Laboratory (NWQL) and the Analytical Trace Elements Chemistry and Geochemical Modeling of Acid Waters/Redox
Chemistry Labs at the USGS Water Mission Area Laboratories, Boulder, Colorado, for the Triangle Area Water Supply Monitoring Project
and the methods used for analysis, October 2017–September 2019.
[NWIS, National Water Information System;°C, degree Celsius; USGS, U.S. Geological Survey; m, meter; µS/cm at 25 °C, microsiemens per centimeter at
25 degrees Celsius; mg/L, milligram per liter; NTRU, nephelometric turbidity ratio units; pH, negative log (base 10) of the hydrogen ion activity; CaCO3, cal-
cium carbonate; N, nitrogen; P, phosphorus; USEPA, U.S. Environmental Protection Agency; SiO2, silicon dioxide; µg/L, microgram per liter; DA, (automated)
discrete analyzer; ASF, automated segmented flow; Field, analysis performed in the field; USGSWMAL, USGS Water Mission Area Laboratories; USGSSDKY,
USGS-Kentucky District Sediment Lab]
NWIS
Physical property or
Analyzing entity parameter Methodology Method reference
constituent (units)
code1
Transparency, Secchi
Field 00078 Secchi disk Hambrook Berkman and Canova (2007)
disc (m)
Dissolved oxygen Electrometry, luminescence
Field 00300 Rounds and others (2013)
(mg/L) quenching
Electrometry, ion-selective elec-
pH, in standard units Field 00400 Ritz and Collins (2008)
trode
Specific conductance
Field 00095 Electrometry, Wheatstone bridge Radtke and others (2005)
(µS/cm at 25 °C)
Temperature, water
Field 00010 Thermistor Wilde (2006)
(°C)
Turbidity, (NTRU) Field 63676 Nephelometry Anderson (2005)
Calcium, filtered Atomic emission spectrometry,
NWQL 00915 Fishman (1993)
(mg/L) inductively coupled plasma
Magnesium, filtered, Atomic emission spectrometry,
NWQL 00925 Fishman (1993)
(mg/L) inductively coupled plasma
Potassium, filtered Atomic emission spectrometry,
NWQL 00935 Clesceri and others (1998b)
(mg/L) inductively coupled plasma
Sodium, filtered Atomic emission spectrometry,
NWQL 00930 Fishman (1993)
(mg/L) inductively coupled plasma
Acid-neutralizing
Electrometry, ion-selective elec-
capacity (mg/L as Field 00419 Rounds (2012)
trode, titration or pH 4.5
CaCO3)
Bicarbonate, unfil-
Electrometry, ion-selective elec-
tered (mg/L as Field 00450 Rounds (2012)
trode, incremental titration
CaCO3)
Carbonate, unfiltered Electrometry, ion-selective elec-
Field 00447 Rounds (2012)
(mg/L as CaCO3) trode, incremental titration
Bromide, filtered Conductivity, ion-exchange chro-
NWQL 71870 Fishman and Friedman (1989)
(mg/L) matography
Chloride, filtered Conductivity, ion-exchange chro-
NWQL 00940 Fishman and Friedman (1989)
(mg/L) matography
Fluoride, filtered Conductivity, ion-exchange chro-
NWQL 00950 Fishman and Friedman (1989)
(mg/L) matography
Atomic emission spectrometry,
Silica, filtered (mg/L
NWQL 00955 inductively coupled plasma, Fishman (1993)
as SiO2)
digestion
Sulfate, filtered Conductivity, ion-exchange chro-
NWQL 00945 Fishman and Friedman (1989)
(mg/L) matography
Residue on evapora-
tion at 180 °C, NWQL 70300 Gravimetry/evaporation at 180 °C Fishman and Friedman (1989)
filtered (mg/L)Monitoring Network 7
Table 2. Physical properties measured in the field and chemical constituents analyzed at the U.S. Geological Survey (USGS) National
Water Quality Laboratory (NWQL) and the Analytical Trace Elements Chemistry and Geochemical Modeling of Acid Waters/Redox
Chemistry Labs at the USGS Water Mission Area Laboratories, Boulder, Colorado, for the Triangle Area Water Supply Monitoring Project
and the methods used for analysis, October 2017–September 2019.—Continued
[NWIS, National Water Information System;°C, degree Celsius; USGS, U.S. Geological Survey; m, meter; µS/cm at 25 °C, microsiemens per centimeter at
25 degrees Celsius; mg/L, milligram per liter; NTRU, nephelometric turbidity ratio units; pH, negative log (base 10) of the hydrogen ion activity; CaCO3, cal-
cium carbonate; N, nitrogen; P, phosphorus; USEPA, U.S. Environmental Protection Agency; SiO2, silicon dioxide; µg/L, microgram per liter; DA, (automated)
discrete analyzer; ASF, automated segmented flow; Field, analysis performed in the field; USGSWMAL, USGS Water Mission Area Laboratories; USGSSDKY,
USGS-Kentucky District Sediment Lab]
NWIS
Physical property or
Analyzing entity parameter Methodology Method reference
constituent (units)
code1
Ammonia plus
organic nitrogen, Colorimetry, ASF, micro-Kjeldahl
NWQL 00625 Patton and Truitt (2000)
unfiltered (mg/L digestion, acidified
as N)
Ammonia, filtered Colorimetry, DA, salicylate-
NWQL 00608 Fishman (1993)
(mg/L as N) hypochlorite
Nitrate plus nitrite, Colorimetry, DA, enzymatic
filtered (mg/L as NWQL 00631 reduction-diazotization, filtered, Patton and Kryskalla (2011)
N) low-level
Orthophosphate, fil- Colorimetry, DA, phosphomolyb-
NWQL 00671 Fishman (1993)
tered (mg/L as P) date
Phosphorus, unfil- Colorimetry, ASF, alkaline-
NWQL 00665 USEPA (1993)
tered (mg/L as P) persulfate digestion, low level
1,4-Dioxane, unfil-
Mass spectrometry, gas chromatog-
tered, recoverable NWQL 81582 Rose and others (2016)
raphy, purge and trap
(µg/L)
Total organic carbon, Non-dispersive infrared analysis,
NWQL 00680 Clesceri and others (1998a)
unfiltered (mg/L) high-temperature combustion
Chlorophyll a, filtered
NWQL 70953 Fluorescence Arar and Collins (1997)
(µg/L)
Pheophytin a, unfil-
NWQL 62360 Fluorescence Arar and Collins (1997)
tered (µg/L)
Atomic absorption spectrometry,
Chromium(VI),
USGSWMAL 01032 graphite furnace, Zeeman cor- Ball and McCleskey (2003)
filtered (µg/L)
rected
Atomic absorption spectrometry,
Chromium, filtered
USGSWMAL 01030 graphite furnace, Zeeman cor- Ball and McCleskey (2003)
(µg/L)
rected
Chromium, unfiltered, Mass spectrometry, inductively
NWQL 01034 Garbarino and Struzeski (1998)
recoverable (µg/L) coupled plasma, digestion
Atomic emission spectrometry,
Iron, unfiltered, re-
NWQL 01045 inductively coupled plasma, Garbarino and Struzeski (1998)
coverable (µg/L)
digestion
Manganese, unfil-
Mass spectrometry, inductively
tered, recoverable NWQL 01055 Garbarino and Struzeski (1998)
coupled plasma, digestion
(µg/L)
Suspended sediment
USGSSDKY 80154 Gravimetric/filtration ASTM International (2002)
(mg/L)
1Each parameter code is defined in National Water Information (NWIS)Web: https://nwis.waterdata.usgs.gov/usa/nwis/pmcodes.8 Triangle Area Water Supply Monitoring Project, North Carolina— Summary, October 2017–September 2019
The chlorophyll a and pheophytin a analyses were environmental samples were higher than the threshold and
conducted by the USGS NWQL. The NWQL participated in likely were not biased by contamination; therefore, these
the chlorophyll a interlaboratory performance comparisons constituents were not listed in table 3.
(round robins) sponsored by the NCDWR during 2018 and Ammonia was detected in one equipment blank, four
2019 and demonstrated acceptable performance. vehicle blanks, and six field blanks, with a median detection
concentration of 0.01 mg/L. Therefore, environmental ammonia
concentrations ≥0.01 andWater Quality 9 Table 3. Summary of selected constituent data observed in blank and environmental samples from the Triangle Area Water Supply Monitoring Project, October 2017–September 2019. [N, nitrogen; P, phosphorus;
10   Triangle Area Water Supply Monitoring Project, North Carolina— Summary, October 2017–September 2019

constituents (U.S. Environmental Protection Agency, 2020).                             of water-quality thresholds occurred at 19 of the 20 sites for
These criteria apply only to treated potable water—not to raw                          at least 1 constituent. The only site with no exceedances of
water supplies—and are provided solely for reference.                                  water-quality thresholds was Haw River below B. Everett
      Concentration ranges shown in table 4 in bold font indi-                         Jordan Lake dam near Moncure (site 22). Values exceeded
cate that at least one sample for the constituent at that location                     thresholds for 5 water-quality constituents: dissolved oxygen
exceeded a North Carolina water-quality threshold. Some                                (14 samples, 6 lake sites, 1 stream site), dissolved-oxygen
nutrient and 1,4-dioxane values were potentially affected                              percent saturation (21 samples, 9 lake sites, 2 stream sites), pH
by holding-time violations due to the NWQL being closed                                (1 sample, 1 lake site), turbidity (22 samples, 5 lake sites, 8
during a partial Federal Government shutdown (see footnotes                            stream sites), and chlorophyll a (22 samples, 9 lake sites) and
7 and 8 in table 4). Out of the 159 TOC routine samples                                are included in table 4 and figure 3. No exceedances of State
collected during the scope of this report, 17 samples were not                         water-quality thresholds were observed for six constituents:
analyzed due to the partial Federal Government shutdown.                               water temperature, hardness, chloride, fluoride, sulfate, and
Seven TOC samples underwent holding-time violations for                                nitrate plus nitrite (table 4).
other reasons, such as equipment malfunctions. Exceedances

                                        A
                                   40                                                                                 EXPLANATION
                                   35                                                                               Water year 2018 annual runoff
        Annual runoff, in inches

                                   30                                                                               Long-term mean of record

                                   25
                                   20
                                   15
                                   10
                                    5
                                    0
                                        B
                                   40                                                                                 EXPLANATION
                                   35                                                                               Water year 2019 annual runoff
        Annual runoff, in inches

                                   30                                                                               Long-term mean of record

                                   25
                                   20
                                   15
                                   10
                                    5
                                    0
                                            2       3     4     6     8    12    13   14     16     19
                                                Streamflow-gaging station map identification number

       Figure 2. Bar graphs showing annual runoff, in inches, measured from (A) October 2017 through September 2018 (water
       year 2018) and from (B) October 2018 through September 2019 (water year 2019), and the long-term mean runoff for the
       period of record at 10 streamflow-gaging stations in the Triangle area of North Carolina. Map identification numbers and
       the periods of record, which vary among stations, are given in table 1.
Water Quality 11 Table 4. Summary of water-quality results for sampled sites in the Triangle Area Water Supply Monitoring Project, October 2017–September 2019. [Number under site name refers to the map number shown in figure 1 and table 1. NCDWR, North Carolina Division of Water Resources; MCL, maximum contaminant level; SDWR, secondary drinking water regulation; n, number of observations; range, minimum and maximum values; --, not available or con- stituent not sampled; m, meter; mg/L, milligram per liter; >, greater than; 50 Turbidity (NTRU) (streams) -- 12 8.2–23 13 4.1–120 1 260 4 11–590 12 5–32 Hardness, water (mg/L as CaCO3) 100 -- 12 17.0–25.1 13 17.1–36.4 1 18.0 4 14.4–34.9 12 16.7–25.9 Calcium, filtered (mg/L) -- -- 12 3.72–5.48 13 3.93–9.31 1 4.46 4 3.40–8.39 12 3.88–6.12 Magnesium, filtered (mg/L) -- -- 12 1.86–2.77 13 1.78–3.47 1 1.67 4 1.41–3.39 12 1.71–2.58 Potassium, filtered (mg/L) -- -- 12 1.75–3.05 13 1.16–2.52 1 1.85 4 1.08–2.96 12 1.14–2.54 Sodium, filtered (mg/L) -- -- 12 2.80–4.64 13 3.18–6.61 1 4.23 4 2.52–6.95 12 2.47–4.92 Acid-neutralizing capacity (mg/L as CaCO3) -- -- 12 9.6–23.3 13 15.4–34.4 1 10.6 4 9.9–31.1 12 13.6–24.3 Bicarbonate, unfiltered (mg/L as CaCO3) -- -- 12 11.7–28.3 13 18.8–41.8 1 13.0 4 12.0–37.8 12 16.7–29.6 Carbonate, unfiltered (mg/L as CaCO3) -- -- -- -- -- -- -- -- -- -- -- -- Bromide, filtered (mg/L) -- -- 12
12   Triangle Area Water Supply Monitoring Project, North Carolina— Summary, October 2017–September 2019

Table 4. Summary of water-quality results for sampled sites in the Triangle Area Water Supply Monitoring Project,
October 2017–September 2019.—Continued
[Number under site name refers to the map number shown in figure 1 and table 1. NCDWR, North Carolina Division of Water Resources; MCL, maximum con-
taminant level; SDWR, secondary drinking water regulation; n, number of observations; range, minimum and maximum values; --, not available or constituent
not sampled; m, meter; mg/L, milligram per liter; >, greater than; 50
 Turbidity (NTRU)                               (streams)      --      3        21–290      12        2.3–88      12       2.5–19      12       6.4–22      2       73–320
 Hardness, water (mg/L as CaCO3)                  100          --      3       14.7–29.1    12      17.2–26.4     12      23.6–46.6    12      19.3–25.1    2      23.6–32.0
 Calcium, filtered (mg/L)                          --          --      3       3.36–6.94    12      3.91–6.10     12      5.88–11.3    12      4.55–6.19    2      5.74–7.68
 Magnesium, filtered (mg/L)                        --          --      3       1.54–2.87    12      1.74–2.72     12      2.16–4.47    12      1.94–2.39    2      2.25–3.11
 Potassium, filtered (mg/L)                        --          --      3       1.36–2.36    12      1.31–3.24     12      0.78–3.85    12      1.38–3.22    2      3.36–4.32
 Sodium, filtered (mg/L)                           --          --      3       3.03–7.33    12      2.73–6.87     12      4.86–6.87    12      2.97–4.50    2      4.50–14.7
 Acid-neutralizing capacity (mg/L as CaCO3)        --          --      3        8.1–24.0    12      11.9–28.6     12      14.9–44.0    12      15.4–32.9    2      19.5–23.5
 Bicarbonate, unfiltered (mg/L as CaCO3)           --          --      3        9.9–29.2    12      14.5–34.8     12      18.2–53.6    12      18.8–40.0    2      23.7–28.7
 Carbonate, unfiltered (mg/L as CaCO3)             --          --      --           --      --          --        --          --       --         --        --         --
                                                                                                                                                                    0.027–
 Bromide, filtered (mg/L)                          --          --      3
Water Quality 13 Table 4. Summary of water-quality results for sampled sites in the Triangle Area Water Supply Monitoring Project, October 2017– September 2019.—Continued [Number under site name refers to the map number shown in figure 1 and table 1. NCDWR, North Carolina Division of Water Resources; MCL, maxi- mum contaminant level; SDWR, secondary drinking water regulation; n, number of observations; range, minimum and maximum values; --, not available or constituent not sampled; m, meter; mg/L, milligram per liter; >, greater than; 50 Turbidity (NTRU) (streams) -- 12 7.2–33 1 160 2 96–270 12 0.6–20 12 7.8–40 Hardness, water (mg/L as CaCO3) 100 -- 12 24.9–51.0 1 23.2 2 18.5–21.1 12 27.6–53.7 12 22.9–42.1 Calcium, filtered (mg/L) -- -- 12 5.93–13.3 1 6.38 2 4.81–5.60 12 6.66–13.6 12 5.78–11.4 Magnesium, filtered (mg/L) -- -- 12 2.45–4.32 1 1.77 2 1.57–1.73 12 2.52–4.81 12 2.06–3.30 Potassium, filtered (mg/L) -- -- 12 2.31–7.38 1 2.94 2 2.40–2.57 12 0.98–7.21 12 1.27–2.95 Sodium, filtered (mg/L) -- -- 12 6.07–56.5 1 7.61 2 6.26–7.08 12 5.32–10.3 12 4.68–7.55 Acid-neutralizing capacity (mg/L as CaCO3) -- -- 12 19.0–59.4 1 21.2 2 14.9–20.5 12 21.0–56.5 12 15.9–38.2 Bicarbonate, unfiltered (mg/L as CaCO3) -- -- 12 23.1–71.1 1 25.9 2 18.2–25.0 12 25.6–68.7 12 19.4–46.5 Carbonate, unfiltered (mg/L as CaCO3) -- -- 1 3.8 -- -- -- -- -- -- 1 0.5 Bromide, filtered (mg/L) -- -- 12 0.025–1.19 1 0.020 2 0.018–0.023 12 0.011–0.025 12 0.013–0.029 Chloride, filtered (mg/L) 230 (AL) 250 12 6.99–50.3 1 6.44 2 5.58–6.82 12 5.75–13.2 12 4.82–9.13 Fluoride, filtered (mg/L) 1.8 2 12 0.06–0.27 1 0.07 2 0.07–0.08 12 0.03–0.07 12 0.04–0.07 Silica, filtered (mg/L) -- -- 12 2.18–13.7 1 6.30 2 5.95–8.37 12 8.49–16.7 12 11.0–16.4 Sulfate, filtered (mg/L) 250 250 12 5.6–35.7 1 6.48 2 3.55–3.93 12 2.40–6.36 12 2.79–11.1 Residue on evaporation at 180 degrees C, filtered (mg/L) -- -- 12 63–248 1 68 2 47–83 12 66–116 12 62–82 Ammonia plus organic nitrogen, unfiltered (mg/L as N) -- -- 12 0.38–1.2 1 0.82 2 0.73–0.88 12 0.13–2.6 12 0.41–1.3 Ammonia, filtered (mg/L as N) -- -- 12
14   Triangle Area Water Supply Monitoring Project, North Carolina— Summary, October 2017–September 2019

Table 4. Summary of water-quality results for sampled sites in the Triangle Area Water Supply Monitoring Project,
October 2017–September 2019.—Continued
[Number under site name refers to the map number shown in figure 1 and table 1. NCDWR, North Carolina Division of Water Resources; MCL, maximum con-
taminant level; SDWR, secondary drinking water regulation; n, number of observations; range, minimum and maximum values; --, not available or constituent
not sampled; m, meter; mg/L, milligram per liter; >, greater than; 50
                                              (streams)     --      12         8.7–56      13       11–120      12         5.9–22      12         6.6–15        1     9.7
 Hardness, water (mg/L as CaCO3)                100         --      12       23.9–40.4     13      13.9–43.8    12        23.3–35.8    12       23.1–36.2       1    25.4
 Calcium, filtered (mg/L)                        --         --      12       6.09–10.6     13      3.71–11.8    12        5.85–9.10    12       5.86–9.14       1    6.27
 Magnesium, filtered (mg/L)                      --         --      12       2.10–3.40     13      1.13–3.66    12        2.12–3.18    12       2.07–3.28       1    2.36
 Potassium, filtered (mg/L)                      --         --      12       2.19–5.32     13      2.39–5.22    12        2.00–4.32    12       2.24–4.53       1    3.35
 Sodium, filtered (mg/L)                         --         --      12       8.41–32.4     13      4.29–17.6    12        8.36–24.6    12       8.70–28.9       1    9.78
 Acid-neutralizing capacity (mg/L as
   CaCO3)                                        --         --      12       21.2–41.7     13      11.4–44.6    12        20.0–36.6    12       20.0–36.6       1    24.5
 Bicarbonate, unfiltered (mg/L as CaCO3)         --         --      12       25.9–50.6     13      14.0–54.4    12        24.3–44.6    12       24.3–44.3       1    29.8
 Carbonate, unfiltered (mg/L as CaCO3)           --         --      --           --        --         --        --           --        --           --         --      --
 Bromide, filtered (mg/L)                        --         --      12      0.037–0.110    13
Water Quality 15 Table 4. Summary of water-quality results for sampled sites in the Triangle Area Water Supply Monitoring Project, October 2017–September 2019.—Continued [Number under site name refers to the map number shown in figure 1 and table 1. NCDWR, North Carolina Division of Water Resources; MCL, maximum con- taminant level; SDWR, secondary drinking water regulation; n, number of observations; range, minimum and maximum values; --, not available or constituent not sampled; m, meter; mg/L, milligram per liter; >, greater than;
16 Triangle Area Water Supply Monitoring Project, North Carolina— Summary, October 2017–September 2019
A 79°15' 79° 78°45' B 79°15' 79° 78°45'
GRANVILLE GRANVILLE
1 1 7
7
5 5
ORANGE ORANGE
Neuse River Neuse River
Basin Basin
36° DURHAM 36° DURHAM
8
9 9 14
15 15
ALAMANCE ALAMANCE
Cape Fear Cape Fear
River Basin River Basin
Haw WAKE Haw 18 WAKE
19
Ri
Ri
ve r
ve r
35°45' CHATHAM
35°45' CHATHAM
20 21 20
11
Jordan Jordan
Lake Lake
Shearon Shearon
Harris Harris
Cape Fear Reservoir Cape Fear Reservoir
iv e r River iv e r River
pR pR
De e LEE De e LEE
HARNETT HARNETT
C 79°15' 79° 78°45'
EXPLANATION
GRANVILLE
Basin boundary
18
Lake site and number
ORANGE 19 Stream site and number
Neuse River
Basin
36° DURHAM
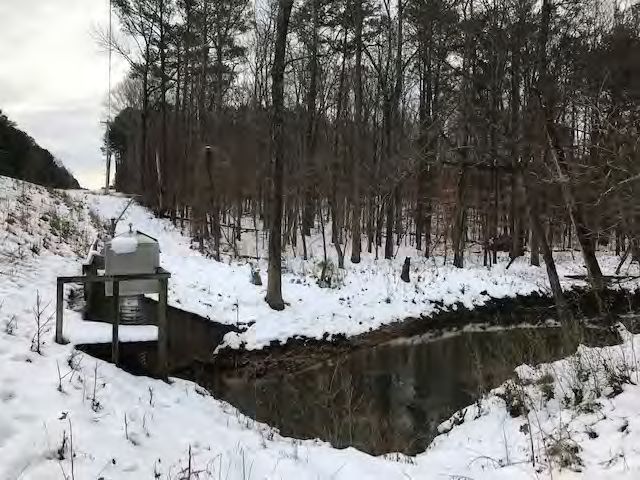
Figure 3. Maps showing sites in the Triangle area
of North Carolina with one or more measurements of
ALAMANCE (A) dissolved-oxygen concentration 110 percent,
Haw WAKE (C) pH values >9 standard units, (D) turbidity values
>25 nephelometric turbidity ratio units for lakes and reservoirs
Ri
ve r
35°45' CHATHAM or >50 nephelometric turbidity ratio units for streams, and
11 (E) concentrations of chlorophyll a >40 micrograms per
Jordan
liter, October 2017–September 2019. Site information is
Lake provided in table 1.
Shearon
Harris
Cape Fear Reservoir
iv e r River
pR
De e LEE
HARNETT
Base from digital files of 0 5 10 MILES
U.S. Geological Survey, 1:100,000-scale hydrography
U.S. Department of Commerce, Bureau of Census, 2016 0 5 10 KILOMETERS
TIGER/Line Files–Political Boundaries
North Carolina Department of Transportation Municipal BoundariesSummary 17
D 79°15' 79° 78°45' E 79°15' 79° 78°45'
6 GRANVILLE GRANVILLE
7 1 7
4
5 5
ORANGE ORANGE
2 3
Neuse River Neuse River
Basin Basin
36° DURHAM 36° DURHAM
9
15 15
12
13
ALAMANCE ALAMANCE
Cape Fear Cape Fear
River Basin River Basin
Haw 18 WAKE Haw 18 WAKE
19
Ri
Ri
10
ve r
ve r
35°45' CHATHAM
35°45' CHATHAM 21 20
11 11
Jordan Jordan
Lake Lake
Shearon Shearon
Harris Harris
Cape Fear Reservoir Cape Fear Reservoir
iv e r River iv e r River
pR pR
De e LEE De e LEE
HARNETT
HARNETT
Base from digital files of 0 5 10 MILES
U.S. Geological Survey, 1:100,000-scale hydrography
U.S. Department of Commerce, Bureau of Census, 2016 0 5 10 KILOMETERS
TIGER/Line Files–Political Boundaries
North Carolina Department of Transportation Municipal Boundaries
EXPLANATION
Basin boundary
18
Lake site and number
19
Stream site and number
10
Stream site and number for supplemental
storm-runoff sampling
Figure 3.—Continued
Summary constituents to determine measures that can be taken to
reduce the uncertainty of results from subsequent environ-
From October 2017 through September 2019, more mental samples.
than 7,500 individual water-quality measurements were Streamflow was below the long-term mean during water
made at 20 sites, and continuous records of streamflow were year 2018 at all sites except for Northeast Creek near Genlee
collected at 10 streamflow-gaging stations in the Triangle Area (site 13), Morgan Creek near White Cross (site 14), Morgan
Water Supply Monitoring Network. The project data-quality Creek near Chapel Hill (site 16), and White Oak Creek
objectives were primarily met by obtaining and reviewing (site 19). During water year 2019, streamflow was above the
blank and replicate samples. Most of the blank detections long-term mean at all ten sites. State water-quality thresholds
were infrequent, and their concentrations were at or near the are available for 11 of the 36 constituents measured. These
censoring levels. Two constituents—ammonia and suspended thresholds were exceeded one or more times for dissolved
sediment—were detected frequently in sample blanks and at oxygen (14 samples, 6 lake sites, 1 stream site), dissolved-
concentrations that could lead to a positive bias in a subset oxygen percent saturation (21 samples, 9 lake sites, 2 stream
of the environmental samples. The replicate pairs indicated sites), pH (1 sample, 1 lake site), turbidity (22 samples, 5 lake
acceptable reproducibility for the water-quality constituents sites, 8 stream sites), and chlorophyll a (22 samples, 9 lake
measured during water years 2018 and 2019 except for sites). No samples exceeded thresholds for water temperature,
ammonia plus organic nitrogen and suspended sediment, hardness, chloride, fluoride, sulfate, and nitrate plus nitrite.
in some cases. The USGS continues to monitor these two18 Triangle Area Water Supply Monitoring Project, North Carolina— Summary, October 2017–September 2019
References Cited Garbarino, J.R., and Struzeski, T.M., 1998, Methods of analy-
sis by the U.S. Geological Survey National Water Quality
Laboratory—Determination of elements in whole-water
Anderson, C.W., 2005, Turbidity (ver. 2.1, September 2005): digests using inductively coupled plasma-optical emission
U.S. Geological Survey Techniques of Water-Resources spectrometry and inductively coupled plasma-mass spec-
Investigations, book 9, chap. A6.7, 55 p., accessed June 26, trometry: U.S. Geological Survey Open-File Report 98–165,
2020, at https://doi.org/10.3133/twri09A6.7. 101 p. [Also available at https://doi.org/10.3133/ofr98165.]
ASTM International, 2002, ASTM standard D3977–97, Hambrook Berkman, J.A., and Canova, M.G., 2007, Algal
Standard test methods for determining sediment concentra- biomass indicators (ver. 1.0, August 2007): U.S. Geological
tion in water samples (2002 ed.): ASTM Compass web- Survey Techniques of Water-Resources Investigations,
site, 6 p., accessed January 15, 2021, at https://compass. book 9, chap. A7.4, 82 p., accessed June 28, 2018, at
astm.org/Standards/HISTORICAL/D3977-97R02.htm. https://doi.org/10.3133/twri09A7.4.
Arar, E.J., and Collins, G.B., 1997, Method 445.0—In vitro North Carolina Department of Environmental Quality, 2020,
determination of chlorophyll a and pheophytin a in marine Surface water standards—NC surface water quality stan-
and freshwater algae by fluorescence (rev. 1.2): Cincinnati, dards tables (updated June 10, 2019): North Carolina
Ohio, U.S. Environmental Protection Agency, 21 p., Department of Environmental Quality website, accessed
accessed August 6, 2018, at https://cfpub.epa.gov/si/si_ May 13, 2020, at https://deq.nc.gov/about/divisions/water-
public_record_report.cfm?Lab=NERL&dirEntryId=309417. resources/planning/classification-standards/surface-water-
Ball, J.W., and McCleskey, R.B., 2003, A new cation- standards#WQSTables.
exchange method for accurate field speciation of hexava- Oblinger, C.J., 2004, Triangle Area Supply Monitoring
lent chromium: U.S. Geological Survey Water-Resources Project, October 1988 through September 2001,
Investigations Report 03–4018, 17 p., accessed June 26, North Carolina—Description of the water-quality network,
2020, at https://doi.org/10.3133/wri034018. sampling and analysis methods, and quality-assurance
Cain, J.L., Pfeifle, C.A., and Rasmussen, R.B., 2020, practices: U.S. Geological Survey Open-File Report
Associated data for the Triangle Area Water Supply 2004–1278, 56 p. [Also available at https://doi.org/10.3133/
Monitoring Project, North Carolina, October 2017– ofr20041278.].
September 2019: U.S. Geological Survey data release, Patton, C.J., and Kryskalla, J.R., 2011, Colorimetric determi-
https://doi.org/10.5066/P9KQ6KH2. nation of nitrate plus nitrite in water by enzymatic reduc-
Clesceri, L.S., Greenberg, A.E., and Eaton, A.D., eds., 1998a, tion, automated discrete analyzer methods: U.S. Geological
High temperature combustion, pt. 5310B of Standard Survey Techniques and Methods, book 5, chap. B8, 34 p.
methods for the examination of water and wastewater [Also available at https://doi.org/10.3133/tm5B8.]
(20th ed.): Washington, D.C., American Public Health Patton, C.J., and Truitt, E.P., 2000, Methods of analysis
Association, American Water Works Association, and Water by the U.S. Geological Survey National Water Quality
Environment Federation, p. 5–20—5–21. Laboratory—Determination of ammonium plus organic
Clesceri, L.S., Greenberg, A.E., and Eaton, A.D., eds., 1998b, nitrogen by a Kjeldahl digestion method and an automated
Metals plasma emission spectroscopy, pt. 3120 of Standard photometric finish that includes digest cleanup by gas dif-
methods for the examination of water and wastewater fusion: U.S Geological Survey Open-File Report 00–170,
(20th ed.): Washington, D.C., American Public Health 31 p. [Also available at https://doi.org/10.3133/ofr00170.]
Association, American Water Works Association, and Water Pfeifle, C.A., Cain, J.L., and Rasmussen, R.B., 2016, Quality
Environment Federation, p. 3–37—3–43. of surface-water supplies in the Triangle area of North
Fishman, M.J., ed., 1993, v. 93–125. Methods of analysis Carolina, water years 2010–11: U.S. Geological Survey
by the U.S. Geological Survey National Water Quality Open-File Report 2016–1002, 19 p., https://doi.org/10.3133/
Laboratory—Determination of inorganic and organic ofr20161002
constituents in water and fluvial sediments, U.S. Geological Pfeifle, C.A., Cain, J.L., and Rasmussen, R.B., 2019, Triangle
Survey Open-File Report, 217 p. [Also available at Area Water Supply Monitoring Project, North Carolina—
https://doi.org/10.3133/ofr93125.]. Summary of monitoring activities, quality assurance, and
Fishman, M.J., and Friedman, L.C., eds., 1989, Methods for data, October 2015–September 2017: U.S. Geological
determination of inorganic substances in water and fluvial Survey Open-File Report 2019–1077, 16 p., https://doi.org/
sediments (3d ed.): U.S. Geological Survey Techniques of 10.3133/ofr20191077.
Water-Resources Investigations, book 5, chap. A1, 545 p.
[Also available at https://doi.org/10.3133/twri05A1.]References Cited 19
Radtke, D.B., Davis, J.V., and Wilde, F.D., 2005, Specific elec- U.S. Environmental Protection Agency, 2020, Secondary
trical conductance (ver. 1.2, August 2005): U.S. Geological drinking water standards—Guidance for nuisance chemicals
Survey Techniques of Water-Resources Investigations, web page: U.S. Environmental Protection Agency web-
book 9, chap. A6.3, 20 p., accessed June 28, 2018, at site, accessed May 13, 2020, at https://www.epa.gov/dws
https://doi.org/10.3133/tm9A6.3. tandardsregulations/secondary-drinking-water-standards-
guidance-nuisance-chemicals.
Ritz, G.F., and Collins, J.A., 2008, pH (ver. 2.0, October 2008):
U.S. Geological Survey Techniques of Water-Resources U.S. Geological Survey, 2020a, Annual water data reports
Investigations, book 9, chap. A6.4, 28 p., accessed June 28, web page: U.S. Geological Survey website, accessed
2018, at https://doi.org/10.3133/twri09A6.4. February 20, 2020, at https://wdr.water.usgs.gov/.
Rose, D.L., Sandstrom, M.W., and Murtagh, L.K., 2016, U.S. Geological Survey, 2020b, USGS water data for the
Determination of heat purgeable and ambient purgeable Nation: U.S. Geological Survey National Water Information
volatile organic compounds in water by gas chroma- System database, accessed February 20, 2020, at
tography/mass spectrometry: U.S. Geological Survey https://doi.org/10.5066/F7P55KJN.
Techniques and Methods, book 5, chap. B12, 61 p.,
https://doi.org/10.3133/tm5B12. U.S. Geological Survey, [variously dated], National field
manual for the collection of water quality data, section
Rounds, S.A., 2012, Alkalinity and acid neutralizing A of Handbooks for water-resources investigations:
capacity (ver. 4.0, September 2012): U.S. Geological U.S. Geological Survey Techniques of Water-Resources
Survey Techniques of Water-Resources Investigations, Investigations, book 9, 10 chap. (A0–A8, A10), accessed
book 9, chap. A6.6, 43 p., accessed June 28, 2018, at September 2, 2020, at https://pubs.water.usgs.gov/twri9A.
https://doi.org/10.3133/twri09A6.6.
Wilde, F.D., 2006, Temperature (ver. 2.0, March 2006):
Rounds, S.A., Wilde, F.D., and Ritz, G.F., 2013, Dissolved U.S. Geological Survey Techniques of Water-Resources
oxygen (ver. 3.0, September 2013): U.S. Geological Investigations, book 9, chap. A6.1, 20 p., accessed June 28,
Survey Techniques of Water-Resources Investigations, 2018, at https://doi.org/10.3133/twri09A6.1.
book 9, chap. A6.2, 55 p., accessed June 28, 2018, at
https://doi.org/10.3133/tm9A6.2.
U.S. Environmental Protection Agency, 1993, Method 365.1—
Determination of phosphorus by semi-automated colorim-
etry (revision 2.0): Cincinnati, Ohio, U.S. Environmental
Protection Agency, 16 p.You can also read