SOUTH DUBLIN COUNTY PUBLIC TRANSPORT REPORT - DRAFT REPORT V2.10
←
→
Page content transcription
If your browser does not render page correctly, please read the page content below
SOUTH DUBLIN COUNTY
PUBLIC TRANSPORT REPORT –
   DRAFT REPORT V2.10
Introduction
Transport Insights, on behalf of South Dublin County Council, has undertaken a study of public
transport provision within the County. The study has emerged as an action of County’s Local Economic
and Community Plan 2016-2021 to undertake a “local transport feasibility study……” to address
“difficulties in securing and accessing employment…. compounded by a lack of public transport”.
The study has incorporated a full review of the public transport network and infrastructure,
accessibility analysis, a survey of local residents and consultation with local businesses. The findings
of this review have been used to identify key public transport accessibility challenges and to
recommend potential future improvements. This report outlines the analysis underpinning the study,
the challenges identified and the emerging recommendations.

Study Approach
The flow chart below outlines the basic approach and methodology to the study. The study consisted
of an initial desktop data gathering exercise before further analysis was undertaken in order to identify
deficits in public transport provision within the County. Consultation with both the general public and
businesses community throughout the study was key to identifying the challenges unique to South
County Dublin, and how these might be addressed.

                                  SDCC Engagement

                                    Desktop Study
                                                                     Public & Business
                                                                       Consultation

                                Network Mapping &
                                Accessibility Analysis

                             Public Transport Gaps &
                             Constraints Identification

                               Option Development &
                                     Appraisal

                                Recommendations &
                                     Phasing

                                South Dublin County
                                  Transport Report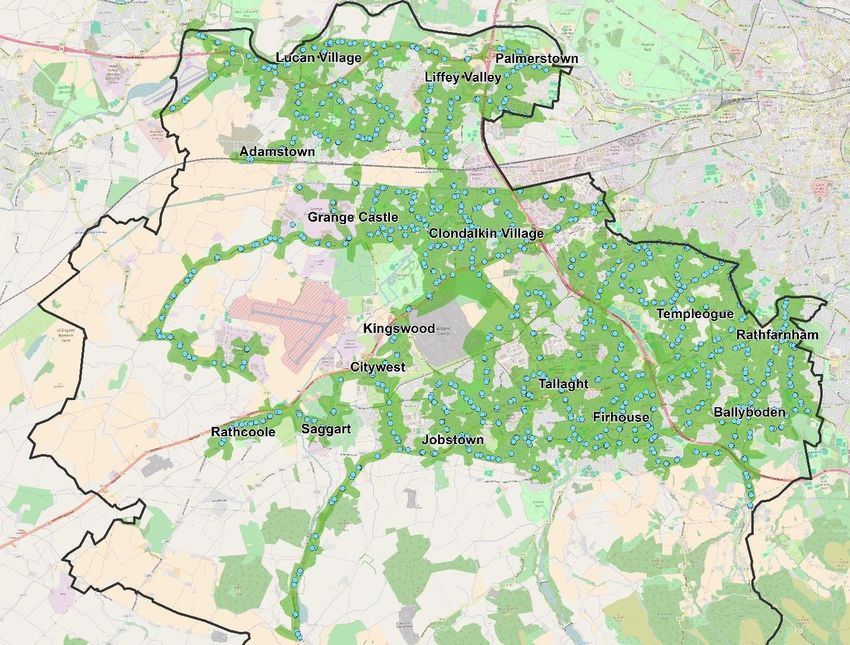
South Dublin County Background
South Dublin County, along with the Dun Laoghaire-Rathdown and Fingal administrative areas, was formed
on the 1st of January 1994 when the Local Government Act of 1993 came into effect. The County has an
approximate area of 223 square kilometres and is bounded by the River Liffey to the north and the Dublin
Mountains to the south.
There are a number of large residential/ employment areas within the County such as Tallaght (the County
Town), Lucan, Clondalkin, Jobstown, Firhouse, Ballyboden, Templeogue, Rathfarnham, Rathcoole, Citywest,
Palmerstown, Adamstown and Saggart.
In transport terms, the County is served by a both a heavy and light rail line as well as a network of bus
services. There are a number of strategic national roads running through the County namely the N4, N7
and N81 which are linked by the M50 and two outer orbital regional routes.
Population
The total population of South Dublin
County, as per the 2011 Census, was
265,205. Preliminary results from
the 2016 Census indicate that the
County’s population has increased to
278,749, representing growth of
5.1% in just 5 years.
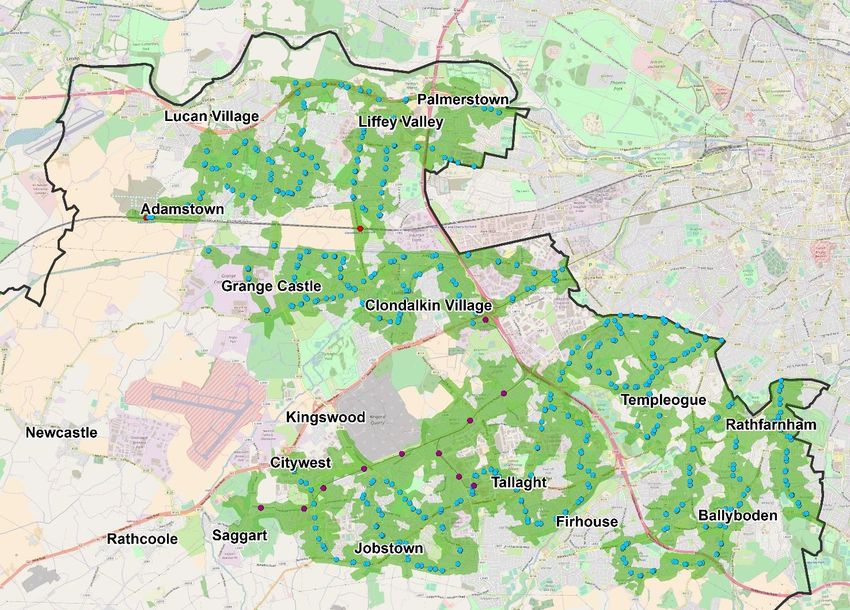
The map to the right illustrates the
approximate population distribution
throughout the County. As
illustrated, the vast majority of the
County’s population is centred on a
number of urban centres, namely
Lucan, Clondalkin, Tallaght, Firhouse
and Templeogue. Approximately
96% of the population resides in only
29% of the total County land area.
South Dublin County 2011
Population Distribution
Note: Each Dot shown represents 10 people
Employment
The total number of people employed in
South Dublin County is approximately
78,110, according to 2011 Census figures.
The distribution of jobs throughout the
County is shown in the map to the left.
Nearly half (48%), of these workers also
resided within South Dublin County. It
should be noted that unemployment in
South Dublin (11.6%) is significantly higher
than that of the other local authorities
surrounding Dublin City, i.e. Fingal at 9.8%,
and Dun Laoghaire-Rathdown at 6.0%.
By comparing the map on the left with the
above population map, the distinct
separation of residential areas and
South Dublin County 2011 employment areas is apparent suggesting
Employment Distribution there a lack of mixed development within
Note: Each Dot shown represents 5 people the County.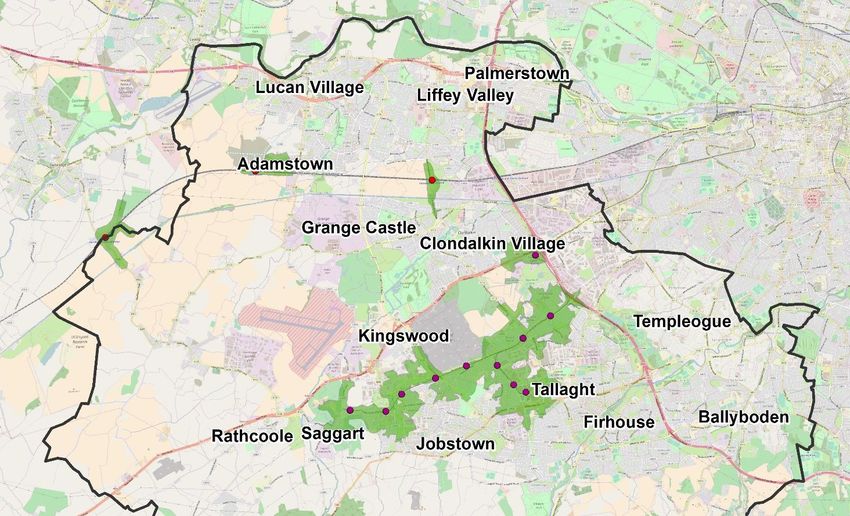
Population Demographics
In order to fully understand the public transport needs of the residents of South Dublin County, it
important to understand the social demographics of the population. Age, employment status, and
level of car ownership all play a part in determining the public transport needs of the County. The
population demographics for South Dublin have been extracted from the 2011 Census data and
compared against that of Fingal and Dun Laoghaire-Rathdown County, where relevant, in order to
assess how the needs of South Dublin differ to the other counties surrounding Dublin City.
Population Age
South Dublin Fingal Dún Laoghaire-Rathdown
The Census data shows that
25%
South Dublin County has a
% of Total Population
comparatively lower proportion 20%
of older residents than Dun
15%
Laoghaire which is in part due to
the levels of new development 10%
in the County attracting younger
5%
families. However, South Dublin
does have an older population 0%
than that of Fingal.
Age Band
The location of older residents within
the County is particularly important
when considering public transport
needs due to lower levels of private
car ownership amongst older people
and their resulting higher dependency
on public transport and other means
of non-private car travel.
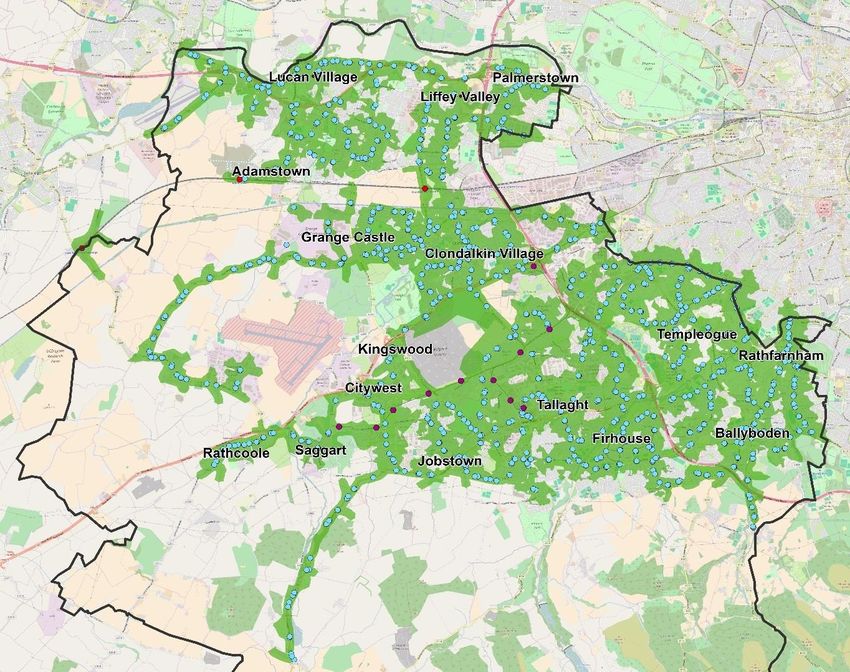
The map to the left shows the
population density of over 65s living
within South County Dublin. As
illustrated, the older population of
South Dublin is largely concentrated
in the Templeogue, Knocklyon and
Ballyboden areas with additional
older communities in well-established
residential areas of Lucan, Tallaght,
South Dublin County 2011
Clondalkin and Palmerstown.
Population Density Over 65s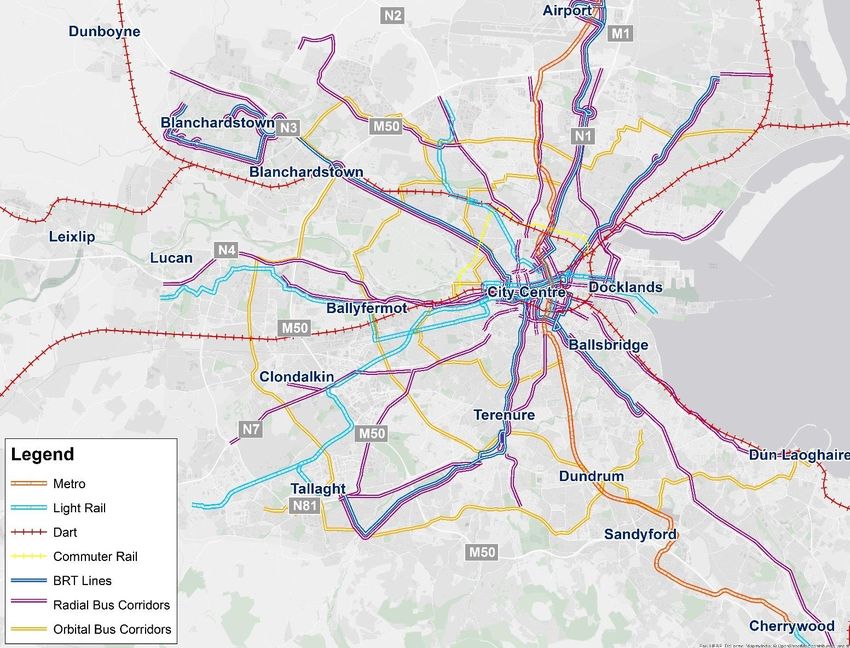
Car Ownership                                          50%
     Information on car ownership
                                                            40%
     was also extracted from the 2011

                                          % of Households
     Census data for South Dublin,
                                                            30%
     Fingal and Dun Laoghaire-
     Rathdown. The data shows that                          20%
     South Dublin has a higher
     proportion of households with no                       10%
     car than either Fingal or Dun
                                                            0%
     Laoghaire-Rathdown, as shown in
                                                                  No motor One motor Two motor  Three      Four or
     the graph to the right. This would
                                                                     car      car      cars    motor cars more motor
     suggest that public transport has                                                                       cars
     a more significant role to play in                           South Dublin    Fingal     Dún Laoghaire-Rathdown
     accommodating the transport
     needs of South Dublin residents.
                                                                                                       Mode Share
     As part of the national Census, information is gathered on commuting to work and education, including
     choice of mode. The mode shares by each mode for South Dublin is presented in the pie chart below
     which shows a mode share of 61.9% for road based modes (i.e. car driver or passenger). This road mode
     share is higher than both Fingal (59.5%) and Dun Laoghaire-Rathdown (55.2%).

                                                                                   Walking              1.5%
                                                                                                               17.3%
                                                                                   Cycling
                                                                                                                  3.1%
                                                                                   Bus

                                                                                   Rail                           14.3%
                                                                                               61.9%
                                                                                   Road                          2.0%

                                                                                   Other

                                                                             The County’s combined public transport
                                                                             mode share, including both bus and rail, is
                                                                             16.3%. This is significantly lower than those
                                                                             of Fingal (20.5%) and Dun Laoghaire-
                                                                             Rathdown (22.5%), both of which have
                                                                             more extensive high quality heavy rail
                                                                             coverage than South Dublin. As a result,
                                                                             South Dublin is more dependent on bus,
                                                                             with its bus mode share higher than both of
                                                                             the other two local authority areas. The
                                                                             map to the left shows the public transport
South Dublin County 2011                                                     mode share across South Dublin (darker
Public Transport Mode Share                                                  areas indicating greater levels of use).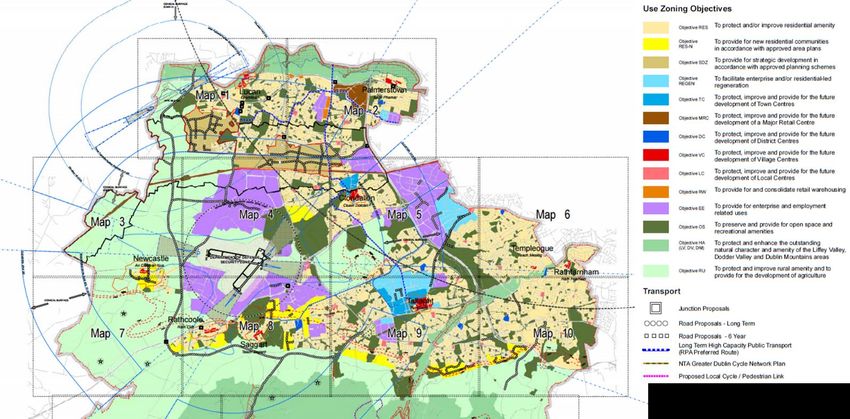
Transport Network Review
As mentioned previously South Dublin is located between a number of strategic national roads namely
the M50, N4 and N7. These roads are among the busiest national roads in the country with the section
of the M50 between the N4 and N7 the most trafficked section of road nationally. The congestion
along these routes is exacerbated by the significant increase in traffic volumes as they pass through
South Dublin. The image below extracted from Google Maps shows the congestion during the AM peak
along the M50, N4, N7 and N81, in addition to non-national roads such as Fonthill Road and Nangor
Road.

                       Existing AM Congestion Levels (© 2016 Google Maps)
According to Transport Infrastructure Ireland traffic counter data, traffic on the N4 increases by 79%
as it passes through South Dublin County, which would suggest that strategic routes intersecting South
Dublin are being heavily used by residents to undertake more localised trips around Dublin. This is
likely to be in part due to the lack of viable public transport options available to residents making these
trips. The public transport network is discussed in detail later in this report. Considering the current
levels of congestion and demand management proposals for the M50, N4 and N7, public transport will
likely need to play an increasingly important role in accommodating South Dublin County’s transport
needs.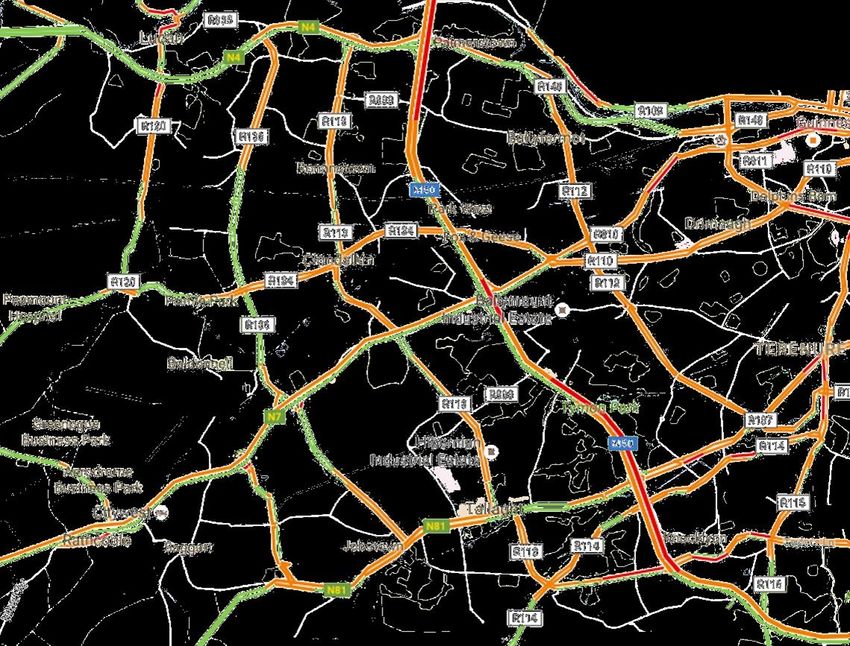
Policy Context
South Dublin County Council Development Plan 2016-2022
The SDCC Development Plan was adopted earlier this year and has highlighted two long term public
transport corridors, one extending radially through the north of the County and one orbital route from
Tallaght up to west of Liffey Valley, with the two interchanging at what is currently St. Loman’s
Roundabout. The Plan also contains a proposal to develop an additional link road between the N4, N7
and N81. In terms of land use planning, there are large residential areas planned for Adamstown and
Clonburris and employment development zoned around the existing employment centres of Citywest,
Greenogue Business Park, Grange Castle and Nangor/ Longmile Road as shown below.

 South Dublin County Local Economic & Community Plan 2016-2021
 South Dublin County Local Community
 Development Committee was established
 in 2013, and a 6-year Local Economic and
 Community Plan (2016-2021) was
 produced in 2015. The Plan contains a
 series of goals and objectives under seven
 thematic headings.
 In promoting enterprise and employment,
 the Plan recognises that “large scale inward
 investment projects have key physical
 requirements including…. accessibility to a
 large pool of potential employees.”
To address poverty and inclusion challenges, the Plan recognises the “difficulties in securing and
accessing employment can be compounded by a lack of public transport...” and contains an
objective to “increase accessibility to existing services”, and an action to undertake a “local
transport feasibility study……”

Greater Dublin Area Transport Strategy 2016-2035
The Greater Dublin Area Transport Strategy sets out proposed transport infrastructure schemes to
be built by 2035. Early this year the Strategy was approved by the Minister for Transport, making
the document statutory. Key public transport schemes included in the Strategy include metro, light
rail and high quality bus corridors as outlined in the map below. The schemes include a light rail
scheme to Lucan and an orbital bus corridor running through South Dublin County which would
provide a high quality public transport link between the north and south of the County. A cross-city
bus rapid transit (BRT) scheme linking Clongriffin to Tallaght is also included.

      Greater Dublin Area Transport Strategy 2016-2035 – Public Transport Infrastructure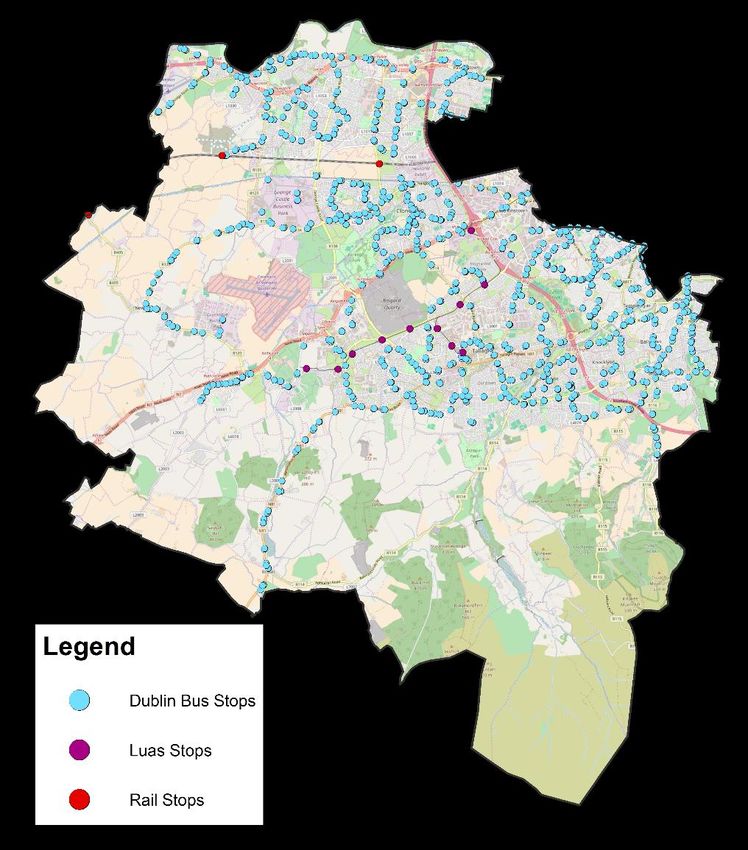
Public & Business Consultation
As part of study, consultation with both residents and businesses within South Dublin County was
undertaken in order to better understand the public transport needs of each group.

Public Consultation
Public consultation was undertaken by means of an online survey prepared and issued by the South
Dublin County Public Participation Network (PPN), within inputs from the study team. The survey took
place during October 2016 and was available online for approximately 2 weeks. The survey received
over 400 responses from residents across the County. The survey consisted of eight questions which
aimed to identify the key challenges/ limitations of public transport within South Dublin from the
perspective of its residents. The first question identified the where respondents lived, as detailed below.

Q1. Where do you live?

       Lucan                                                                                     32%
Rathfarnham                                             16%
     Tallaght                                     13%
   Clondalkin                               11%
       Other                        8%
   Knocklyon                   6%
  Ballycullen             4%
   Rathcoole           3%
Walkinstown          2%
Palmerstown          2%
 Templeogue          2%
   City West      1%
  Kingswood       1%

 As shown on the above graph, the highest number of responses come from residents of Lucan, 126 in
 total. There were also high responses from Rathfarnham, Tallaght and Clondalkin. In order to
 understand how views varied throughout the County, the above settlements were grouped into similar
 areas geographically and/ or areas served by the same public transport corridor. The results for these
 areas were analysed individually, in addition to the County as a whole to allow key problems unique to
 specific areas within South Dublin to be identified. The relevant differences are presented after the
 County-wide survey results.
Q2. Outside your local area and WITHIN South County Dublin, what type of services
do you have the greatest difficulty in accessing by public transport?
20%
% of Responses
15%
10%
5%
0%
The above graph indicates that public transport access to health and hospital facilities along with public
transport stations are the most difficult for residents to access within the County itself. In addition,
access for commuting purposes to employment and education is considered difficult, along with access
to retail and cultural centres.
Q3. Outside your local area and WITHIN South County Dublin, what destinations do
you have the greatest difficulty in accessing by public transport?
20%
15%
% of Responses
10%
5%
0%
In terms of specific destinations within South Dublin County (and noting high response rate from Lucan),
Liffey Valley Town Centre and Lucan Village are considered the most difficult to access by public
transport. This is likely reflective of both difficulty accessing and higher potential demand for travel to
these locations but it does indicate that access to the north of the County is a particular issue. In
addition, Tallaght Town Centre, Clondalkin, Citywest and Ballymount are also perceived as difficult to
access by public transport by residents of South Dublin.Q4. Outside your local area and OUTSIDE South County Dublin, what destinations
and services do you have the greatest difficulty in accessing by public transport?
40%
30%
% of Responses
20%
10%
0%
City Centre Destinations Education Employment Health / Train / bus Other
around M50 hospitals stations
Destinations around the M50 are considered the most difficult to access outside the County itself by
residents of South Dublin reflecting the lack of orbital public transport options in Dublin. Also ranked
highly in terms of difficulty to access using public transport are health and hospital facilities closely
followed by train/ bus stations.
Q5. What is the greatest obstacle(s) for you in using public transport?
25%
20%
% of Responses
15%
10%
5%
0%
Lack of choice of destinations is considered by residents of South Dublin to be the greatest obstacle in
using public transport followed by unpredictable journey times, unreliable services and fare costs.
This is reflective of the lack of orbital services with most services routed to/ from the City Centre via
the most direct route, and with few other destinations being served by frequent services.Q6. What is your age bracket?
40%
30%
% of Responses
20%
10%
0%
17 or under 18 - 24 25 - 34 35 - 44 45 - 54 55 - 64 65 or over
As shown above, the response rate from younger (Q8. Is there anything else you want to say about using public transport in South
Dublin County?
While it is not possible to detail all responses to this survey question, the broad points made by
residents are as follows:
Orbital services linking destinations within the County;
Feeder bus services to key destinations, particularly hospitals, and public transport hubs;
Dedicated bus lanes are currently underutilised and improvements to stop infrastructure
needed;
Unreliable journey times which are significantly higher than competing car journey times;
New public transport options including opening of Kishogue train station, new Luas line to
Clondalkin-Lucan, park and ride facilities and cycle parking at stations;
Information on available services in the area is not readily available;
Security issues and anti-social behaviour;
Improvement to school bus network;
Inadequate space for wheelchair users when more than one user or buggies on board;
The majority of services are routed through the City Centre resulting in increased/
uncompetitive journey times; and
Comments on individual bus services in particular the 15, 25, 76 and 16.
Below is a sample of comments made in the survey by individual residents.
“Like most of South Dublin, Knocklyon is well served by public transport to the City Centre. However, there are very few
links between the main urban centres in South Dublin. This means that even the short journey from Knocklyon to Tallaght
requires 2 buses, making it an unreasonable journey compared with driving (10 minutes’ vs 1 hour). More of these routes
would make the whole of South Dublin and beyond accessible for work, education, etc.”
“I use the Luas to and from “Despite a network of bus specific lanes, there are no direct bus services between
work an hour each day. My Lucan & Clondalkin and Lucan & Tallaght. If such services were introduced, they could
biggest concern is safety. help reduce traffic levels and provide viable options for people in those areas to
The red line is not safe.” commute by bus.”
“I live in Bawnogue and there is no “I live in hillcrest Lucan. I cannot get my “Most bus services
connecting bus to Liffey Valley or the children to the hospital in Crumlin unless I within Dublin go via
Square. My daughter is disabled and walk all the way over to the other side of the City Centre. So it
when going into town if there is a Lucan ....to get the 25a over to the 151 stop takes hours to make
buggy or another wheelchair I can't get then get that bus to the hospital it's a journeys that would
on the bus.” disgrace...” take half an hour by
car.”
“I would like to have a “Work in Sandyford and public transport options are not
feeder bus to Luas and good. Luas to town and Luas out - 1.5 hours. 75 bus -
local bus to Liffey Valley between 40 minutes and 60 minutes. Driving usually 15-
and the Square.” 20 minutes.”Survey Results – By Area
As discussed earlier, the results were broken down by area in order to examine whether responses
differed significantly from the County as a whole. A total of five areas were identified, the table below
show the grouping of settlements into these areas.
SDC North SDC Central SDC South SDC East SDC West
Lucan Clondalkin Tallaght Rathfarnham Rathcoole
Palmerstown Walkinstown Ballycullen Citywest
Knocklyon Kingswood
Templeogue Newcastle
Saggart
It was found that responses only varied significantly for questions 2 and 3 of the survey which related
to access to services and destinations within South Dublin. These questions are presented below
broken down by area.
Q2. Outside your local area and WITHIN South County Dublin, what type of services
do you have the greatest difficulty in accessing by public transport?
SDC North SDC South SDC Central SDC East SDC West
25%
% of Responses
20%
15%
10%
5%
0%
Residents of SDC North, which compromises Lucan and Palmerstown, have much greater difficulty,
relative to other parts of the County, in accessing health facilities/ hospitals and some difficulty
accessing other services such as banking/ post office, community centres as well education and
employment. However, they have comparatively less difficulty accessing shopping facilities and train/
bus stations.Residents of SDC South, i.e. Tallaght, have the greatest perceived difficulty in accessing services such
as banking/ post offices, community centres and parks as well as education and employment. Services
such as shopping, hospitals and public transport stations are considered easier to access by the
residents of Tallaght, relative to the rest of the County.
SDC Central residents, those living in Clondalkin or Walkinstown, have the greatest perceived difficulty
in accessing health facilities by public transport and considerable difficulty accessing cultural centres,
education, employment and public transport stations.
Those living in SDC East also have significant difficulty in accessing health facilities by public transport
and the greatest difficulty accessing public transport stations. Other services such as shopping,
cultural centres and employment are also considered as difficult to access. SDC East & SDC North are
the only areas with any responses indicating difficulty in accessing a place of worships by public
transport which may be reflective of the older population of these areas.
Residents of SDC West, those residing in Rathcoole, Newcastle, Saggart, Kingswood & Citywest, have
the greatest difficulty in accessing many local services such as banking, cultural centres, community
centres, parks and shopping which may be indicative of the more rural nature of some settlements
within the area. However, their stated difficulty in accessing education, employment and health
facilities by public transport is less than many other parts of the County.
Q3. Outside your local area and WITHIN South County Dublin, what type of services
do you have the greatest difficulty in accessing by public transport?
SDC North SDC South SDC Central SDC East SDC West
30%
% of Responses
20%
10%
0%
Residents of SDC North have the greatest difficulty in accessing areas to the south of the County such
as Tallaght and Citywest, in addition to closer areas such as Clondalkin. Interestingly residents also
view Lucan Village, one of the main urban centres in the area, to be difficult to access by public
transport which suggests a clear lack of local bus services serving the village and its surrounding
residential neighbourhoods.Residents of SDC South have significant difficulty in accessing areas to the north and centre of the
County such as Clondalkin, Liffey Valley and Lucan. This would suggest that there is strong disconnect
in the public transport network between areas along the N4, N7 and N81.
Those living in SDC Central have great difficulty travelling to north and south of the County by public
transport with Lucan, Citywest, Liffey Valley and Tallaght all considered more difficult to access. This
is a similar trend to other areas of the County and highlights the lack of internal/ orbital service in the
County. SDC East & West residents also have more difficulty accessing areas to the north by public
transport which indicates a public transport disconnect between the Lucan/ Liffey Valley area and the
remainder of the County.
Survey Results – Older Residents
As mentioned previously, the survey responses for older residents, 65 and over, have been analysed
separately to the overall results in order to identify issues unique to this age bracket. The following
points identify key differences in responses from older residents observed:
Greater difficulty accessing health facilities and hospitals reflecting the importance of these
services to older people;
Noting high response rate from Lucan, access to Liffey Valley was still considered more difficult
across the County as a whole with one response citing the walk from the stop to the centre as
a possible reason for this;
Initial walking access to stops more of a problem for older users due to reduced mobility;
Greater concern for personal safety and disability access; and
Less concerned with journey times, reliability and frequencies than younger residents.
Survey Results – Residents with a Disability
In addition, survey responses from those with a disability were also analysed separately to help
understand challenges in using public transport that are unique to this group of residents. The
following points summarise the key issues identified:
Greater difficulty accessing health facilities and hospitals as well as local community services
and recreational facilities;
Liffey Valley and Lucan Village considered particularly difficult to access by public transport;
33% citied disability access on public transport services as an obstacle;
Lack of spaces on buses for two wheelchairs or one wheelchair when a buggy is occupying the
space; and
Less concerned with journey times, reliability and frequencies.Business Consultation
Complimenting public consultation activities described previously, the business community within
South Dublin County was consulted in undertaking the study. Consultation focused on the South
Dublin Chamber as the representative organisation for businesses within the County. The
management of a limited number of key employment and retail destinations within the County were
also consulted to ascertain their views on issues and priorities.
The findings of consultation with South Dublin's business community can be can be summarised as
follows:
An Economic Profile and Survey of South County Dublin undertaken in 2014 on behalf of
South Dublin Chamber, South Dublin County Council and the Local Enterprise Office, found
the following profile of businesses:- retail - 36%; transportation & distribution - 14%;
professional & financial services - 12%; industrial & manufacturing - 12%; medical &
healthcare - 9%; and others - 17%.
Major employers within the County, in particular those with a high proportion of professional
staff living within a wide catchment area, are presently dependent on car as a means of access
to work. One of the exceptions is The Square Tallaght, where the majority of staff and
customers access by either public transport, walk or taxi from a relatively local catchment.
As the majority of staff/ customers presently travel by car, peak period traffic congestion
(including M50 and key radial corridors) and journey time reliability negatively impacts on
business operations.
With the exception of The Square Tallaght, public transport coverage is seen as
inadequate. Services are generally considered to serve an important role along radial
corridors to/ from the City Centre, but are otherwise considered either deficient or
unavailable.
Current South Dublin County Council Development Plan maximum car parking standards are
considered excessively onerous in the absence of a comprehensive network of orbital bus
services within the County, and between South Dublin County and other parts of Dublin. The
standards are deemed by some businesses to represent a particular impediment to new
office based development in parts of the County.
A mismatch between bus priority provision and existing public services was noted as both a
point of frustration, and an opportunity to address identified deficiencies in orbital bus
service provision. Orbital bus service delivery within the County is seen as the highest priority
for the County, with bus connections to Dublin Airport a further priority.
The challenges of delivering orbital bus services, with potentially relatively limited passenger
demand (initially) was recognised, as was the need for public subvention to ensure their
viability.
Continued development of transport hubs (including provision of real-time information) and
replacement/ upgrade of the bus fleet is also seen as important. Local street design,
including lighting and other measures to enhance perception of personal security are also
coincided beneficial.Public Transport Network & Services
South Public Transport Network
Information on the routes all public transport services, bus and rail, was collated from various data
sources and a simplified network map created for all services passing through South Dublin County. The
map below shows each route and principal stops along the route.
Regular Public Transport Routes Serving South Dublin County
As the map above shows, the vast majority of bus services from South Dublin County are radial services
converging on the City Centre. There is just one orbital service, the 76, which links Tallaght, Clondalkin,
Liffey Valley and Palmerstown. Only one route, the 239, provides connections to the north, linking
Liffey Valley with Blanchardstown via Lucan. There are two orbital services towards the south/ east of
Dublin, the 18 and 75, terminating in Sandymount and Dun Laoghaire respectively.High Frequency Public Transport Network
The previous map shows all regular services passing through South Dublin County with frequencies of up
to just one bus per hour. The map below shows high frequency bus services only and the Luas and heavy
rail networks. These routes have frequency of between 10-20 minutes during peak hours.
High Frequency Public Transport Routes Serving South Dublin County
As shown, all of high frequency bus services are radial and run from South Dublin through the City
Centre with the exception of the 18, which links Palmerstown with Sandymount. There are limited
opportunities to interchange between high frequency buses within the County itself.Stop Locations & Type Existing Public
Transport Stops
The locations of all bus, rail and
Luas stops was mapped using
open source data available
online, as shown in the map
below. In total within South
Dublin County there are 2
heavy rail stops, 11 Luas stops
and approximately 870 bus
stops.
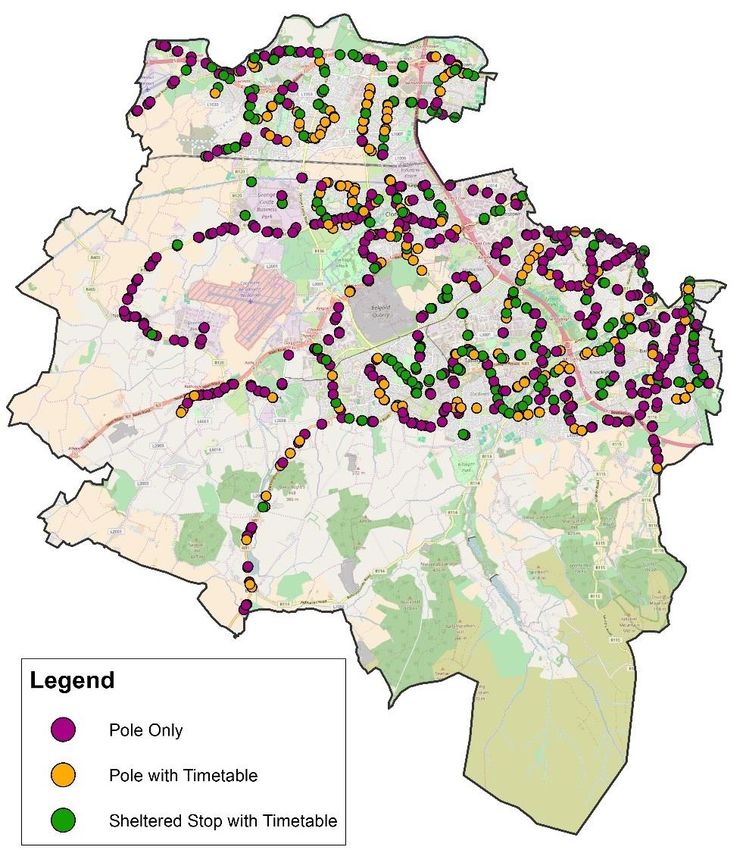
The stop infrastructure at each
if the 870 Dublin bus stops was
also mapped as shown in the
map below.
The majority, 51%, of the bus stops
only have a pole with no timetable or
route information. A total of 23% of
stop have a pole with timetable/ route
information and the remaining 26%
have a full bus shelter with timetables
and route information. Just 5.3% of
stops have real-time information, of
which 4.6% are sheltered stops.
The areas around Tallaght and Lucan
have the most sheltered stops with
notably poor quality stops along the
length of the New Nangor Road.
There also appears to be
proportionally less shelters in the
Walkinstown/ Templeogue area
where there is an increased
proportion of older residents who
would benefit from access to
Existing Bus sheltered stops with seating.
Stop TypesPublic Transport Accessibility Analysis
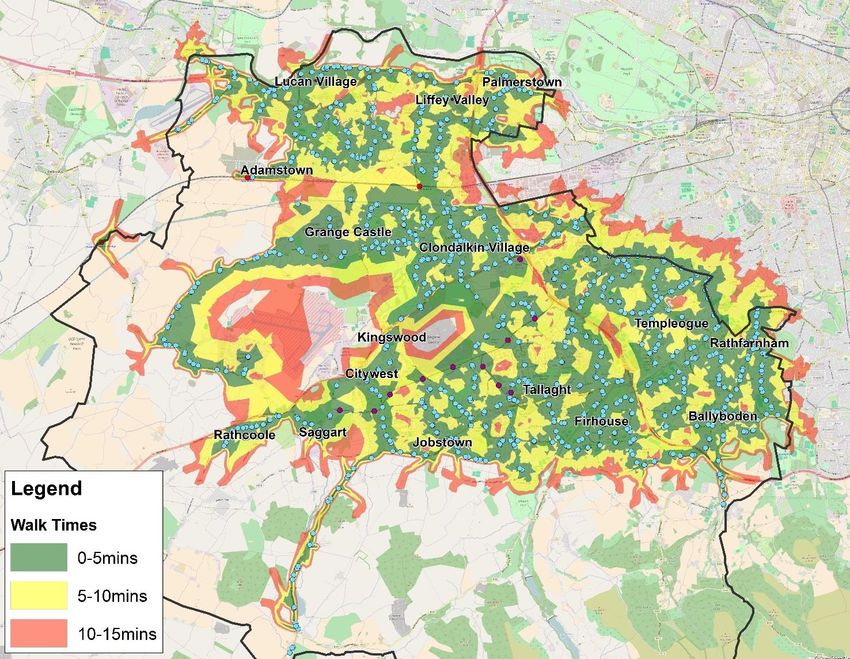
Public Transport Stops Accessibility
Using GIS software the approximate coverage of all public transport stops across the County was
estimated based on assumed walking distances and mapped as shown below. Using these walk times
and population data from the 2011 Census the proportion of the population within 5, 10 & 15 minutes’
walk any public transport stop was estimated and is outlined in the table beneath the map.
Coverage of all Public Transport Stops by Walk Time
Proportion of Population & Jobs within Walking Distance to a Public Transport Stop
% of Total % of Total
Walk Times Population Jobs
Population Jobs
0-5mins 147,226 56% 42,242 54%
0-10mins 242,950 92% 65,002 83%
0-15mins 255,293 96% 71,393 91%As outlined in the previous table, approximately 96% of the population and 91% of all jobs in South
Dublin are located are within 15-minutes’ walk of a public transport stop. However, numerous studies
have shown that the maximum acceptable walk time for public transport is usually around 5-7
minutes’ (500m) for bus and up to 10-12 minutes’ (1,000m) for rail. The graph below shows the
distance travelled by passengers to a bus stops across numerous locations in the US and indicates a
very low percentage of passengers travelling greater than 500m to the stop.
Proportion of Passengers by Distance Walked to Stop
Based on the above information the population was estimated again based on 500m & 1,000m
walking distance for bus and rail respectively. The table below shows the percentage of population
with access to stops based on these revised maximum walk times. These distances are also mapped
on the following page.
Proportion of Population & Jobs within Maximum Walking Distance
% of Total % of Total
Population Jobs
Population Jobs
Max Walk
191,149 72% 52,832 68%
Dist.
Based on these maximum walk distances, 28% of the population and 32% of job locations have
deficient access to a public transport stop. It should be noted that these are maximum distances and
many residents will not be willing to walk this distance.Coverage of All Public Transport Stops based on Maximum Walking Distance
Based on the above analysis, it appears there are gaps in the public transport stop coverage in
the following areas, as numbered in the maps above:
No. Location Description No. Location Description
1 Residential Area around Beech
11 Broomhill Industrial Estate
Park/ Grove
2 Residential Area around Liffey
Valley Park both sides of 12 Wainsfort Manor
St.Loman’s Rd.
3 Residential Area South of Sean
Balgaddy Road East 13
Walsh Memorial Park
4 Residential Area around Residential Areas around Cypress
14
Collinstown Park Drive
5 Residential Areas East of
15 North and South of Old Court Rd.
Kennelsfort Rd Upper
6 Clondalkin Industrial Estate 16 Woodstown Park
7 JFK Industrial Estate 17 Orlagh Residential Area
8 Mount Alton, Knocklyon Court &
Western Business Park/ Ind. Estate 18
Idrone Drive Residential Areas
9 Ballymount Industrial Park 19 Templeroan Ave. Residential Area
10 Magna Business Park 20 Whitecliff Residential AreaRail & Luas Stop Accessibility
Rail, heavy or light, is generally considered to be a better quality public transport option as it offers
more reliable and predictable journey/ wait times. It is also generally faster than the bus alternative
as congestion has no or little impact on its operation. South Dublin is served by two rail corridors,
one light and one heavy. The map below shows the coverage from the rail stops within the County
Rail
up to a& Luasmaximum
1,000m Stop Accessibility
walking distance.
Rail, heavy or light, is generally considered to be a better quality public transport option as it offers
more reliable and predictable journey/wait times. It is also generally faster than the bus alternative
as congestion has no or little impact on its operation. South Dublin is served by two rail corridors,
one light and one heavy. The maps below shows the coverage from the rail stops within the County
up to a 1000m maximum walking distance.
Coverage of Rail Stops based on Maximum Walking Distance
As shown the current level of rail infrastructure results in an imbalance in service coverage between
the north and southCoverage
of the County. However,
of Rail Stops the
based onareas surrounding
Maximum the
Walking heavy rail stops located in
Distance
the north of the County are not yet fully developed and coverage will increase once the local street
networks for Adamstown and Clonburris are expanded. Kilshoge Rail Station was constructed as part
of the Kildare Route Project, and has yet to be opened pending construction of an access road.
Opening of this station would enhance rail coverage to the north of the County. In population and
employment terms, rail coverage shown in the figure above and the table below provides access for
10% of residents and 20% of jobs, which indicates that Luas is driven more towards providing access
for those wishing to travel into the County for employment purposes based on current land uses.
Proportion of Population & Jobs Served by Rail
% of Total % of Total
Population Jobs
Population Jobs
Max Walk % of Total % of Total
27,010Population 15,310 Jobs 20%
10% Population Jobs
Dist.
Max Walk
27,010 10% 15,310 20%
Dist.
Proportion of Population & Jobs Served by RailBus Stop Accessibility
Despite recent improvements to rail services and the introduction of light rail services in Dublin 67%
of public transport passengers nationally still travel on bus with the majority, 55%, using Dublin Bus
according to 2015 figures from Transport for Ireland. As discussed early in the report, 14.3% of
commuting journeys within South County Dublin are made by bus which represents 83% of all public
Bus Stop
transport Accessibility
commuting journeys. The map below shows the coverage of Dublin bus stops within the
County up to a maximum walking distance of 500m.
Despite recent improvements to rail services and the introduction of light rail services in Dublin 67%
of public transport passengers nationally still travel on bus with the majority, 55%, using Dublin Bus
according to 2015 figures from Transport for Ireland. As discussed early in the report 14.3% of
commuting journeys within South County Dublin are made by Bus which represents 83% of all public
transport commuting journeys. The map below shows the coverage of Dublin bus stops within the
county up to a maximum walking distance of 500m.
Coverage of Bus Stops based on Maximum Walking Distance
The proportion of population and jobs within a 500m walking distance to a bus stop is outlined in the
table below. A higher proportion
Coverage of older
of Bus Stops basedresidents, 75%,walking
on Maximum have access to a stop however car
distance
ownership levels amongst this age group is also lower resulting in a higher dependency on public
transport.
Proportion of Population & Jobs Served by Bus
% of Total % of Total
The proportion of populationPopulation
and jobs withinPopulation Jobs to a bus stop is outlined in the
a 500m walking distance Jobs
table below. Max
A higher
Walk proportion of older % of
residents, Total
75%, have access to a % of Total
stops however car
Population 69%
184,047 48,964 Jobs 63%
amongst this age group is also Population
ownership levelsDist. Jobs on public
lower resulting in a higher dependency
transport. Max Walk
184,047 69% 48,964 63%
Dist.
Proportion of Population & Jobs served by BusAs outlined, 69% of the population has access to a bus stop however only 35% have access to a
sheltered stop with a further 18% have access to a stop with timetable information. The remaining
16% have access to a pole only stop. A total of 15.9% of the population has access to a stop with
real-time information.
High-Frequency Bus and Rail Accessibility
As
Theoutlined
analysis69%
thusoffar
the
haspopulations
consideredhas access
access to to
allapublic
bus stop however
stops onlywalk
based on 43%time
haveonly,
access
i.e.tonot
a
sheltered stops and a further 16% have access to a stop with timetable information. The remaining
considering the frequency or quality of services. Public transport service frequency is however a key
10%
factorhave access
in the to a pole
desirability ofonly stop.
public transport particularly when choosing to use public transport over
the private car. In order to estimate accessibility to quality public transport services, access to stops
Bus
servedStop Accessibility
by a high frequency bus and rail service has therefore been assessed. The map below shows
the coverage of stops served by a high frequency bus or rail service, and table beneath associated
proportion of the population and jobs served directly by a high frequency service.
The analysis thus far has considered all stop regardless of the frequency or quality of services to the
time and the associated wait times. Frequency of a service has a considerable better to play in the
desirability of public transport particularly when choosing to use public transport over the private
car. In order to estimate accessibility to reliable services with reduced wait times access to stops
served by a high frequency service has been assessed in addition to accessing to stops with low
estimated wait times. The map below shows the coverage of bus stops served by a high frequency
bus service and table beneath the populations and jobs served directly by a high frequency service.
The analysis thus far has considered all stop regardless of the frequency or quality of services to the
time and the associated wait times. Frequency of a service has a considerable part to play in the
desirability of public transport particularly when choosing to use public transport over the private
car. In order to estimate accessibility to reliable services access to stops served by a high frequency
bus and rail service has been assessed. The map below shows the coverage of stops served by a high
frequency bus or rail service and table beneath associated proportion of the population and jobs
served directly by a high frequency service.
The analysis thus far has considered all stop regardless of the frequency or quality of services to the
time and the associated wait times. Frequency of a service has a considerable better to play in the
desirability of public transport particularly when choosing to use public transport over the private
car. In order to estimate Coverage
accessibility
of to reliable
High services
Frequency Buswith reduced wait times access to stops
and Rail
served by a high frequency service has been assessed in addition to accessing to stops with low
estimated Proportion
wait times.of
The map below
Population shows
& Jobs the coverage
Served of bus stops
by High Frequency served
Bus by a high frequency
or Rail
bus service and table beneath the populations
Coverage of Bus Stopsand jobs served directly by a high frequency service.
% ofserved
Total by High Frequency Service
% of Total
Population Jobs
Population Jobs
Proportion of Population & Jobs served by High Frequency Bus
Max Walk
148,001
Coverage of Bus Stops56%
Served by High40,088 51%
Frequency Service
Dist.
% of Total % of Total
Population Jobs
Population
Coverage of Bus Stops Jobs
served by High Frequency Service
Max WalkPublic Transport Origin-Destination Matrix
While basic accessibility to public transport stops is the first step in providing good connectivity by
public transport, the choice of destination, ease of interchanging between services and service
frequency also determines the quality of the public transport network. In order to assess the
connectivity of the public transport network in South Dublin, the areas outlined previously in the
PT O-D
public Matrixsurvey analysis were analysed to ascertain the quality of public transport options
consultation
available to residents of these areas in travelling to other key destinations within the County and
further afield. The settlements included in each is outlined again in the table below.
SDC North SDC Central SDC South SDC East SDC West
Lucan Clondalkin Tallaght Rathfarnham Rathcoole
While basic accessibility to public transport stops is the first step in providing good connectivity by
Public Transport
Palmerstown
public transport Origin-Destination
the choice
Walkinstown Matrix
of destination, ease of interchanging
Ballycullen Citywest
between services and service
Knocklyon Kingswood
frequency also determines the quality of the public transport network. In order to assess the
Templeogue Newcastle
connectivity of the Public transport network in South Dublin the areas outlined Saggartpreviously in the
survey analysis were analysed to see the quality of public transport options available to residents of
the area
The to movement
ease of a number between
of key destinations
each of these within
areastheandcounty
two key and furtherwithin
locations afield.the
TheCounty
settlements
(Liffey
PT O-D
included
Valley in Matrix
Town each
Centreis outlined
and Tallaght
againHospital
in the table
werebelow.
chosen based in the outcomes of the survey results)
by public transport was assessed and graded as per the table below. Interchanges are categorised
as direct or indirect based on the interchange is located along a logical route to the route to the
While basic
desired accessibility
destination. For to public transport
examples stopsfrom
if a trip made is theLucan
first step in providing
to Tallaght good
required anconnectivity
interchange by in
public
the Citytransport
Centre this thewould
choicebe of destination,
considered ease ofinterchange.
an indirect interchanging between services and service
frequency also determines the quality of the public transport network. In order to assess the
Accessibility
connectivity of the Public transport network in SouthDescription Dublin the areas outlined previously in the
Rating
survey
The ease
analysis
of movement
were analysed
between to each
see theof these
qualityareas
of public
and two
transport
key locations
optionswithin
availabletheto
county
residents
(Liffey
of
the area
Valley Very
Town Poor
to aCentre
number andofTallaght
key destinations Indirect
Hospital werewithin or
chosen multiple
the County
based in interchanges
and
thefurther
outcome afield.
of theThe settlements
survey results)
included
by public in Poor
each is outlined
transport Direct
again and
was assessed in the interchange
tableas
graded below. between low
per the table below. frequency services
Average Direct between high frequency services
Good Direct low frequency service (30min+ frequency)
While
The basic
ease of accessibility
movement
Very Good to public
between transport
each highstops
of these
Direct is the
areas
frequency first
two step
andservice in providing
key(The above table shows that SDC North is the most inaccessible area of the County by public transport,
with poor-very poor accessibility from SDC South, East and West. This highlights once again the lack
of local orbital services and disconnect between the north and south of the County. The only orbital
bus route, the 76, travels along the east of the County and does not serve Lucan. Liffey Valley, which
was highlighted in the survey results as difficult to access for many residents, also has poor
accessibility to areas which are not directly served by the 76, i.e. SDC East and West. SDC South and
Tallaght Hospital are the easiest to access by public transport with direct links to most of the County
with the exception of SDC North – see below for impacts of future public transport schemes.
The above analysis is shown below for journeys external to the County using the same grading system.
Services running through the City Centre have not been considered for destination around the M50
The above table shows that SDC North is the most inaccessible area of the County by public transport,
North and South as journey times are significantly greater than by car despite the interchange
with poor-very poor accessibility from SDC South, East and West. This highlights once again the lack
between high frequency bus services and would not be a realistic option for most residents.
of local orbital services and disconnect between the north and south of the County. The only orbital
bus route, the 76, travels along the east of the County Destination
and does not serve Lucan. Liffey Valley, which
Origin/Destination
was highlighted
The same in the surveyM50
analysis results as M50
difficult to access for County
Cityto the many residents, the has
usingJames' poor accessibility
Crumlin
Matrix is shown below for journeys external Airport same grading system.
to areas which are not directly
Northserved by the
South 76, i.e. SDC
Centre East and West. SDC
HospitalSouth
Services running through the City Centre have not been considered for destination around the M50 and Tallaght
Hospital
Hospital
North and areSouth
the easiest to access
as journey by public
times transport with
are significantly direct
greater linksby
than to car
most of the County
despite with the
the interchange
SDC North
exception
between highof SDC North.
SDCfrequency
Central bus services and would not be a realistic options for most residents.
Origin
SDC South
SDC East
SDC West
The table above clearly demonstrates the lack of direct service to destinations around the M50 North
and South with only the 239 and 75 providing infrequent access to parts of the north and south
respectively. By comparison, the City Centre is very accessible with high frequency direct routes
serving most of the County. The Greater Dublin Area Transport Strategy 2016-2035 is noted to
contain orbital bus corridor proposals – see below for impacts of future public transport schemes.
The two hospitals are accessible to SDC Central and South as they are located on the radial corridors
running into the City Centre from these areas however access from the rest of the County by public
transport is difficult with interchanges required which may not always be possible for those needing
access to hospitals. The airport is reasonably accessible to SDC South which is directly served by the
Airport Hopper 777 Service which also partially serves SDC Central. However, the rest of the County
relies on interchanging between services.
Impact of Planned Future Public Transport Schemes
As
Theoutlined earlier
table above in the
clearly report, an orbital
demonstrates busofcorridor
the lack is included
direct service in Greater around
to destinations Dublin Area Transport
the M50 North
Strategy 2016-2035. Although this scheme has not yet advanced to the route selection
and South with only the 239 and 75 providing infrequent access to parts of the north and south process, the
indicative route
respectively. Byshown in the Strategy
comparison, the City will directly
Centre linkaccessible
is very SDC Northwith and SDC
highSouth, and South
frequency direct County
routes
Dublin to destinations around the M50 (Blanchardstown in north and Dundrum/
serving most of the County. The Greater Dublin Area Transport Strategy is noted to contain orbital UCD in the
bus corridorof
Impact
southeast), Future
while
proposals, Improvements
also providing
which interchange
would enhancepoints
publicbetween
transport a number of high
connectivity frequency
between bus andand
the County rail
routes. This scheme
Blanchardstown is north,
in the understood to be currently
and Dundrum/ UCD to scheduled for medium-term delivery (post 2020).
the southeast.
The two hospitals are accessible to SDC Central and South as they are located on the radial corridors
running
Identify into
OD the city from which
movements these areas however with
may improve accessthe
from the rest of of
introduction thethe
County
GDAbystrategy
public transport
or other
is difficult with
planned measures. interchanges required which may not always be possible for those needing access toKey Challenges
Strategic/ County Local
Wide Challenges Challenges
Strategic/ County Wide Challenges
Key Challenges
The findings of public and business consultation activities, supplemented with a review of public
transport accessibility has informed the identification of following priority challenges for the County:
Public transport network coverage, with only 72% of the County’s population, and 68% of its jobs
located within the walking catchment of bus and rail services. Specific gaps include:
CountyoWide Local bus service provision, with limited areas such as Lucan Village poorly connected to
its surrounding residential areas, and numerous employment centres outside the walking
Key Challenges
The findings of public and business consultation activities, supplemented with a review of public
catchment of public transport; and
transport accessibility has informed the identification of following priority challenges for the county:
o Access to rail and Luas, which offer high quality links to Dublin City. Currently only 10% of
residents and 20% of jobs are located within walking distance of a rail stop and
Public transport network coverage, with only 72% of the county’s population, and 68% of its jobs
interchange facilities and feeder bus services are either inadequate or not provided.
Strategic/ located within
Orbital public County the walking
Wide
transport catchment
Challenges
connectivity, of buspoor
with and links
rail services.
both:
Local bus service provision, with limited areas such as Lucan Village poorly connected to its
o Within the County, with only the no 76 bus service providing an infrequent service from
surrounding residential
Tallaght areas. via Clondalkin and Liffey Valley; and
to Palmerstown
Access to rail and Luas, which offer high quality links to Dublin City, however only 10% of
Key Challenges o Between the County and areas to the north and south/ east of the County, with the 239,
residents 18 and
and 75 20% of jobs
routes are located
providing withinindirect,
infrequent, walkingslow distance, and appropriate
and unreliable interchange
connections.
facilities and feeder bus services are not provided.
Meeting the needs of older residents and those with reduced mobility, with deficient access by
County Limited
publicWide orbital public
transport transport
to healthcare links: Crumlin, St. James's hospitals), retail etc.
(Tallaght,
o within the county, with only the no 76 bus service providing an infrequent service from
Supporting sustainable future development in key development areas, namely Adamstown and
Tallaght
Clonburris, which to although
Palmersown via Clondalkin
located adjacent toand railLiffey
servicesValley; and City, and poorly connected
to Dublin
o between the county and areas to the north and south/ east, with the 239, 18 and 75 routes
to the remainder of the County.
providing infrequent, indirect, slow and unreliable connections.
The above challenges,
Access and the
to healthcare, local challenges
in particular Tallaght, which follow
Crumlin, St.are complimentary
James's and Connollyto hospitals.
the Transport and
Mobility policies and
Supporting objectivesfuture
sustainable of County Development
development in key Plan 2016 – 2022areas,
development (Chapter 6). Adamstown and
namely
LocalClonburris,
toChallenges
which although located adjacent to rail services to Dublin City, and poorly connected
the remainder of–the SDC North
county.
The findings of public and business consultation activities, supplemented with a review of public
SDC North, encompassing Lucan and Palmerstown, is characterized by a series of radial bus services,
transport accessibility has informed the identification of following priority challenges for the county:
with the Kildare Rail Line to the south. Specific identified public transport challenges are:
The above challenges, and the local challenges which follow are complimentary to the Transport and
South/
Mobility Public
policies west
transport of network
Lucan of
and objectives Village
coverage,
County around Beech
with only
Development 72% Park/
of the
Plan Grove
2016 (identified
county’s
– 2022 (Chapterearly
population, 6).andas68%having a
of its jobs
proportionally
located within high older population);
the walking catchment of bus and rail services.
The
SDC findings
SDC North
North, of public andLucan
encompassing business
and consultation activities,
Palmerstown, isLiffey supplemented
characterized with a review bus of public
Poor
Localstop
bus coverage
service provision,
to residentialwith areas
limited
withinareas suchValley Parkbyestate
as Lucan a series
Village of radial
between
poorly connected
Ballyowenservices,
and
to its
transport
with the accessibility
Kildare Rail hasto
Line informed
the the Specific
south. identification of following
identified public priority challenges
transport challenges for the County:
are:
surrounding residential areas.
Fonthill Roads south of St Lomans’ Road, and residential Areas around Collinstown Park; and
PoorAccess to rail and
connectivity Luas, which
between Lucan offer
Villagehigh
andquality
residential linksareas
to Dublin
to the City,
south.however only 10% of
residents and 20% of jobs are located within walking distance, and appropriate interchange
SDC North has also
facilities andbeen
feeder identified to beare
bus services poorly connected to other parts of the County, with limited or
not provided.
no realistic
Limited means of travelling
orbital public by public links:
transport transport to SDC Central, South, East or West. Key development
The
Local findings of public and business consultation activities, supplemented with a review of public
areas of Challenges
Adamstown
o within and – SDCwith
Clonburris
the county, North
areonly
located
the no in SDC
76 bus North, andproviding
service ensuring antheinfrequent
public transport
serviceneeds
from
transport accessibility has informed the identification of following priority challenges for the county:
South/West of Lucan Village around Beech Park/Grove (identified early as having a
of these areas are addressed
Tallaght to is essential
Palmersown via to their
Clondalkinsustainable
and future
Liffey development.
Valley; and
o between
proportionally theolder
high county and areas to the north and south/ east, with the 239, 18 and 75 routes
population);
Public transport network coverage, with only 72% of the county’s population, and 68% of its jobs
Poor stopproviding
coverage infrequent, indirect,
to residential areasslow andLiffey
unreliable connections.
located within the walking catchment ofwithin
bus and railValley Park estate between Ballyowen and
services.
Fonthill
Access to healthcare,
Roads south in particular
of St Lomans’ Tallaght, Crumlin, St. James's and Connolly hospitals.
Local bus service provision, with Road,
limitedand residential
areas such asAreas Lucanaround
VillageCollinstown Park; and
poorly connected to itsYou can also read