Coupling Riverbank Filtration with Reverse Osmosis May Favor Short Distances between Wells and Riverbanks at RBF Sites on the River Danube in ...
←
→
Page content transcription
If your browser does not render page correctly, please read the page content below
water
Article
Coupling Riverbank Filtration with Reverse Osmosis
May Favor Short Distances between Wells and
Riverbanks at RBF Sites on the River Danube
in Hungary
Endre Salamon         and Zoltán Goda *
 Faculty of Water Sciences, National University of Public Service, 6500 Baja, Hungary; salamon.endre@uni-nke.hu
 * Correspondence: goda.zoltan@uni-nke.hu; Tel.: +36-70-374-2674

 Received: 28 November 2018; Accepted: 4 January 2019; Published: 10 January 2019

 Abstract: Bank filtration and other managed aquifer recharge techniques have extensive application
 in drinking water production throughout the world. Although the quality of surface water improves
 during these natural processes, residence time in the aquifer and length of the flow paths are
 critical factors. A wide range of data is available on the physical–chemical processes and hydraulic
 conditions, but there is limited knowledge about the top layer of the porous media. An investigation
 was conducted on the hydraulic behavior and on the change of microbiological indicator parameters
 in the filter cake. The purpose of the experiment was to: (1) investigate if the reverse osmosis is
 sustainable when fed with only slow filtered water, and (2) show that a short travel distance can
 provide extensive pathogen removal and beneficial conditions for the reverse osmosis. A slow sand
 filter was operated over a one-year long period while changes in head loss and microbiological
 parameters were being monitored. Head loss and membrane permeability were monitored between
 3 November 2016 and 24 October 2018 and microbiological sampling was performed from 19 July
 2017 to 6 November 2018. The filtered water was fed to a reverse osmosis (RO) filter as the water
 above the sand filter had been spiked with dissolved iron. Results show that even a thin biofilm cake
 of 1–3 mm thickness can result in a significant (10–100%) reduction in microbiological activity in the
 infiltrate, while favorable short retention times and oxic conditions are maintained. Avoiding anoxic
 conditions, subsequent iron and manganese dissolution and precipitation is beneficial for membrane
 processes. Building on these results, it can be stated that when reverse osmosis is directly fed with
 slow filtered or bank filtered water, (1) a short distance from the surface water body is required
 to avoid dissolved iron and manganese from entering the groundwater and (2) proper pathogen
 rejection can be achieved even over short distances.

 Keywords: bank filtration; biofilm; clogging; filter cake; pathogen barrier; pressure loss; slow
 sand filtration

1. Introduction
      Due to the increasing strain on drinking water supplies and the energy demand for drinking
water treatment, the combination of natural and engineered systems (CNES) gains more and more
attention. While the currently reported annual volume of managed aquifer recharge (MAR) is only 1%
of global groundwater use, in some countries it is considerably higher, especially where river bank
filtration (RBF) is practiced, e.g., in Hungary, the Slovak Republic and Germany [1]. Although the
benefits of these processes are well-known and they have been studied extensively over the last century,
some unresolved site-specific issues and ambiguous scientific terminology remain. In Hungary, with
the exception of the RBF sites on islands in Budapest, it is typical for smaller rivers that had elevated

Water 2019, 11, 113; doi:10.3390/w11010113                                        www.mdpi.com/journal/water
Water 2019, 11, 113                                                                                  2 of 12

concentrations of dissolved iron and manganese in the portion of pumped land-side groundwater to
require further water treatment [2].
       The Fe and Mn issue is hydrogeology related, and it involves the distance between the surface
water body (rivers in the case of RBF, infiltration trenches and basins in the case of MAR) and the
abstraction point. If the abstraction point is far away (horizontally or vertically) from the surface water
body, undesired flow from the background/land-side commonly increases, causing higher dissolved
iron and manganese concentrations in the pumped water. On the other hand, if the flow path length is
short, the withdrawal of surface water increases, but the short retention time reduces the efficiency of
the porous media as a barrier and bioreactor.
       A large number of publications are dealing with the question of how distance and travel time affect
the removal capacity of MAR schemes [1]. Hydraulic conditions and physical and chemical changes
have been extensively studied. Due to limitations concerning the calibration of geohydrochemical
models, there is a lack of data on the exact spatial extent of water quality changes on the subsurface.
It is understood from the slow sand filtration process that the highest (micro)biological activity is found
at the topmost few centimeters of the filter. The flow velocity in slow sand filters (1–50 cm/h) [3,4] are
comparable with those documented for BF sites (0.1–50 cm/h) [5,6].
       Both sand filtration and bank filtration were studied extensively in the past regarding the rejection
of potential microbiological hazards. In slow sand filters, 1–3 log removal (90–99.9%) was observed by
different authors, both by colony counting and other methods [7,8]. RBF was reported to be capable of
2–5 log reduction for pathogen indicator parameters, such as E. coli and coliforms [9,10].
       Consequently, with respect to the importance of the first few centimeters of the top layer, both RBF
and MAR in general have some analogy with slow sand filtration and cake filtration. Since long
residence times and flow path lengths can have an adverse effect on water quality, it raises the question
about the extent that this thin boundary layer (or zone) can be utilized in order to avoid discharge
from land-side or deeper groundwater.
       Concerning RBF, a large number of scientific studies dealt with clogging and flow conditions in the
riverbed, and various methods were applied and further developed to assess the permeability of the
riverbed, i.e. the fragment approach and complex numerical flow simulation models [11,12]. The main
difference between a pure slow sand filtration setup and RBF is the presence of the shear stress and
sediment transport at the boundary coupled with an abstracted portion of land-side groundwater.
With respect to MAR, the shear force at the boundary is usually negligible, depending on the specific
layout and hydraulic conditions of the infiltration structures. Because of this, MAR is more closely
related to slow sand filtration.
       As part of the AquaNES “Demonstrating Synergies in Combined Natural and Engineered
Processes for Water Treatment Systems” project, a slow sand filter was operated at the pilot water
treatment plant (PWTP) of the National University of Public Service’s Faculty of Water Science in
Baja, Hungary. The aim of the study described here was to assess the efficiency of slow sand filtration
when a thin, clogged, biologically active top layer is present. This way an assessment can be made
about the removal of pollutants and pathogen retention at the porous media–water body boundary.
Results are compared with the efficiency of long retention time systems. The investigation is focused
on determining the extent of reduction in microbiological indicator parameters.
       The main application of reverse osmosis is seawater and brackish water desalination in the present
day. Even though there is considerable drinking water production by reverse osmosis worldwide,
most scientific research focuses on the process itself and extensive case studies do not exist for bank
filtration coupled with reverse osmosis. The main area of the present research is the rejection of
pollutants, which are known to be unaffected by bank filtration [13]. Other research focuses on the
energy efficiency [14] as reverse osmosis (RO) equipment used for freshwater desalination operates on
a considerably lower pressure and energy demand than those for seawater desalination. A similar
pilot scale investigation with single element RO was carried out at three different sites in the United
States [15]. In developed countries, reverse osmosis of freshwater is typically used for wastewater
Water 2019, 11, 113 3 of 12
Water 2019, 11, x FOR PEER REVIEW 3 of 12
reclamation and is usually located at the end of the process train either in wastewater treatment or
different sites in the United States [15]. In developed countries, reverse osmosis of freshwater is
drinking water
typically usedtreatment, for example
for wastewater in Orange
reclamation and is County, California
usually located [16].
at the end of the process train either
Although large water companies and some authorities
in wastewater treatment or drinking water treatment, for example in Orange County, possess reverse osmosisCalifornia
equipment for
[16].
emergency water treatment, the long-term treatment of bank filtered
Although large water companies and some authorities possess reverse osmosis equipment for water on reverse osmosis has
never been studied
emergency water in Hungary.the
treatment, Bank filtration
long-term supplies
treatment of almost 50% ofwater
bank filtered the country’s
on reverse drinking
osmosiswater
has
demand
never and
beenbankstudied filtration sites are
in Hungary. Bankvulnerable
filtration to not just
supplies emerging
almost 50% of micropollutants, but industrial
the country’s drinking water
anddemand
municipalandwastewater
bank filtration discharge
sites areasvulnerable
well. Therefore, it isemerging
to not just imperative to start investigations
micropollutants, on the
but industrial
long-term sustainability
and municipal of advanced
wastewater dischargetreatment processes.it is imperative to start investigations on the
as well. Therefore,
long-term
In order sustainability
to investigateof advanced
the impact of treatment
the bankprocesses.
filtration process on membrane filtration, a reverse
osmosisIn(RO)order to investigate
filter was installedthe impact
on theof the bank
filtrate filtration
stream. Thisprocess
uniqueon membrane
setup (despitefiltration,
RO nevera reverse
having
osmosis (RO) filter was installed on the filtrate stream. This unique setup
been the first choice for treating fresh water in the past) was chosen because among all membranes, (despite RO never having
RObeen
is thethe firstsensitive
most choice for totreating
fouling.fresh water
Because RO inoperating
the past) was chosen because
parameters respondamong all membranes,
very rapidly to fouling
RO isitthe
effects, mostbe
could sensitive
a goodto choice
fouling.toBecause RO operating
investigate the impact parameters respond
of naturally very rapidly
treated water to foulingon
quality
effects, it could be a good choice to investigate the impact of naturally
engineered processes. If it can be proven that a thin boundary layer is adequate during MAR or even treated water quality on
engineered processes. If it can be proven that a thin boundary layer
RBF to properly improve the water quality for membrane filtration, then more CNES systems with is adequate during MAR or even
RBF to properly improve the water quality for membrane filtration, then more CNES systems with
short retention times may be developed in the future.
short retention times may be developed in the future.
2. Materials and Methods
2. Materials and Methods
2.1. Slow Sand Filter Setup
2.1. Slow Sand Filter Setup
The experiment was carried out in a fully saturated open rapid sand filter structure (Figure 1).
The experiment was carried out in a fully saturated open rapid sand filter structure (Figure 1).
The grain size distribution of the 1 m thick sand layer shows mainly grains between 0.5–0.8 mm
The grain size distribution of the 1 m thick sand layer shows mainly grains between 0.5–0.8 mm (11%)
(11%) and 0.8–1.5 mm (87%) and larger than 2 mm (1.4%), with 0.6% of grains smaller than 0.5 mm.
and 0.8–1.5 mm (87%) and larger than 2 mm (1.4%), with 0.6% of grains smaller than 0.5 mm. The
The supporting gravel layer consists of 2–5 mm pebbles (100%). A constant filtration rate of 50 mm/h
supporting gravel layer consists of 2–5 mm pebbles (100%). A constant filtration rate of 50 mm/h was
was maintained by constant withdrawal of the filtrate with the help of a centrifugal pump (Q = 260 L/h,
maintained by constant withdrawal of the filtrate with the help of a centrifugal pump (Q = 260 L/h,
type FC 25-2C, SAER, Guastalla, Italy) with throttle control. Raw water was extracted directly from
type FC 25-2C, SAER, Guastalla, Italy) with throttle control. Raw water was extracted directly from
Sugovica, a branch
Sugovica, a branchof of
thethe
Danube
Danuberiver
riveron
onaadaily
dailybasis.
basis. Daily
Daily change of the
change of thewater
waterdepth
depthabove
abovethe
the
sand layer
sand was
layer 1.0–1.5
was mm
1.0–1.5 and a minimum
and a minimumcoverage
coveragedepth
depthofof 0.8
0.8 m
m was maintainedatatall
was maintained alltimes.
times.
Figure1.1.Slow
Figure Slowsand
sandfilter
filter layout.
layout.
Piezometric
Piezometric tubes (silicone
tubes (siliconerubber,
rubber,nominal
nominaldiameter
diameter == 8 mm)
mm) were
wereinstalled
installedatatdifferent
differentdepths
depths
in the sand
in the sand layer.
layer.The
The distribution
distribution ofofthe
thepiezometers
piezometers along
along thethe
sandsand
layerlayer is detailed
is detailed in 1.
in Table Table
The 1.
Theinlets
inletsofofthe
the tubes
tubes were
were covered
covered with
with geotextile
geotextile in order
in order to prevent
to prevent the sand
the sand grainsgrains from entering
from entering and
Water2019,
Water 2019,11,
11,113
x FOR PEER REVIEW 4 4ofof1212
clogging the tubes. A vacuum pump was installed on a joint collector headspace of the piezometer
and clogging
tubes. Since the
thistubes.
systemAhas
vacuum pump
a closed was installed
headspace, once on
theavacuum
joint collector
pumpheadspace of the
is turned off, thepiezometer
differences
tubes.
between water levels in the piezometric tubes reflect the pressure differences between thedifferences
Since this system has a closed headspace, once the vacuum pump is turned off, the tube inlets.
between water levels
These differences in the
were piezometric
subtracted fromtubes
the reflect the pressure
calculated differences
hydrostatic pressure between
in orderthetotube inlets.
obtain the
These differences were subtracted from the calculated hydrostatic pressure in order to obtain
pressure distribution. The purpose of the two inlets above the sand layer is to signal if any obstruction, the
pressure
cloggingdistribution. The purpose
or biofilm growth of theon
takes place two inlets
the above the
protective sand
cover layer
at the is to signal if any obstruction,
inlet.
clogging or biofilm growth takes place on the protective cover at the inlet.
Table 1. Piezometer distribution.
Table 1. Piezometer distribution.
Piezometer No. Inlet Depth from Sand Layer Top (cm)
Piezometer
1 No. Inlet Depth from Sand
105 Layer Top (cm)
12 10582
23 8262
3 62
4 43
4 43
55 21.5
21.5
66 5.5
5.5
77 88 cm
cmabove
abovesand layer
sand layer
88 37.5 cm above sand layer
37.5 cm above sand layer
Differencesininpiezometric
Differences piezometric levels
levels were
were registered
registered daily
daily in order
in order to monitor
to monitor the clogging
the clogging of theoftop
the
top layer.
layer. In order
In order to read
to read the the level
level differences
differences between
between thethe piezometers,
piezometers, manual
manual readingwas
reading wasapplied.
applied.
Beforereading
Before readingthethe piezometers,
piezometers, the the water
water raised
raised to eye-level
to eye-level with
with the the vacuum
vacuum pump and pump and
all air all air
bubbles
bubbles
were were removed
removed from the from theAfter
tubing. tubing.theAfter thestabilized
levels levels stabilized (5–15the
(5–15 min), min), the differences
differences between between
each
each piezometer
piezometer were registered.
were registered.
2.2.
2.2.Reverse
ReverseOsmosis
OsmosisUnit
Unit
Filtrate
Filtratefrom
fromthetheslow
slowsand
sandfilter
filterwas
wasfed
fedtotosmall
smallRO
ROfilter,
filter,which
whichhad
hadaapressure
pressurebooster
boosterand
andaa
55µm
µmcartridge
cartridgefilter
filterofofits
itsown.
own.The
TheROROunit
unitcontained
containedcross-flow,
cross-flow,spiral
spiralwound
woundcomposite
composite(thin
(thinfilm)
film)
membranes (manufacturer: General Electric, catalog number: AK2540TM, Boston, MA,
membranes (manufacturer: General Electric, catalog number: AK2540TM, Boston, MA, USA) in two USA) in two
vessels
vessels(Figure
(Figure2).
2).
Figure2.2.Small
Figure Smallscale
scalereverse
reverseosmosis
osmosis(RO)
(RO)unit
unit(measurement
(measurementpoints:
points:FF==flowrate;
flowrate;CC==conductivity;
conductivity;
PP==pressure;
pressure;QQ==sampling;
sampling;TT==temperature;
temperature;VV== volume).
volume).Water 2019, 11, 113 5 of 12
At the beginning of each filtration cycle, the recovery ratio was set to 50–60% and the initial throttle
on the concentrate outlet and on the concentrate recycle was left undisturbed. This way, as the filtration
went on, the permeability slowly declined due to membrane fouling. Daily average feed, concentrate
and permeate quantities were determined based on installed water meters. Transmembrane pressure
was calculated based on the average of feed and concentrate pressure.
2.3. Sampling and Analysis
Weekly and bi-weekly sampling for microbiological parameters was conducted according to
the Hungarian MSZ EN ISO 19458:2007, sampling for microbiological testing standard [17] between
November 2016 and October 2018. The samples were sent to the laboratory of Budapest Waterworks
(BUWW) for analysis (Table 2). Parallel samples were taken on the same day and the colony count was
determined on site in the PWTP laboratory as well.
Table 2. Measured microbiological parameters and applied standard methods.
Parameter Standard Method of Analysis
Colony count, 22 ◦C MSZ EN ISO 6222:2000
Colony count, 37 ◦ C MSZ EN ISO 6222:2000
Coliforms MSZ EN ISO 9308-1:2015
E. coli MSZ EN ISO 9308-1:2015
Enterococcus MSZ EN ISO 7899-2:2000
Clostridium (anaerobic sulfate reducers) MSZ EN 26461-2:1994
Pseudomonas aeruginosa MSZ EN ISO 16266:2008
Two samples were taken at each sampling, one from the raw water above the sand filter and
one from the filtered water. The sample from the raw water was taken by a thoroughly rinsed metal
bowl dipped in the open water above the filter. Samples from the filtrate were taken from a sampling
tap installed on the filtrate pipe. The tap and the pipeline were rinsed with 1% hypochlorite solution
before and after every sampling.
3. Results
3.1. Clogging and Pressure Loss Development
Based on the measured piezometric level differences at different depths in the sand layer of the
filter, the pressure distribution (or hydraulic gradient) was calculated along the filter in the form of a
Michau (or Lindquist) diagram (Figure 3). The difference shown at a depth of 150 cm above the bottom
of the filter indicates different water levels above the surface of the filter (water column of 1.0–1.5 m).
As expected, the pressure distribution shows the characteristics of a slow sand filter, with the
steepest gradient present in the top 5 cm of the sand layer and no observable deviation from the
linear gradient below. A deviance from the linear hydrostatic pressure can be attributed to the biofilm
development on the geotextile covering the outlets of the piezometer tubes. This affected only the
tubes near the top of the sand. Because of this, the equalization of the pressure differences in the
piezometers takes a longer time.
The gradient in the top layer plotted as a function of elapsed time shows an increasing linear
tendency (Figure 4). The calculated p-value of the F-test performed to investigate the linear correlation
is 1.6 × 10⁻⁵ . At a 0.05 confidence level, it can be rejected that there is no linear correlation. The error
of the slope is 3.86 ± 0.53 cm/d. In spite of the large number of influencing factors, the increase of the
gradient indicates an effective rejection of suspended solids and microbial growth.Water 2019, 11, 113 6 of 12
Water 2019, 11, x FOR PEER REVIEW 6 of 12
Figure 3. Measured pressure distribution in filter.
As expected, the pressure distribution shows the characteristics of a slow sand filter, with the
steepest gradient present in the top 5 cm of the sand layer and no observable deviation from the linear
gradient below. A deviance from the linear hydrostatic pressure can be attributed to the biofilm
development on the geotextile covering the outlets of the piezometer tubes. This affected only the
tubes near the top of the sand. Because of this, the equalization of the pressure differences in the
piezometers takes a longer time.
The gradient in the top layer plotted as a function of elapsed time shows an increasing linear
tendency (Figure 4). The calculated p-value of the F-test performed to investigate the linear
correlation is 1.6 × 10⁻⁵. At a 0.05 confidence level, it can be rejected that there is no linear correlation.
The error of the slope is 3.86 ± 0.53 cm/d. In spite of the large number of influencing factors, the
increase of the gradient indicates an
Figure
Figure effective
3.3. rejection
Measured
Measured ofdistribution
suspended
pressuredistribution
pressure solids
filter. and microbial growth.
ininfilter.
As expected, the pressure distribution shows the characteristics of a slow sand filter, with the
steepest gradient present in the top 5 cm of the sand layer and no observable deviation from the linear
gradient below. A deviance from the linear hydrostatic pressure can be attributed to the biofilm
development on the geotextile covering the outlets of the piezometer tubes. This affected only the
tubes near the top of the sand. Because of this, the equalization of the pressure differences in the
piezometers takes a longer time.
The gradient in the top layer plotted as a function of elapsed time shows an increasing linear
tendency (Figure 4). The calculated p-value of the F-test performed to investigate the linear
correlation is 1.6 × 10⁻⁵. At a 0.05 confidence level, it can be rejected that there is no linear correlation.
The error of the slope is 3.86 ± 0.53 cm/d. In spite of the large number of influencing factors, the
increase ofFigure
the gradient
Figure 4. The
4. indicates an
Therelationship
relationship effective
between
between therejection
the top layer
top of
layer and
andsuspended
the days
the solids
days after
after and microbial growth.
commissioning.
commissioning.
The gradient
The gradientand
andthetheresistance
resistancebuild-up
build-up
areare subject
subject to many
to many influencing
influencing factors
factors apartapart
fromfrom
the
the microbiological growth and biofilm development. Combined, these factors
microbiological growth and biofilm development. Combined, these factors can cause large randomcan cause large
random variations
variations in the hydraulic
in the hydraulic gradientgradient
and the and the development
development of the resistance
of the resistance againstagainst filtration.
filtration. Such
Such factors include:
factors include:
• sedimentation of
sedimentation of small
small particles (e.g., in stagnant river areas),
• erosion of
erosion of the top boundary layer (e.g., during floods or dredging),
• three-phase
three-phase flow
flow (e.g., gas bubbles from biological activity),
• non-zero order biomass growth (fluctuations in substrate concentration, temperature, pH, etc.),
• changes in viscosity,
• precipitation and dissolution of carbonates, iron-hydroxides and other compounds at the boundary.
Figure 4. The relationship between the top layer and the days after commissioning.
Under the conditions of the experiment, the rate of the resistance build-up was 4 cm/d (cm stands
for theThe gradient
measured and the resistance
difference build-up are
in the piezometric subject
levels). Thetodeveloped
many influencing factors
biofilm and apart from
boundary the
layer
microbiological growth and biofilm development. Combined, these factors can cause large
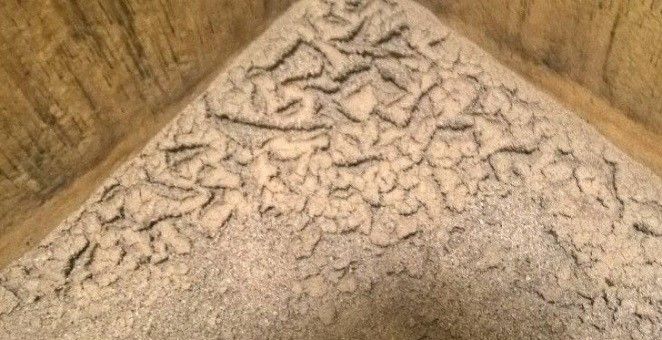
could be observed with the naked eye after 1–2 weeks of operation (Figure 5a–c). Its thickness was random
variations
2–3 mm. in the hydraulic gradient and the development of the resistance against filtration. Such
factors include:
sedimentation of small particles (e.g., in stagnant river areas),
erosion of the top boundary layer (e.g., during floods or dredging),
three-phase flow (e.g., gas bubbles from biological activity), precipitation and dissolution of carbonates, iron-hydroxides and other compounds at the
precipitation and dissolution of carbonates, iron-hydroxides and other compounds at the
boundary.
boundary.
Under the conditions of the experiment, the rate of the resistance build-up was 4 cm/d (cm stands
Under the conditions of the experiment, the rate of the resistance build-up was 4 cm/d (cm stands
for the measured difference in the piezometric levels). The developed biofilm and boundary layer
Water 2019,measured
for the 11, 113 difference in the piezometric levels). The developed biofilm and boundary7layer of 12
could be observed with the naked eye after 1–2 weeks of operation (Figure 5a–c). Its thickness was 2–
could be observed with the naked eye after 1–2 weeks of operation (Figure 5a–c). Its thickness was 2–
3 mm.
3 mm.
(a)
(a)
(b) (c)
(b) (c)
Figure 5. Clogged layer at the porous media–water boundary. (a) Dried state; (b) wet state; (c)
Figure5.5.Clogged
Figure Clogged layer
layer at porous
at the the porous media–water
media–water boundary.
boundary. (a) Dried(a) Dried
state; state;
(b) wet (b)
state; (c)wet state; (c)
approximate
approximate thickness of 2–3 mm.
thickness of 2–3
approximate mm. of 2–3 mm.
thickness
3.2.
3.2.Changes ininMicrobiological Indicator Parameters
3.2.Changes
Changes inMicrobiological
MicrobiologicalIndicator
IndicatorParameters
Parameters
AAbox plot was created for the measured values ofofeach parameter ininthe raw and in the filtered
Abox
boxplot
plotwas
wascreated
createdfor forthe
themeasured
measuredvaluesvalues ofeacheachparameter
parameter inthe
theraw
rawand
andininthe
thefiltered
filtered
water
water (Figure 6a,b). Some results for coliforms
coliforms and andE.E.coli
coliwere
wereomitted,
omitted,because
because four samples could
water(Figure
(Figure6a,b).
6a,b).Some
Someresults
results for coliforms and E. coli were omitted, four
because samples
four could
samples not
could
not
be be analyzed
analyzed for for
E. E. by
coli colithe
byBUWW
the BUWW laboratory
laboratory due due
to the to the unexpectedly
unexpectedly high high interference
interference from allfrom
other
not be analyzed for E. coli by the BUWW laboratory due to the unexpectedly high interference from
all other microbiological
growth.growth. In E.
case
coliofand
E. coli and Enterococcus,
only 1–3only 1–3 non-zerowere
results were
microbiological
all other microbiological Ingrowth.
case of In case of E.Enterococcus,
coli and Enterococcus, non-zero
only 1–3 results obtained
non-zero results were
obtained
and onlyand
the only the minimum (0), the maximum and theareaverage
shownare shown on the graph. Theof
obtained andminimum (0), the maximum
only the minimum and the average
(0), the maximum and the average on
arethe graph.
shown onThe
the number
graph. The
number
samples of samples is also givenname
after of
thethe
name of the parameters.
number is ofalso given
samples isafter
also the
given after parameters.
the name of the parameters.
(a)
(a)
Figure 6. Cont.Water 2019, 11, 113 8 of 12
Water 2019, 11, x FOR PEER REVIEW 8 of 12
(b)
Figure 6.
6. Values
Values of microbiological
microbiological indicator parameters. CFU == colony
colony forming
forming units,
units, ii ==individuum.
individuum.
(a) Parameters measured as CFU, (b) Parameters measured
measured as
as individual
individual entities.
entities.
All parameters, except E. coli, have a lower average and and median in in the
the filtrate
filtrate compared to river
water.
water. E. coli was present in only one river and two filtrate samples:
present in only one river and two filtrate samples: 3 i/100 3 i/100 mL (individuum/100 mL),
(individuum/100 mL),
6 i/100
i/100 mLmL and
and 33 i/100
i/100mL
mLrespectively.
respectively. Therefore,
Therefore,there
there isis insufficient
insufficient data
data toto evaluate
evaluate the change
during the filtration for E. coli. TheThe reduction
reduction inin percentage
percentage was calculated for every parameter based
on the raw water samples with non-zero values (Table (Table 3).
3).
Twenty samples were analyzed for each parameter, except for Enterococcus (17 samples) and
Pseudomonas aeruginosaTable Reduction of
(four3.samples). microbiological
Both the raw water indicator
andparameters.
the filtered water showed high
variation in the measured concentrations.
Reduction in % Based on the average
Number of Non-Zero
reductions, the box diagrams and the
Number of Filtered Water Samples
Parameter
non-zero samples from river, the most effective reduction is achieved regarding Pseudomonas,
Minimum Average Maximum River Water Samples with Zero Result (100% Reduction)
Clostridium and
Colony count, 22 ◦colony
C count.
15 Coliform
43 and100E. coli numbers 16were close to zero at all times. 2 This is due
to Colony
the clean 37 ◦ C of the10source water
count,state 39 and100to the lack of18 any significant fecal contamination 2 and
Coliforms 20 41 100 10 3
wastewater discharge
Enterococcus during
45 the sampling
68 period.
100 3 1
Clostridium 16 80 100 15 8
Pseudomonas aeruginosa 57
Table 81
3. Reduction of100 4
microbiological indicator parameters. 2
Reduction in % Number of
Twenty samples were analyzed for each parameter, except Number of
for Enterococcus (17 samples) and
Filtered Water
Pseudomonas aeruginosa (four samples). Both the raw water and Non-Zero
the filtered water showed high
Parameter Samples with Zero
variation in the measured Minimum Average
concentrations. Maximum
Based on the averageRiver Water the box diagrams and
reductions,
Result
the non-zero samples from river, the most effective reduction is Samples
achieved regarding Pseudomonas,
(100% Reduction)
Clostridium and colony count. Coliform and E. coli numbers were close to zero at all times. This is
Colony count, 22 °C 15 43 100 16 2
due to the clean state of the source water and to the lack of any significant fecal contamination and
Colony count, 37 °C 10 39 100 18 2
wastewater discharge during the sampling period.
Coliforms 20 41 100 10 3
A paired t-test was carried out on all parameters except E. coli, which has too much zero measured
Enterococcus 45 68 100 3 1
data (Table 4). At a 0.05 significance level, it can be rejected that there is no difference between samples
Clostridium 16 80 100 15 8
from the river and the filtered water for all parameters, except for coliforms and Enterococcus.
Pseudomonas
57 81 100 4 2
aeruginosa
A paired t-test was carried out on all parameters except E. coli, which has too much zero
measured data (Table 4). At a 0.05 significance level, it can be rejected that there is no differenceColony Colony
Pseudomonas
Count, Count, Coliforms Enterococcus Clostridium
Aeruginosa
22 °C 37 °C
Mean
49.00 41.95 2.63 1.76 9.67 30.25
Waterdifference
2019, 11, 113 9 of 12
Standard error 23.47 18.00 1.67 1.75 3.41 10.87
t-test p-value 0.049 0.030 0.132 0.327 0.010 0.050
Table 4. Paired t-test results.
3.3. Reverse Osmosis Results
Colony Count, Colony Count, Pseudomonas
Coliforms Enterococcus Clostridium
22 ◦ C 37 ◦ C Aeruginosa
The RO unit has49.00
Mean difference
been operated 41.95
with slow filtered
2.63
water produced
1.76
purely
9.67
from surface water
30.25
from 1 February
Standard error 201723.47
to 10 July 2017.18.00
The river water
1.67was spiked1.75
with groundwater
3.41 extracted
10.87from
t-test p-value
a nearby well during 0.049 0.030 from 12 July
a second test period 0.1322017 to 20.327 0.010 The groundwater
November 2017. 0.050
contained dissolved iron in concentrations of 5–10 mg/L and manganese in concentrations of 2–5
3.3.
mg/L. Reverse
BeforeOsmosis Results
spiking, dissolved iron concentrations were below 100 µg/L and manganese was below
the detection limit (10 µg/L) above the filter. Dissolved iron concentration increased to 150–200 µg/L
The RO unit has been operated with slow filtered water produced purely from surface water
and manganese to 300 µg/L above the filter after spiking.
from 1 February 2017 to 10 July 2017. The river water was spiked with groundwater extracted from
In order to push the slow filtration system more toward anoxic conditions, fresh riverbed
a nearby well during a second test period from 12 July 2017 to 2 November 2017. The groundwater
material from the Danube was placed on top of the sand in a 10 cm thick layer. Even after this, 1–4
contained dissolved iron in concentrations of 5–10 mg/L and manganese in concentrations of 2–5 mg/L.
mg/L dissolved oxygen could be observed in the filtrate, but dissolved iron concentration in the
Before spiking, dissolved iron concentrations were below 100 µg/L and manganese was below the
filtrate increased to 200–250 µg/L. As shown in Figure 7, the long-term permeability rate increased
detection limit (10 µg/L) above the filter. Dissolved iron concentration increased to 150–200 µg/L and
from 0.011 LMH/bar/day to 0.017 LMH/bar/day. LMH reprsenets the membrane flux and it stands
manganese to 300 µg/L above the filter after spiking.
for “liter per square meter per hour”, L·m−2·h−1. Divided by the transmembrane pressure and the
In order to push the slow filtration system more toward anoxic conditions, fresh riverbed material
elapsed time, it gives the average rate of permeability decrease.
from the Danube was placed on top of the sand in a 10 cm thick layer. Even after this, 1–4 mg/L
Apart from the random errors due to the manual reading of pressure gauges and flow meters,
dissolved oxygen could be observed in the filtrate, but dissolved iron concentration in the filtrate
the permeability shows a clear decreasing tendency, as expected. A sudden drop can be observed
increased to 200–250 µg/L. As shown in Figure 7, the long-term permeability rate increased from
when the filtration is started after each chemical cleaning. After the first 1–2 days, the plotted linear
0.011 LMH/bar/day to 0.017 LMH/bar/day. LMH reprsenets the membrane flux and it stands for
tendency is present for a long duration (50–150 days). Even though the permeability decreased to
“liter per square meter per hour”, L·m−2 ·h−1 . Divided by the transmembrane pressure and the elapsed
one-third of its original value, it was possible to restore it.
time, it gives the average rate of permeability decrease.
Figure 7. Relationship between permeability with 100 µg/L and 200 µg/L dissolved iron and time
Figure 7. Relationship
−2 ·h−1 ).
between permeability with 100 µg/L and 200 µg/L dissolved iron and time
(LMH = L·m−2
(LMH = L·m ·h−1).
Apart from the random errors due to the manual reading of pressure gauges and flow meters,
4. Discussion
the permeability shows a clear decreasing tendency, as expected. A sudden drop can be observed
whenItthe
hasfiltration
to be noted that indicator
is started parameters
after each are not well
chemical cleaning. suited
After for the
the first 1–2quantitative assessment
days, the plotted linear
of pathogens
tendency or microbial
is present activity.
for a long durationThese standard
(50–150 days). methods are primarily
Even though designed
the permeability as safety
decreased to
one-third of its original value, it was possible to restore it.
4. Discussion
It has to be noted that indicator parameters are not well suited for the quantitative assessment of
pathogens or microbial activity. These standard methods are primarily designed as safety indicators for
distinguishing between the negative and positive (non-zero) samples. In order to assess microbiological
activity and the biomass, other emerging methods are available such as ATP or RNA analysis,
measurement of certain enzymes, etc. [18].Water 2019, 11, 113 10 of 12
Due to the low number of bacteria in the river water, only less than 1 log removal values could be
observed during the time of the experiment. The good quality of the river water can be explained by
no wastewater discharge nor any polluting activity in the vicinity and the location of the water intake
structure at a stagnant zone in the river. Most suspended solids from the main stream settle before
they reach the inlet of the water intake.
Because of these low initial values, a strong reduction could only be observed for three parameters:
colony count at different temperatures and Pseudomonas. Although colony count has the largest range
in reduction (10–100%), it gives the best proof of reduction in the number of microorganisms since it
had the most positive samples in the river water. An even better reduction was achieved regarding
Pseudomonas, however, two out of four samples from the river were found to be free of Pseudomonas.
The results obtained in this experiment for the reduction of microbiological indicator parameters
are well within the range of previously reported values [7]. For Pseudomonas and total bacteria, 60%
removal was obtained in small scale filter columns with 1 m thick sand layer and 0.15 m/h loading
rate. It was also found that Pseudomonas species dominate the bacterial biofilm [19]. During the
interpretation of the results, it has to be taken into account that even though there is an overall
reduction in microbiological activity due to substrate consumption, the developed biofilm itself can
detach from the solid surfaces of the filter and may cause higher results in the samples. Small slow sand
filters with a thin 15 cm fine sand layer were reported to reject coliforms with 90–97% efficiency [20].
Due to the very low pathogen content of surface water involved in this demonstration, it is
problematic to compare results with similar studies. A similar investigation on the application of
reverse osmosis directly after bank filtration described in “Desalination and Water Purification Research
and Development Program Report No. 122” [15], where coliforms ranged between 200–10,000 colony
forming units (CFU)/100 mL in three investigated river sites. The report also mentions 0.052–1.62 mg/L
of iron and 0.05–0.617 mg/L of manganese in the bank filtered water used for reverse osmosis
membrane feed from the Ohio, Missouri and Raccoon rivers. Total rejection of coliforms on the reverse
osmosis was also reported [15].
The feed water quality requirement for the membranes involved in the current demonstration
are less than 0.1 mg/L of total iron and manganese and less than 100 CFU/mL according to the
manufacturer’s suggestions.
The transport of slowly biodegradable organic matter in the surface water should be taken into
account when the short distance to the extraction point is considered. Such materials are humic
acids, lignin and another plant residues, which can be found in surface waters used for bank filtration.
The biologically active layer and the subsequent adsorption processes during slow filtration are capable
of reducing the concentration of such components [21]. If iron and manganese precipitates in the active
layer due to the oxic conditions, it can be beneficial not only to the adsorption of the colloid material,
but for the immobilization of microorganisms as well [22], as long as severe clogging can be avoided.
Since the experiment was conducted under circumstances characteristic for pure slow sand
filtration, its results support the hypothesis that the thin boundary layer and a short (1.2 m) flow
through a porous media can be responsible for as much as 80% or more reduction in the common
microbiological indicator parameters. Compared with common flow path lengths at Hungarian bank
filtration sites of 10–50 m and the high iron and manganese concentration in land-side groundwater,
it is important to define the ideal flow path length during the design. This requires a cost–benefit
analysis, especially when iron and manganese sensitive membrane technologies are to be installed.
5. Conclusions
In general, it is customary to increase the distance of the extraction element from the surface
water boundary for safety considerations. In case of combined systems, when new post-treatment
technologies such as ultrafiltration, nanofiltration or reverse osmosis with high pathogen removal
efficiency are applied, shorter flow path lengths could be an advantage to prevent increased
concentration of dissolved iron and manganese. In the case of RBF, there are severe uncertainties andWater 2019, 11, 113 11 of 12
safety considerations for the distance of the extraction point from the river. The most important is
riverbed erosion, which heavily puts the extent of the biologically active zone into question. On the
other hand, artificial structures such as filter dams with geotextile support may be adequate to provide
proper conditions for short travel distances.
It was found that as long as the bank filtered water fulfills the required quality standards set by
the manufacturer, the permeability of the reverse osmosis membrane can be sustained for a long time,
even for 50–100 days. The quality of the pumped water as a mixture of bank filtrate and land-side
groundwater is site specific and in Hungary, especially at the lower Danube region, tends to contain
more than 0.2 mg/L of dissolved iron due to the groundwater flow. In order to make the long-term
operation of reverse osmosis possible, short distances between the river bank and the extraction point
will help to maintain oxic conditions and minimize the iron input from groundwater flow. Reverse
osmosis is known to be capable of rejecting pathogens almost completely. Even if a higher number
of bacteria break through the bank filtration because of the shorter distances, the risks should not be
higher than for classic water treatment processes.
In this way, the natural system (the biologically active zone) can be utilized not only to decrease
turbidity and reject a significant number of pathogens, but to reduce the biofouling potential of the
membrane by the removal of easily degradable substrates which otherwise contribute to biofilm
growth. Membrane filtration techniques have a high efficiency in pathogen rejection, but are sensitive
to fouling caused by iron or manganese precipitation. When membrane filtration is applied, the
decrease in the portion of land-side groundwater is of first priority and the pathogen rejection can
be safely carried out with the combination of short filtration by RBF or other MAR schemes and
membrane treatment.
Author Contributions: All authors collaborated in this work. Writing—Original Draft Preparation, E.S.;
Writing—Review and Editing, Z.G.
Funding: All primary data was collected within the AquaNES project. This project has received funding from the
European Union’s Horizon 2020 Research and Innovation Program under grant no. 689450. www.aquanes-h2020.
eu.
Acknowledgments: The authors would like to express their gratitude to the staff operating the pilot water
treatment plant: Ilona Dalkó, Kitti Tafner and Tamás Papp in particular. The authors also acknowledge the helpful
comments from T. Grischek during final paper preparation.
Conflicts of Interest: The authors declare no conflict of interest.
References
1. Dillon, P.; Stuyfzand, P.; Grischek, T.; Lluria, M.; Pyne, R.D.G.; Jain, R.C.; Bear, J.; Schwarz, J.; Wang, W.;
Fernandez, E.; et al. Sixty years of global progress in managed aquifer recharge. Hydrogeol. J. 2018, 1–30.
[CrossRef]
2. Salamon, E. Investigation of slow filtration followed by reverse osmosis (Lassú szűrés–fordított ozmózisos
ivóvíz tisztítási technológiai sor vizsgálata). In Proceedings of the Membrane Technology Water Industry
Day Conference, Budapest, Hungary, 9 November 2017.
3. Collins, M.R.; Eighmy, T.T.; Fenstermacher, J.M.; Spanos, S.K. Removing Natural Organic Matter by
Conventional Slow Sand Filtration. J. Am. Water Works Assoc. 1992, 84, 80–90. [CrossRef]
4. Jenkins, M.W.; Tiwari, S.K.; Darby, J. Bacterial, viral and turbidity removal by intermittent slow sand filtration
for household use in developing countries: Experimental investigation and modeling. Water Res. 2011, 45,
6227–6239. [CrossRef] [PubMed]
5. Hoffmann, A.; Gunkel, G. Bank filtration in the sandy littoral zone of Lake Tegel (Berlin): Structure and
dynamics of the biological active filter zone and clogging processes. Limnologica 2011, 41, 10–19. [CrossRef]
6. Ray, C.; Grischek, T.; Schubert, J.; Wang, J.Z.; Speth, T.F. A Perspective of Riverbank Filtration. J. Am. Water
Works Assoc. 2002, 94, 149–160. [CrossRef]
7. Seeger, E.M.; Braeckevelt, M.; Reiche, N.; Müller, J.A.; Kästner, M. Removal of pathogen indicators from
secondary effluent using slow sand filtration: Optimization approaches. Ecol. Eng. 2016, 95, 635–644.
[CrossRef]Water 2019, 11, 113 12 of 12
8. Pfannes, K.R.; Langenbach, K.M.W.; Pilloni, G.; Stührmann, T.; Euringer, K.; Lueders, T.; Neu, T.R.;
Müller, J.A.; Kästner, M.; Meckenstock, R.U. Selective elimination of bacterial faecal indicators in the
Schmutzdecke of slow sand filtration columns. Appl. Microbiol. Biotechnol. 2015, 99, 10323–10332. [CrossRef]
[PubMed]
9. Weiss, W.J.; Bouwer, E.J.; Aboytes, R.; LeChevallier, M.W.; O’Melia, C.R.; Le, B.T.; Schwab, K.J. Riverbank
filtration for control of microorganisms: Results from field monitoring. Water Res. 2005, 39, 1990–2001.
[CrossRef] [PubMed]
10. Van Driezum, I.H.; Chik, A.H.S.; Jakwerth, S.; Lindner, G.; Farnleitner, A.H.; Sommer, R.; Blaschke, A.P.;
Kirschner, A.K.T. Spatiotemporal analysis of bacterial biomass and activity to understand surface and
groundwater interactions in a highly dynamic riverbank filtration system. Sci. Total Environ. 2018, 627,
450–461. [CrossRef] [PubMed]
11. Grischek, T.; Bartak, R. Riverbed Clogging and Sustainability of Riverbank Filtration. Water 2016, 8, 604.
[CrossRef]
12. des Tombe, B.F.; Bakker, M.; Schaars, F.; van der Made, K.-J. Estimating Travel Time in Bank Filtration
Systems from a Numerical Model Based on DTS Measurements. Ground Water 2018, 56, 288–299. [CrossRef]
[PubMed]
13. Albergamo, V.; Blankert, B.; Cornelissen, E.R.; Hofs, B.; Knibbe, W.-J.; van der Meer, W.; de Voogt, P. Removal
of polar organic micropollutants by pilot-scale reverse osmosis drinking water treatment. Water Res. 2019,
148, 535–545. [CrossRef] [PubMed]
14. Davies, P.A. A solar-powered reverse osmosis system for high recovery of freshwater from saline
groundwater. Desalination 2011, 271, 72–79. [CrossRef]
15. Gooters, S. The Role of Riverbank Filtration in Reducing the Costs of Impaired Water Desalination; Desalination
and Water Purification Research and Development Program Report No. 122; Department of the Interior,
Bureau of Reclamation, Water Treatment Engineering and Research Group: Denver, CO, USA, 2006.
16. Argo, D.R. Use of Lime Clarification and Reverse Osmosis in Water Reclamation. J. Water Pollut. Control Fed.
1984, 56, 1238–1246.
17. MSZ EN ISO 19458:2007 Water Quality—Sampling for Microbiological Analysis (ISO 19458:2006) 21; International
Organization for Standardization: Geneva, Switzerland, 2006.
18. Chan, S.; Pullerits, K.; Riechelmann, J.; Persson, K.M.; Rådström, P.; Paul, C.J. Monitoring biofilm function in
new and matured full-scale slow sand filters using flow cytometric histogram image comparison (CHIC).
Water Res. 2018, 138, 27–36. [CrossRef] [PubMed]
19. Calvo-Bado, L.A.; Pettitt, T.R.; Parsons, N.; Petch, G.M.; Morgan, J.A.W.; Whipps, J.M. Spatial and Temporal
Analysis of the Microbial Community in Slow Sand Filters Used for Treating Horticultural Irrigation Water.
Appl. Environ. Microbiol. 2003, 69, 2116–2125. [CrossRef] [PubMed]
20. Guchi, E.; Leta, S.; Boelee, E. Efficiency of slow sand filtration in removing bacteria and turbidity from
drinking water in rural communities of central Ethiopia. Afr. J. Microbiol. Res. 2014, 8. submitted.
21. Mo, J.; Yang, Q.; Zhang, N.; Zhang, W.; Zheng, Y.; Zhang, Z. A review on agro-industrial waste (AIW)
derived adsorbents for water and wastewater treatment. J. Environ. Manag. 2018, 227, 395–405. [CrossRef]
[PubMed]
22. Bouabidi, Z.; El-Naas, M.; Zhang, Z. Immobilization of microbial cells for the biotreatment of wastewater:
A review. Environ. Chem. Lett. 2018, 1–17. [CrossRef]
© 2019 by the authors. Licensee MDPI, Basel, Switzerland. This article is an open access
article distributed under the terms and conditions of the Creative Commons Attribution
(CC BY) license (http://creativecommons.org/licenses/by/4.0/).You can also read