Hemostasis-On-a-Chip: Impedance Spectroscopy Meets Microfluidics for Hemostasis Evaluation - MDPI
←
→
Page content transcription
If your browser does not render page correctly, please read the page content below
micromachines

Article
Hemostasis-On-a-Chip: Impedance Spectroscopy
Meets Microfluidics for Hemostasis Evaluation
Shadi Karimi 1 , Josep Farré-Lladós 1 , Enrique Mir 2,3 , Ginés Escolar 3 and
Jasmina Casals-Terré 1, *
 1   Mechanical Engineering Department–MicroTech Lab., Universitat Politècnica de Catalunya, Colom 7-11,
     08222 Terrassa, Spain
 2   Instituto de Investigación contra la Leucemia Josep Carreras, Muntaner 383, 08021 Barcelona, Spain
 3   Servicio de Hemoterapia y Hemostasia, Hospital Clínic de Barcelona, Instituto de Investigaciones Biomédica
     August Pi i Sunyer (IDIBAPS), Universidad de Barcelona, 08007 Barcelona, Spain
 *   Correspondence: Jasmina.casals@upc.edu; Tel.: +34-937-398023

 Received: 5 June 2019; Accepted: 12 August 2019; Published: 14 August 2019

 Abstract: In the case of vascular injury, a complex process (of clotting) starts, involving mainly
 platelets and coagulation factors. This process in healthy humans is known as hemostasis, but when
 it is deregulated (thrombosis), it can be the cause of important cardiovascular diseases. Nowadays,
 the aging of the population and unhealthy lifestyles increase the impact of thrombosis, and therefore
 there is a need for tools to provide a better understanding of the hemostasis mechanisms, as well as
 more cost-effective diagnosis and control devices. This study proposes a novel microflow chamber,
 with interchangeable biomimetic surfaces to evaluate global hemostasis, using reduced amounts
 of blood sample and reagents, and also a minimized time required to do the test. To validate the
 performance of this novel device, a study on the new oral anticoagulant Apixaban (APIX) has been
 performed and compared to previous conventional techniques. The test shows an excellent agreement,
 while the amount of the required sample has been reduced (only 100 µL is used), and the amount of
 reagent as well. An imprinted electrode embedded in the chamber in order to measure the impedance
 during the coagulation process. This approach distinguishes the impedance behavior of plasma poor
 in platelets (PPP) and plasma rich in platelets (PRP) for the first time.

 Keywords: organ-on-a-chip; vein-on-a-chip; impedance; microfluidics; hemostasis

1. Introduction
     Hemostasis is the result of the collaboration between plasma and blood cells to stop bleeding
during the initial steps of wound healing. Current unhealthy habits and aging of the population alter
the physiologic balance of blood coagulation, resulting in thrombotic complications. During thrombosis,
the aggregation of platelets and coagulation products can prevent blood flow and cause damage in
downstream organs, resulting in ischemia and/or tissue death.
     Evaluation of hemostasis requires a combination of routine and specialized tests to assess the
interaction of platelet and fibrin components involved in blood clotting. Evaluation of hemorrhagic
disorders does also require time-consuming tests and sophisticated equipment to identify the altered
functional pathways. The diagnosis of thrombotic disorders implies the analysis of the presence and
function of activators and inhibitors participating in these coagulation mechanisms.
     Nowadays, the evaluation of hemostasis is performed under static conditions. The introduction
of microfluidics approaches provides the possibility to mimic blood flow and ex vivo coagulation
with minute volume samples, therefore it is already being used as an important tool to improve the
knowledge on hemostasis processes [1–3].

Micromachines 2019, 10, 534; doi:10.3390/mi10080534                        www.mdpi.com/journal/micromachines
Micromachines 2019, 10, 534                                                                         2 of 11

      A common limitation of the majority of current tests applied to the evaluation of hemostasis is that
they are performed under static conditions, on samples of plasma or enriched platelet suspensions [4].
In contrast with these static tests, bleeding or thrombotic complications occur in whole blood flowing
through damaged vessels. Thus, current tests applied to the evaluation of hemostasis provide a
fragmented view of the isolated components of the hemostasis, disregarding the interactions that must
necessarily occur in flowing blood. Studies using perfusion annular and parallel chamber technologies
with circulating blood have contributed significantly to the knowledge on the function of platelets in the
hemostatic mechanism and the thrombotic complications under shear conditions [5,6]. More recently
developed microfluidic devices have facilitated the implementation of perfusion assays in a more
simplified way than the classic approaches, using small blood samples and facilitating the evaluation
of the results [1–3,7].
      Therefore, the study of blood flow biorheology is of great interest for a better understanding of
hemostasis and the effects of antithrombotic drugs [8,9]. Now microfluidics and micro biomimetic flow
chambers can provide platforms for the ex vivo study of the effects of flow upon blood coagulation
and fibrin formation [10–12].
      Due to the introduction of direct oral anticoagulants (DOACs) to circumvent the frequent
monitoring and dose adjustment with classic Vitamin K antagonists (VKAs), there is now a need
for methods to measure the anticoagulant effects of these drugs in several situations: Hospitalized
or critically ill or bleeding patients. Uncertainties about the use of DOACs in patients requiring an
urgent invasive procedure, suspicion of overdose, recurrence of thrombotic events or confirmation
of adherence, need to be addressed [13,14]. Assessment of the impact of anticoagulant therapies is
simple for VKAs, but very complex for the DOACs. Monitoring antiplatelet therapy or assessing
the potential risk of bleeding or thrombosis requires specialized equipment, specific devices and a
definition of cut-off values for each drug. Unfortunately, tests used to assess the effects of DOACs
on coagulation are drug-specific, and not routinely available at clinical labs. Availability of reliable
point of care (POC) tests which require less volume of sample and a short turnaround of results would
facilitate the evaluation of the anticoagulant activity, the identification of specific patient groups and
the guidance of reversal agents in case of overdose.
      Moreover, antiplatelet agents are prescribed and administered at fixed doses to patients at
risk of cardiovascular complications. Although regular monitoring of their actions is not advised,
several studies have demonstrated that responses to antiplatelet drugs are not uniform [15]. There are
subgroups of patients in whom different laboratory tests indicate suboptimal responses to antiplatelet
drugs. This condition, initially defined as “resistance” to the antiplatelet agent, has evolved to a more
descriptive concept of patients with “high on-treatment platelet reactivity” (HPR) [16]. HPR exposes
patients to an increased risk of major adverse cardiovascular events, and may require dual therapy.
Conversely, the concept “low on-treatment platelet reactivity” (LPR) defines subgroups of patients
exposed to an enhanced bleeding risk. Optimized antiplatelet therapy based upon a reliable functional
assay will improve the balance of efficacy vs. safety in subgroups of patients.
      The combination of techniques evaluating the platelet and coagulation elements of hemostasis is
the initial step towards the development of POC devices that could efficiently and reliably evaluate
the contribution of both components in minute blood samples or at patients’ bedsides, which is
highly desirable.
      The research work presented here leads to a fundamental contribution to the understanding of
hemostasis processes inside vessels, which is of utmost importance to the medical community in order
to enhance the treatment of cardiovascular diseases. The design and the validation of the microflow
chamber as a tool to characterize a dominant behavior of plasma poor in platelets (PPP) or plasma rich
in platelets (PRP) is the base for a highly reliable point-of-care device for antithrombotic treatment
monitoring. In the past few years, direct oral anticoagulants (DOACs) were introduced to circumvent
the frequent monitoring of classical ones, and therefore decrease the burden on public health systems
in countries where the growth of the elderly population has spread the cardiovascular disease impact.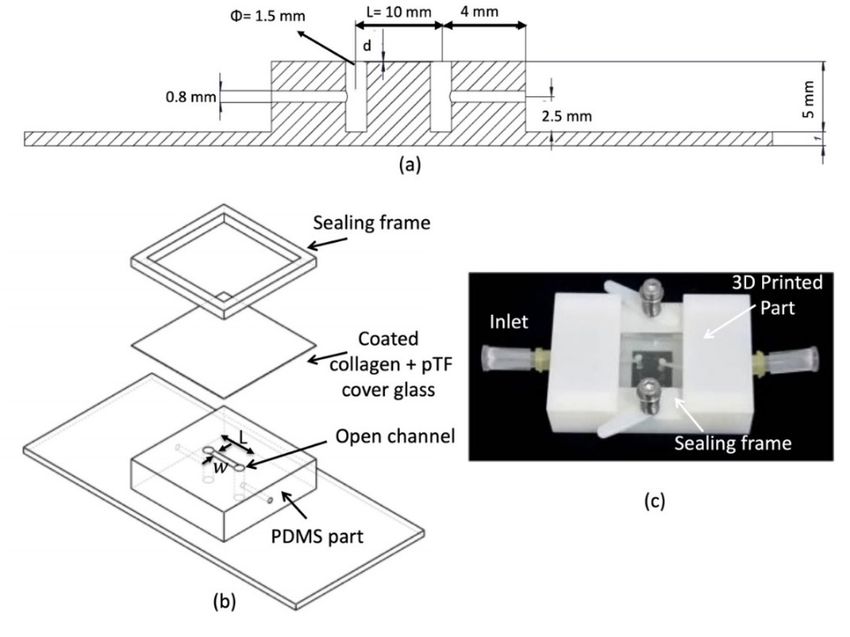
Micromachines 2019, 10, x                                                                                     3 of 11

     But there is a need to measure the effectiveness of these treatments, especially near the patient.
The use of biomimetic microfluidic channels for studying the hemostasis process reduces the time
and the number
Micromachines 2019, of
                    10, samples
                        534     required, and provides a tool to provide results near the patient. 3 of 11

2. Materials and Methods
       But there is a need to measure the effectiveness of these treatments, especially near the patient.
 The  use of biomimetic
2.1. Microflow    Chamber microfluidic      channels for studying the hemostasis process reduces the time and
                             Design and Manufacturing
 the number of samples required, and provides a tool to provide results near the patient.
      The microfluidic device has three main parts: A polydimethylsiloxane (PDMS) part that contains
an  open microfluidic
 2. Materials    and Methodschannel, and it has been manufactured by conventional lithography methods,
with a glass-cover to mimic the vasculature tissue and a 3D-printed frame, see Figure 1b. The goal of
 2.1.printed
the   Microflow    Chamber
               frame          Designpressure
                       is to apply    and Manufacturing
                                                on the glass in order to seal the channel. Two springs that are
embedded      in the frame
       The microfluidic        (Figure
                            device   has1c)  allow
                                         three  maintheparts:
                                                         exchange    of the glass to morphologically
                                                              A polydimethylsiloxane                     characterize
                                                                                           (PDMS) part that   contains
the  thrombi    after the  tests.
 an open microfluidic channel, and it has been manufactured by conventional lithography methods,
 withAs   shown in Figure
       a glass-cover    to mimic1 the
                                    themicrofluidic
                                        vasculaturePDMS       part ahas
                                                      tissue and         a channelframe,
                                                                     3D-printed      (widthsee
                                                                                             (wFigure
                                                                                                 = 500 µm), length
                                                                                                       1b. The  goal(L
                                                                                                                     of
=the
  10 printed
      mm), depthframe(dis=to50apply
                               µm)).pressure
                                       Two side  onchannels
                                                    the glassare  made to
                                                               in order   with
                                                                             seala the
                                                                                   1.5 channel.
                                                                                       mm puncherTwo to connect
                                                                                                      springs    with
                                                                                                               that are
the  inlet and
 embedded     in outlet   of the
                  the frame       device.
                              (Figure  1c) Finally,
                                           allow the the  channelofisthe
                                                       exchange       sealed
                                                                          glasswith   the glass, whichcharacterize
                                                                                 to morphologically     is previously
                                                                                                                    the
coated
 thrombi with
           aftercollagen   and placenta tissue factor to mimic blood vessel structure.
                  the tests.

       Figure 1. 3D schematics and the picture of the biomimetic microfluidic channel. (a) the cross-sectional
      Figure 1. 3D schematics and the picture of the biomimetic microfluidic channel. (a) the cross-sectional
       view of the microfluidic channel. (b) 3D assembly of the different parts of the microfluidic channel.
      view of the microfluidic channel. (b) 3D assembly of the different parts of the microfluidic channel.
       (c) Real image of the microfluidic channel.
      (c) Real image of the microfluidic channel.
     As shown in Figure 1 the microfluidic PDMS part has a channel (width (w = 500 µm), length
2.2.
(L =Biomimetic  Coatings
     10 mm), depth    (d =and
                            50 Sample Preparation
                               µm)). Two  side channels are made with a 1.5 mm puncher to connect with
the inlet
     Glassand  outlet
           slides (18ofmm the×device.
                               18 mm Finally,
                                       × 1 mm,the   channel
                                                 from  DeltaisLab)
                                                               sealed
                                                                   andwith  the glass, which
                                                                       interdigitated         is previously
                                                                                       electrodes  (Micrux
coated  with collagen   and  placenta tissue factor to mimic  blood vessel structure.
ED_IDE3-Au) were cleaned and functionalized with collagen and tissue factor. Functionalized slides
or electrodes were stored at 4 °C overnight. Once assembled, channels were coated overnight with
 2.2. Biomimetic Coatings and Sample Preparation
collagen Type I (Chronology Corp. Havertown, PA, USA) and tissue factor (Innovin, Siemens,
Madrid,
      GlassSpain)
              slidesto(18achieve
                          mm × 18 coating
                                     mm ×concentrations
                                           1 mm, from Delta equivalent
                                                                 Lab) and tointerdigitated
                                                                              30.9 mg/cm2 electrodes
                                                                                            and 0.95 (Micrux
                                                                                                       ng/cm2,
respectively,
 ED_IDE3-Au)    aswere
                    previously
                         cleaneddescribed [17], and were
                                 and functionalized  withflushed   with
                                                            collagen andsaline
                                                                           tissueprior to Functionalized
                                                                                  factor. perfusion in order  to
                                                                                                          slides
eliminate   the remaining
 or electrodes   were stored        ◦
                             collagen
                               at 4 Cover  the surface.
                                       overnight.  Once assembled, channels were coated overnight with
      Blood
 collagen     samples
           Type          were collected
                  I (Chronology         from healthyPA,
                                  Corp. Havertown,     adults
                                                         USA)(nand= 10)  after
                                                                     tissue    written
                                                                             factor     consent
                                                                                    (Innovin,    in accordance
                                                                                              Siemens,  Madrid,
with  thetoethics
 Spain)     achievecommittee   from the Hospital
                      coating concentrations                  30.9 mg/cm2 and 0.95 ng/cm2 , respectively, as
                                                  Clinic detoBarcelona.
                                               equivalent
previously described [17], and were flushed with saline prior to perfusion in order to eliminate the
 remaining collagen over the surface.
      Blood samples were collected from healthy adults (n = 10) after written consent in accordance
with the ethics committee from the Hospital Clinic de Barcelona.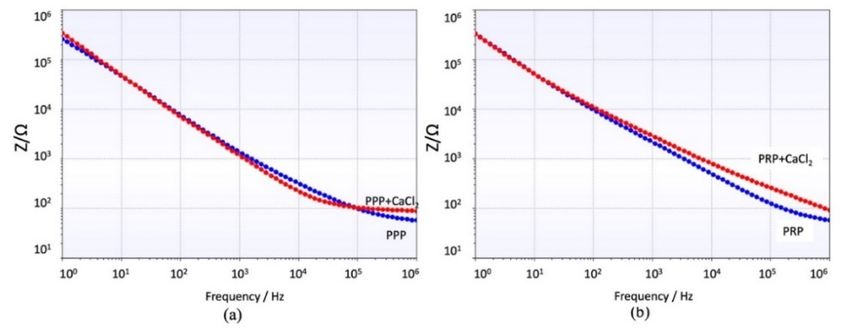
Micromachines 2019, 10, 534                                                                        4 of 11

     Blood was drawn into a syringe prefilled with low molecular weight heparin (LMWH) and
centrifuged at 14,000 rpm for 2 min to obtain plasma poor in platelets (PPP) and at 1,000 rpm for 3 min
to obtain plasma rich in platelets (PRP). PPP and PRP will be used to study the formation of fibrin and
platelets aggregates, respectively.

2.3. Flow Assays
     The study of blood or plasma flow in a square microchannel can be analyzed by solving the
steady-state Navier-Stokes equation for low Reynolds numbers:

                                               ∇ · u = 0.                                             (1)

                                               ∇P = ∇ · τ                                             (2)

where u is velocity, P is pressure and τ is the wall shear stress.
      The wall shear stress can determine the growth rate of the thrombi during the coagulation
process, and it is one of the parameters under the study [18]. Blood is stored in a collection tube with
anti-coagulants, and then using a centrifuge, the main cells (red blood cells (RBCs) and white blood
cells (WBCs)) are separated from the plasma. Plasma constitutes around 55% of the blood volume,
and contains numerous proteins, including the clotting factors which are the focus of this study,
and other suspended materials. For blood coagulation studies, PRP and PPP are used to evaluate the
function of platelets and fibrin(ogen), respectively. While whole blood behaves as a non-Newtonian
fluid, and the viscosity changes with the applied shear rate, plasma with a water content of almost 95%
behaves as a Newtonian Fluid.
                                                                                         .
      For Newtonian fluids, the shear stress is linearly proportional to the shear rate γ, and the shear
                                         .
rate tensor can be expressed as τ = η · γ, being that η is the viscosity of the fluid. Using the relation
between the flow rate Q in a rectangular microchannel and the Pressure loss [19]

                                          wd3
                                                 "           #
                                                           d
                                       Q≈      ∇P 1 − 0.63                                            (3)
                                          12ηL             w

where w is the width of the channel, d is the depth and L the length.
                              .
    Then the wall shear rate γ can be related to the volumetric flow rate Q according to [20]:

                                                .   32 Q
                                               γ≈                                                     (4)
                                                    π D3h

where Dh = 2w · d/(w + d) is the hydraulic diameter of the rectangular channel. Since plasma behaves
                                                       .
approximately as a Newtonian fluid, a wall shear rate γ of 300 s−1 was achieved on the glass surface,
applying a flow rate of 0.1 mL/h to the microchannel through a syringe pump.

2.4. Image Capture and Analysis
     The perfused channels were fixed with paraformaldehyde 1% for 15 min at 4 ◦ C and further
incubated with glycine 1% for 10 min to reduce high background staining due to free unreactive
aldehyde groups. Then the channels were blocked with 1% bovine serum albumin (BSA) for 15 min
prior to incubating with specific antibodies. A combination of indirect and direct immune-fluorescence
was carried out as follows.
     First, platelets were stained with a mouse anti-CD36 primary antibody for 1 h at room temperature
(RT, 37 ◦ C) in a humidified chamber. Then, a secondary antibody anti-mouse Alexa Fluor 488 was
incubated together with a conjugated antibody anti-fibrinogen Alexa Fluor 594 for 1 h at RT in a
humidified chamber. Pictures were acquired using a confocal microscope (SP5, Leica Microsystems,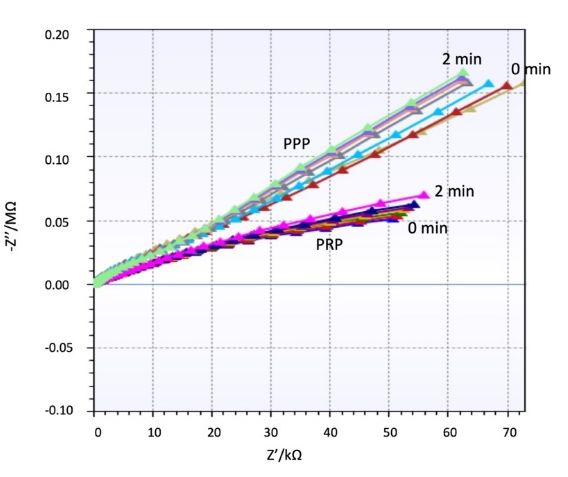
Micromachines 2019, 10, 534 5 of 11
Barcelona, Spain). Acquired images from the channels of the micro-chamber were analyzed using the
ImageJ software (v 1.43m), (Rasband, W.S., ImageJ, National Institutes of Health, Bethesda, MD, USA).
Co-distributions between the platelets (green) and fibrin (red) were analyzed. The intensity of
each marker was densitometrically analyzed individually in each picture, superposed and expressed
as a percentage
Micromachines 2019, of
10, the
x covered surface corresponding to the entire image. 5 of 11
2.5. Impedance
2.5. Impedance Characterization
Characterization
Electrochemical Impedance
Electrochemical Impedance Spectroscopy
Spectroscopy (EIS)
(EIS) studies
studies the
the system
system response
response toto aa small
small amplitude
amplitude
sinusoidal signal
sinusoidal signal at
at different
different frequencies,
frequencies,and
andititcan
cangive
giveinformation
informationabout
aboutthe
theanalytic
analyticmolecules
moleculesinina
fluidic solution (for instance, a blood sample). In this new chamber, the glass slide was replaced
a fluidic solution (for instance, a blood sample). In this new chamber, the glass slide was replaced by the
by
glass with printed electrodes (ED_IDE3-Au) from Micrux (Oviedo, Spain), see Figure
the glass with printed electrodes (ED_IDE3-Au) from Micrux (Oviedo, Spain), see Figure 2. 2.
Figure 2. (a) Pictures of the test chamber assembled and open. (b) Pictures of the microfluidic channel
Figure 2. (a) Pictures of the test chamber assembled and open. (b) Pictures of the microfluidic channel
inside the test chamber with the thrombogenic surface with embedded electrodes. (c) Impedance model
inside the test chamber with the thrombogenic surface with embedded electrodes. (c) Impedance
of the electrode inside the channel.
model of the electrode inside the channel.
Figure 2a,b show different images of the biomimetic microfluidic channel for impedance
Figures 2a,b show different images of the biomimetic microfluidic channel for impedance
measurements. Now the glass cover of the channel has the electrodes (ED_IDE3-Au) from Micrux
measurements. Now the glass cover of the channel has the electrodes (ED_IDE3-Au) from Micrux
which are 180 gold strips separated 5 µm apart and with 5 µm in width, forming a 3.5 mm circle.
which are 180 gold strips separated 5 µm apart and with 5 µm in width, forming a 3.5 mm circle. The
The electrodes close the channel and are biomimetically covered, as described in Section 2.2. Figure 2c
electrodes close the channel and are biomimetically covered, as described in Section 2.2. Figure 2c
portrays the schematics of the electric equivalent circuit of the electrodes. When the plasma with
portrays the schematics of the electric equivalent circuit of the electrodes. When the plasma with the
the platelets (PRP—plasma rich in platelets) or fibrinogen (PPP—plasma poor in platelets) flows
platelets (PRP—plasma rich in platelets) or fibrinogen (PPP—plasma poor in platelets) flows on the
on the surface of the electrodes, the sensor can be used to determine the composition of the fluidic
surface of the electrodes, the sensor can be used to determine the composition of the fluidic solution,
solution, since their components show a different imaginary and real impedance response at different
since their components show a different imaginary and real impedance response at different
frequencies. For an arbitrary electrode, its impedance (ZE ) can be described by different components
frequencies. For an arbitrary electrode, its impedance (ZE) can be described by different components
according to [21]:
according to [21]:
1
ZE = (Rs + 2Zdl ) Z (5)
1 g p
jωC
Z = (R + 2Z ) Z (5)
jωC
1
where Rs is the resistance of the solution, Zdl = (Rct + Zw )k jωC is the double-layer impedance and
where Rs is the resistance of the solution, Z = (R + Z ) ∥ dl is the double-layer impedance
Cg is the dielectric capacitance and Zp the parasitic capacitance of the substrate.
g is resistance
and CThe the dielectric capacitance
of the solution, and
Rs =Zg/
p the
(σWparasitic
), relatescapacitance of the of
to the geometry substrate.
the electrode g = g(L, S),
The resistance of the solution, R = g⁄ (σW) , relates to the geometry
where L is the length of the electrode and S the separation between electrodes and of the electrode g = g(L, S),
the conductivity of
where L is the length of the electrode and S the separation between electrodes and the conductivity
the solution σ. In our design, W, the width of the electrode in-plane, and g, are constant parameters of
of
thethe solution σ. In our design, W, the width of the electrode in-plane, and g, are constant parameters
electrode.
of the electrode.
Therefore, Rs is related to the conductivity of the solution, σ = qn (μ + μ ), where q is the
electric charge, μ and μ are the ionic mobilities of the dominant positive and negative ions in the
solution, and n is the ionic concentration, which can vary during coagulation.
The double-layer impedance (Z ) captures the phenomena around the electrode; the term RMicromachines 2019, 10, 534 6 of 11
Therefore, Rs is related to the conductivity of the solution, σ = qni µp + µn , where q is the
electric charge, µp and µn are the ionic mobilities of the dominant positive and negative ions in the
solution, and ni is the ionic concentration, which can vary during coagulation.
The double-layer impedance (Zdl ) captures the phenomena around the electrode; the term Rct
captures the charge transfer between electrodes and Zw the mass-transfer between them. In case
of non-faradaic electrodes, since there
is no surface reactions ( Rct → ∞ ), therefore, there is no mass
1
transfer. Besides, Zw ≈ 0, Zdl = jωCdl , where Cdl originates from the adsorbed charge layer and
diffuse layer charge. For electrode separation higher than Debye length (λ ∼ 1 µm), Cdl can be
q
2εni q2
q V
ac
described by diffuse layer capacitance Cdl = Cdi f = A kT cosh 2kT , where A is the area of the
electrode (A = wL), Vac is the voltage applied, q is the electric charge, k is the Boltzmann constant, T is
the temperature of the solution, and ε is the permittivity of the medium separating the electrodes.
For a parallel plate system, the geometric capacitance form by the electrodes and the solution is
Cg = A ε/S, where A is the area of the electrodes, ε the permittivity of the medium separating the
electrodes and S is the separation between the electrodes.
If the substrate is highly resistive, such as glass (low dielectric constant), the frequency response
of an ideal non-Faradaic shows three different regions:
2
1. For low frequencies flow = 2πRs Cdl , Cdl dominates the impedance measured.
2. For frequencies flow < f < fhigh = 2
2πRs Cg , Rs is the dominant impedance.
3. For frequencies f > fhigh , Cg is the dominant impedance.
The time dependence of the different components is:
Rs is depending upon the concentration of the ions in the solution, since during coagulation
different ions are involved. Rs will change during the coagulation process; basically, if the concentration
is increased, the conductivity will increase and Rs decreases.
Cdl will also increase if the concentration of ions is increased, and finally, the Cg is independent on
the ion concentration. Cg changes could be related to changes in the permittivity of the solution, that
could change if there were volume changes of the sample, but since our system is inflow, the volume
covering the electrodes is constant.
Therefore, as the blood clot is forming, the change in ion species will be detectable using impedance,
and the combination of this quantification method with the biomimetic microfluidic chamber allows a
quantification of the effects of the shear rate of the process of clot formation.
To study this change of impedance, PalmSens 4 EIS was connected to the electrodes to measure
impedance at different frequencies, see USB connection in Figure 2. A 100 µL PPP or PRP sample is
loaded to an Eppendorf and withdrawn with a syringe pump.
Prior to each test, the plasma (PPP or PRP) was placed at room temperature for 30 min. Then,
the plasma sample was mixed with 1 µL calcium chloride (CaCl2 (5mM)) to induce coagulation.
Electrical impedance across the electrodes between 10 Hz and 1 MHz was measured while a sinusoidal
voltage of 250 mV was applied.
Illustration of the electrodes in contact with the sample and a photograph of the microfluidic chip
is shown in Figure 2.
3. Results
3.1. Flow Assay Results
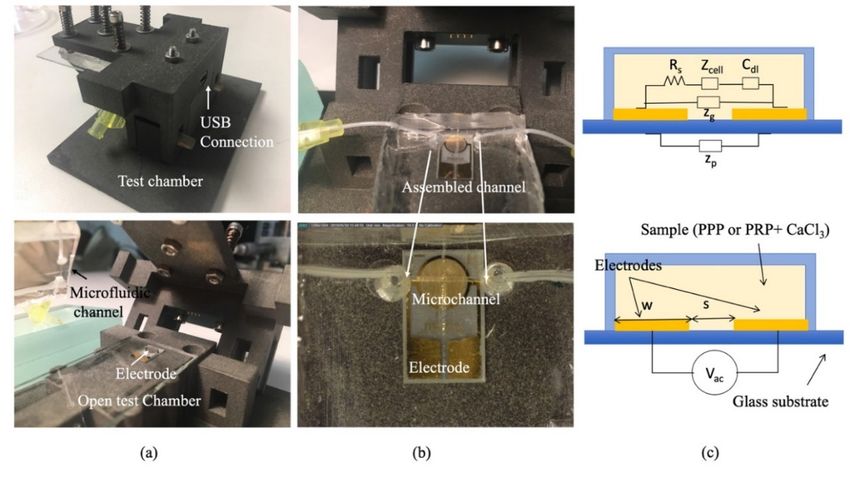
Figure 3 provides a representative image of the results of microfluidic studies of whole blood with
different doses of APLIX and the generated distribution of platelets and fibrin on the perfused surface.
The right panel shows bar diagrams representing the proportions of platelet aggregates in green and
fibrin masses in red interacting with the collagen/tissue factor surface, as evaluated following the
procedure mentioned in Section 2.4. To evaluate the effects of APIX samples with different APIX dosesMicromachines 2019, 10, 534 7 of 11
where tested, see Table 1. Bar graphs in the right of Figure 3 quantify the percentages of the total
surface exposed
Micromachines that
2019, 10, x are covered platelets and fibrin platelet, respectively. 7 of 11
Figure 3.3.Confocal
Figure Confocalimage labeled
image by immunofluorescence
labeled for morphometric
by immunofluorescence analysis from
for morphometric microfluidic
analysis from
studies. (a) Confocal
microfluidic studies. image showing
(a) Confocal platelets
image labeled
showing byanti-CD36
platelets labeledAlexa Fluor 488
byanti-CD36 and Fibrin
Alexa labeled
Fluor 488 and
by anti-fibrin(ogen) Alexa Fluor 594. The thrombogenic surface is a biomimetic
Fibrin labeled by anti-fibrin(ogen) Alexa Fluor 594. The thrombogenic surface is a biomimetic combination with
type-I fibrillarwith
collagen 2 ) and tissue factor2(0.95 ng/cm2 ). Scale bar = 20 µm.
combination type-I(30.9 mg/cm
fibrillar collagen (30.9 mg/cm ) and tissue factor (0.95 ng/cm2). Scale (b) The
bar plot
= 20
shows
µm. (b)the quantification
The plot shows of theplatelet aggregates
quantification (green) and
of platelet fibrin masses
aggregates (green)(red)
andinteracting with(red)
fibrin masses the
collagen/tissue
interacting withfactor surface. The bar
the collagen/tissue graphs
factor in theThe
surface. rightbar
panel summarize
graphs the results
in the right as percentages
panel summarize the
of the total surface exposed.
results as percentages of the total surface exposed.
Incubations
Incubations with
with different
different APIX
APIX doses
doses caused
caused dose-dependent
dose-dependent decreases
decreases in
in platelet
platelet and
and fibrin
fibrin
surface, reaching levels of statistical significance at 160 ng/mL (* p < 0.05 vs. control without
surface, reaching levels of statistical significance at 160 ng / mL (*p < 0.05 vs. control without APIXAPIX
and
pMicromachines 2019, 10, 534 8 of 11
Micromachines 2019, 10, x 8 of 11
Micromachines 2019, 10, x 8 of 11
Figure
Figure Real
4.4.4.
Figure Realand
Real
and Imaginary
and Imaginarypart
Imaginary partofof
part ofImpedance
Impedance
Impedancefor
forplasma
forplasmapoor
plasmapoorin
poor platelets
inin
platelets (PPP)
platelets(PPP) and
and
(PPP) plasma
plasma
and richrich
plasma in
in platelets
platelets (PRP)(PRP)
over over time.
time.
in platelets (PRP) over time.
During
During
During clotting
clotting
clotting thethe
coating
the coating
coating of the
of electrodes
of the
the electrodes is changed,
electrodes modifying
isis changed,
changed, the permittivity
modifying
modifying thethe layer between
permittivity
permittivity layer
layer
the between
electrodes. the electrodes.
In the case In
of the
PPP, case of
fibrin PPP, fibrin
formation isformation
uniform is
on uniform
between the electrodes. In the case of PPP, fibrin formation is uniform on the electrodes, and whenthe on
electrodes,the electrodes,
and when and
the when
coverage
the coverage
isthe
full, the influenceis full, thethe influence on the solution conductivity are changes areForreduced. Forcoverage
PRP, the of
coverage is full, on solution
the influence onconductivity
the solution changesconductivity reduced.
changes are PRP, the
reduced. For PRP, the
coverage of
electrodes electrodes is notthe uniform, since the thrombus is always located therefore
on certain thepoints,
coverage is ofnot uniform, is
electrodes since
not uniform,thrombus is always
since located on
the thrombus iscertain
alwayspoints,located on certain changes
points,
on therefore
conductivity the changes
are not on conductivity are not relevant; consequently, the variations near the electrode
therefore the changes onrelevant;
conductivity consequently, the variations
are not relevant; consequently, near the theelectrode
variationscause near a thenoticeable
electrode
cause a noticeable
change change on thethe imaginary
real part, while
part the imaginary part slightly changes.
cause aon the real part,
noticeable changewhileon the real part, while slightly
the imaginary changes. part slightly changes.
TheThe spectrum
spectrum shows a
shows aa generalgeneral capacitive
generalcapacitive behavior
capacitivebehaviorbehaviorat atat low frequencies
low frequencies(Cdl dominates). The
The spectrum shows
impedance is high at low frequencies and decreases gradually. Around 105 Hz,
low frequencies (Cdl(C dl dominates).
dominates).
the impedance
The
The impedance is high at low frequencies and decreases gradually. Around 10 5 Hz, the impedance
impedance
decreases to is the
highbehavior
at low of frequencies
becoming more and decreases
resistive (Rgradually. Around 10 Hz, the impedance
5
s dominates). Both samples PPP and PRP
decreases
decreases totothethe behavior
behavior of of
becoming
becoming moremoreresistive (Rs dominates).
resistive (R Both samples PPP and PRP show
s dominates). Both samples PPP and PRP
show the same trend, but the impedance of PRP is always higher due to the increased amount of
the
show samethetrend,
same but thebut
trend, impedance of PRP is of always higher due to the increased amount of cellular
cellular component whichthe impedance
increases PRP is
the resistivity of always
the solution,higher due
especiallyto thewhenincreased
CaCl2 isamount
added. of
component
cellular which increases the resistivity of the solution, especially when CaCl 2 is added. Figure 5
Figure component
5 shows a clear whicheffectincreases the resistivity
of the coagulation of the
on the solution,modulus
impedance especially when
during theCaCl 2 is added.
coagulation
shows
Figure a clear
5 shows effect of the coagulation on the impedance modulus during the coagulation process,
process, whicharesultsclear effect
in an of the coagulation
increase of impedance. on the This impedance
increase ismodulus
remarkable during the and
for low coagulation
high
which
process, results
which in an increase
results in of
an impedance.
increase of This increase
impedance. is
This remarkable
increase
frequencies in PRP samples, while in PPP samples the impedance increases at frequencies higher than for
is low and
remarkable high
for frequencies
low and in
high
PRP samples, while in PPP samples the impedance increases at frequencies higher than 10 5 Hz.
frequencies
10 Hz.
5 in PRP samples, while in PPP samples the impedance increases at frequencies higher than
105 Hz.
(c)
Figure
Figure 5. 5. Impedance
Impedance module
module at at different
different frequencies
frequencies after
after 9090 s interaction
s interaction of of
thethe electrode
electrode with
with (a)(a)
PPP
(c)Image of the platelets attached on the electrodes.
and PPP + CaCl2 . (b) PRP and PRP + CaCl2 . (c) Image of
PPP and PPP + CaCl2 . (b) PRP and PRP + CaCl 2 . (c) platelets attached on the electrodes.
Scale
Scale
Figure 5.=Impedance
barbar = 10µm.
10 µm. module at different frequencies after 90 s interaction of the electrode with (a)
PPP and PPP + CaCl2. (b) PRP and PRP + CaCl2. (c) Image of the platelets attached on the electrodes.
Scale bar = 10 µm.Micromachines 2019, 10, 534 9 of 11
4. Discussion
Previous studies proved the importance of studying on hemostasis underflow conditions for
a better understanding of the process, and nowadays microfluidics technology provides a perfect
platform to study this phenomenon. Most of these studies have focused on a global understanding of
whole blood behavior during the coagulation process.
New oral anticoagulants (NOACs) used in patients with more complex treatment cases require
close monitoring and assessment of the cross-reaction with classic Vitamin K antagonists (VKAs).
Hemostasis is a complex process which at least has a double side contribution from platelets and
fibrin(ogen). Conventional evaluation methods use an important amount of reagent and sample,
and they are time-consuming. However, the introduction of microfabrication techniques has allowed
the replica of vein models and biomimetic surfaces to study the complexity of the coagulation process
in biomimetic environments [11,22,23] with a reduced amount of reagents.
These biomimetic approaches still require the use of further biomolecular techniques to quantify
the presence and quantity of thrombi or clots. Therefore, the techniques are not compatible with
near-patient monitoring strategies. Impedance spectroscopy has successfully been applied to monitor
the growth of bacteria colonies in biofilm formation [24–26]. The behavior can be extrapolated to the
PPP effect that creates a complete coverage on the electrodes similar to biofilm growth, and it affects
equally to the real and imaginary part of the impedance detected, as shown in Figure 4.
PRP contains a high concentration of platelets creating aggregates during coagulation, and during
this process the electrolytes in solution change and affect the impedance. Previous studies focusing on
electrolytes on the solution [27,28] show a different behavior on the real and imaginary part of the
impedance, and besides this, a change depending on the concentration of this electrolytes. PRP samples
have shown an important influence of the electrolytes in solution and the attachment of the thrombi at
the same time, showing a completely differentiated behavior to PPP samples.
The differentiated behavior of PPP and PRP would allow the monitoring of responses to antiplatelet
agents present in the samples, while still being able to assess the impact of anticoagulant therapies
on the different elements of hemostasis. As for sample volumes, the proposed devices work with a
reduced 100 µL sample, and the microfluidics and electronics can be miniaturized in a point of care
(POC) system. Besides, the turnaround results are shortened, facilitating a rapid evaluation of the
anticoagulant activity, the identification of specific patient groups, and the guidance of reversal agents
in case of overdose.
The combination of both analyses (PPP and PRP) in a miniaturized POC device with impedance
measurements can evaluate the contribution of platelets and the coagulation mechanism in minute
blood samples at patients´ bedsides.
5. Conclusions
The present study has combined microfluidics with impedance spectroscopy to diagnose
and control coagulation disorders in a biomimetic approach. The proposed device uses a new
micro-manufactured microflow chamber with interchangeable biomimetic surfaces to measure
coagulation. Evaluation of the impact on coagulation in minute samples (100 µL) spiked with a
new oral anticoagulant APIXABAN (APIX) has been performed using this technique and compared to
previous conventional techniques. Both tests show an excellent agreement.
The biomimetic surfaces can be imprinted with gold electrodes, adding the capability to quantify
the presence of platelets aggregates or fibrinogen formation from a reduced amount of sample and
reagents, and also a minimized time for testing.
Different impedance behaviors of plasma poor in platelets (PPP) and plasma rich in platelets
(PRP) has been observed. PPP changes during coagulation are more noticeable at higher frequencies
and modify both real and imaginary parts of the impedance. PRP changes are remarkable even at low
frequencies, but only at the real part of the impedance. This study is the base for a point-of-care deviceMicromachines 2019, 10, 534 10 of 11
capable of quantifying in a short time and near the patient the effect of anticoagulant on fibrinogen
formation or platelet aggregation.
Supplementary Materials: The following are available online at http://www.mdpi.com/2072-666X/10/8/534/s1,
Figures S1 and S2: Real and Imaginary part of Impedance for different samples of PPP and PRP over the time.
Author Contributions: The conceptualization of the devices was done by G.E., J.C.-T. and J.F.-L. Methodology,
testing and validation were done by S.K. and E.M. Writing and reviewing the article was done by J.C.-T. and G.E.
Funding: This was partially supported by the Health Institute Carlos III (ISCIII): Health Technological Development
project grant number DTS16/00133 from the Spanish Government together with the European regional development
Funds (FEDER) and the Spanish Ministry of Economy and Competitivity, grant nos. CTQ2016-77936-R (funding
also from FEDER) and CTQ2017-84966-C2-1-R.
Conflicts of Interest: The authors declare no conflict of interest.
References
1. Neeves, K.B.; Onasoga, A.A.; Wufsus, A.R. The use of microfluidics in hemostasis: Clinical diagnostics and
biomimetic models of vascular injury. Curr. Opin. Hematol. 2013, 20, 417–423. [CrossRef] [PubMed]
2. Shen, F.; Kastrup, C.J.; Liu, Y.; Ismagilov, R.F. Threshold Response of Initiation of Blood Coagulation by
Tissue Factor in Patterned Microfluidic Capillaries Is Controlled by Shear Rate. Arterioscler. Thromb. Vasc. Biol.
2008, 28, 2035–2041. [CrossRef] [PubMed]
3. Li, M.; Ku, D.N.; Forest, C.R. Microfluidic system for simultaneous optical measurement of platelet
aggregation at multiple shear rates in whole blood. Lab Chip 2012, 12, 1355. [CrossRef] [PubMed]
4. Michelson, A.D. Methods for the measurement of platelet function. Am. J. Cardiol. 2009, 103, 20A–26A.
[CrossRef] [PubMed]
5. Sakariassen, K.S.; Houdijk, W.P.; Sixma, J.J.; Aarts, P.A.; de Groot, P.G. A perfusion chamber developed to
investigate platelet interaction in flowing blood with human vessel wall cells, their extracellular matrix,
and purified components. J. Lab Clin. Med. 1983, 102, 522–535. [PubMed]
6. Escolar, G.; Mazzara, R.; Castillo, R.; Ordinas, A. The role of the Baumgartner technique in transfusion
medicine: Research and clinical applications. Transfusion 1994, 34, 542–549. [CrossRef]
7. Nagy, M.; Heemskerk, J.W.; Swieringa, F. Use of microfluidics to assess the platelet-based control of
coagulation. Platelets 2017, 28, 441–448. [CrossRef] [PubMed]
8. Onasoga-Jarvis, A.A.; Leiderman, K.; Fogelson, A.L.; Wang, M.; Manco-Johnson, M.J.; Di Paola, J.A.;
Neeves, K.B. The Effect of Factor VIII Deficiencies and Replacement and Bypass Therapies on Thrombus
Formation under Venous Flow Conditions in Microfluidic and Computational Models. PLoS ONE 2013,
8, e78732. [CrossRef]
9. Fedosov, D.A.; Dao, M.; Karniadakis, G.E.; Suresh, S. Computational Biorheology of Human Blood Flow in
Health and Disease. Ann. Biomed. Eng. 2014, 42, 368–387. [CrossRef]
10. Jain, A.; van der Meer, A.D.; Papa, A.L.; Barrile, R.; Lai, A.; Schlechter, B.L.; Otieno, M.A.; Louden, C.S.;
Hamilton, G.A.; Frelinger, A.L.; et al. Assessment of whole blood thrombosis in a microfluidic device lined
by fixed human endothelium. Biomed. Microdevices 2016, 18, 73. [CrossRef]
11. Zhang, Y.S.; Davoudi, F.; Walch, P.; Manbachi, A.; Luo, X.; Dell’Erba, V.; Miri, A.K.; Albadawi, H.; Arneri, A.;
Wang, X.; et al. Bioprinted thrombosis-on-a-chip. Lab Chip 2016, 16, 4097–4105. [CrossRef] [PubMed]
12. Jain, A.; Graveline, A.; Waterhouse, A.; Vernet, A.; Flaumenhaft, R.; Ingber, D.E. A shear gradient-activated
microfluidic device for automated monitoring of whole blood haemostasis and platelet function. Nat. Commun.
2016, 7, 10176. [CrossRef] [PubMed]
13. Patel, M.R.; Hellkamp, A.S.; Fox, K.A. Point-of-Care Warfarin Monitoring in the ROCKET AF Trial. N. Engl.
J. Med. 2016, 374, 785–788. [CrossRef] [PubMed]
14. Hori, M.; Ohashi, Y.; Pan, G.; Kato, M.; Kajikawa, M. Point-of-Care Device for Warfarin Monitoring Used in
the J-ROCKET AF Study. Circ. J. 2016, 80, 1488–1490. [PubMed]
15. Cattaneo, M. Resistance to antiplatelet drugs: Molecular mechanisms and laboratory detection.
J. Thromb. Haemost. 2007, 5, 230–237. [CrossRef] [PubMed]
16. Lenk, E.; Spannagl, M. Platelet Function Testing—Guided Antiplatelet Therapy. EJIFCC 2014, 24, 90.Micromachines 2019, 10, 534 11 of 11
17. Lopez-Vilchez, I.; Tonda, R.; Hernandez, R.M.; Navalon, F.; Diaz-Ricart, M.; Galan, A.M.; Escolar, G. Relative
contributions of collagen and tissue factor to thrombus formation on damaged vascular vessels: In-vitro
studies with circulating blood. Coron. Artery Dis. 2009, 20, 392–399. [CrossRef] [PubMed]
18. Papaioannou, T.G.; Stefanadis, C. Vascular Wall shear stress: Basic principles and Methods. Hell. J. Cardiol
2005, 46, 9–15.
19. Bruus, H. Theoretical Microfluidics; Oxford university press: College Park, MD, USA, 2008; Volume 18, p. 363.
20. Yeom, E.; Kang, Y.J.; Lee, S.J. Changes in velocity profile according to blood viscosity in a microchannel.
Biomicrofluidics 2014, 8, 034110. [CrossRef]
21. Dak, P.; Ebrahimi, A.; Alam, M.A. Non-Faradaic Impedance Characterization of an Evaporating Droplet for
Microfluidic and Biosensing Applications. Lab Chip 2015, 14, 2469–2479. [CrossRef]
22. Ting, L.; Feghhi, S.; Karchin, A.; Tooley, W.; White, N.J. Clot-On-A-Chip: A Microfluidic Device to Study
Platelet Aggregation and Contractility Under Shear. Blood 2013, 122, 2363.
23. Lam, W.A. Thrombosis-on-a-Chip: A New Way to Model a Complex Process. Blood 2017, 130, SCI-10.
24. Mallén-Alberdi, M.; Vigués, N.; Mas, J.; Fernández-Sánchez, C.; Baldi, A. Impedance spectral fingerprint of E.
coli cells on interdigitated electrodes: A new approach for label free and selective detection. Sens. Bio-Sens. Res.
2016, 7, 100–106. [CrossRef]
25. Van Duuren, J.B.; Müsken, M.; Karge, B.; Tomasch, J.; Wittmann, C.; Häussler, S.; Brönstrup, M. Use of
Single-Frequency Impedance Spectroscopy to Characterize the Growth Dynamics of Biofilm Formation in
Pseudomonas aeruginosa. Sci. Rep. 2017, 7, 5223. [CrossRef] [PubMed]
26. Clausen, C.; Dimaki, M.; Bertelsen, C.; Skands, G.; Rodriguez-Trujillo, R.; Thomsen, J.; Svendsen, W. Bacteria
Detection and Differentiation Using Impedance Flow Cytometry. Sensors (Basel) 2018, 18, 3496. [CrossRef]
[PubMed]
27. Eldarrat, A.; High, A.; Kale, G. Influence of sodium chloride content in electrolyte solution on electrochemical
impedance measurements of human dentin. Dent. Res. J. (Isfahan) 2017, 14, 25–31. [CrossRef]
28. Boumya, W.; Laghrib, F.; Lahrich, S.; Farahi, A.; Achak, M.; Bakasse, M.; El Mhammedi, M.A. Electrochemical
impedance spectroscopy measurements for determination of derivatized aldehydes in several matrices.
Heliyon 2017, 3, e00392. [CrossRef] [PubMed]
© 2019 by the authors. Licensee MDPI, Basel, Switzerland. This article is an open access
article distributed under the terms and conditions of the Creative Commons Attribution
(CC BY) license (http://creativecommons.org/licenses/by/4.0/).You can also read