Evaluation of the Spray Drying Conditions of Blueberry Juice-Maltodextrin on the Yield, Content, and Retention of Quercetin 3-D-Galactoside - MDPI
←
→
Page content transcription
If your browser does not render page correctly, please read the page content below
polymers
Article
Evaluation of the Spray Drying Conditions of
Blueberry Juice-Maltodextrin on the Yield, Content,
and Retention of Quercetin 3-D-Galactoside
María Z. Saavedra-Leos 1 , César Leyva-Porras 2, * , Laura A. López-Martínez 3 ,
Raúl González-García 4 , Joel O. Martínez 4 , Isaac Compeán Martínez 1
and Alberto Toxqui-Terán 5
 1   Coordinación Académica Región Altiplano, Universidad Autónoma de San Luis Potosí,
     Carretera Cedral Km, 5+600 Ejido San José de las Trojes Matehuala, S.L.P. C.P. 78700, México;
     zenaida.saavedra@uaslp.mx (M.Z.S.-L.); isaac.compean@uaslp.mx (I.C.M.)
 2   Centro de Investigación de Materiales Avanzados S.C. (CIMAV), Miguel de Cervantes No. 120,
     Complejo Industrial Chihuahua, Chihuahua, Chih. C.P. 31136, México
 3   Coordinación Académica Región Altiplano Oeste, Universidad Autónoma de San Luis Carretera
     Salinas—Santo Domingo 200, Salinas de Hidalgo C.P. 78600, S.L.P. C.P. 78700, México;
     araceli.lopez@uaslp.mx
 4   Facultad de Ciencias Químicas, Universidad Autónoma de San Luis Potosí, Av. Dr. Manuel Nava 6,
     San Luis Potosí, S.L.P. C.P. 78210, México; raulgg@uaslp.mx (R.G.-G.); atlanta126@gmail.com (J.O.M.)
 5   Centro de Investigación de Materiales Avanzados (CIMAV-Mty), Alianza Norte No 202,
     Parque de Investigación e Innovación Tecnológica, Apodaca Nuevo León C.P. 66600, México;
     alberto.toxqui@cimav.edu.mx
 *   Correspondence: cesar.leyva@cimav.edu.mx; Tel.: +52-(614)-4391-106

 Received: 11 January 2019; Accepted: 8 February 2019; Published: 13 February 2019

 Abstract: The influence of the processing conditions during the spray drying of mixtures of blueberry
 juice (BJ) and maltodextrin (MX) was determined quantitatively by the analysis of variance (ANOVA),
 and qualitatively by the surface response plots (SRP). The effect of two independent variables (inlet
 temperature, and MX concentration), and one categorical variable (type of MX), was determined on
 the yield (Y), content (Q), and retention (R) of the antioxidant quercetin 3-D-galactoside. From the
 ANOVA results, the concentration was the main variable affecting Y and Q, while temperature had a
 negligible effect, and the low molecular weight MXs exhibited a better response. The physicochemical
 characterization showed that the powder appearance and microstructure remained unaffected,
 but size and morphology of the particles varied with the processing conditions. This study established
 the optimal processing conditions for the spray drying of BJ-MX, and the application limits of the
 MXs based on the molecular weight distribution.

 Keywords: Quercetin 3-D-galactoside; Analysis of variance (ANOVA); Spray Drying; Blueberry
 juice-maltodextrins; carrying agents

1. Introduction
     The regular consumption of food with a high content of antioxidants is considered as an alternative
to prevent chronic degenerative illnesses such as cancer, diabetes mellitus, cardio and cerebrovascular
diseases, among others. The function of antioxidants is the neutralization of harmful body molecules
in the form of free-unstable radicals [1–3]. The antioxidant activity is based on the presence of
phenolic and flavonoid compounds such as quercetin 3-D-galactoside, resveratrol, myricetin, and
kaempferol [4,5]. Some of the most important sources of antioxidants are berries, especially the

Polymers 2019, 11, 312; doi:10.3390/polym11020312                              www.mdpi.com/journal/polymers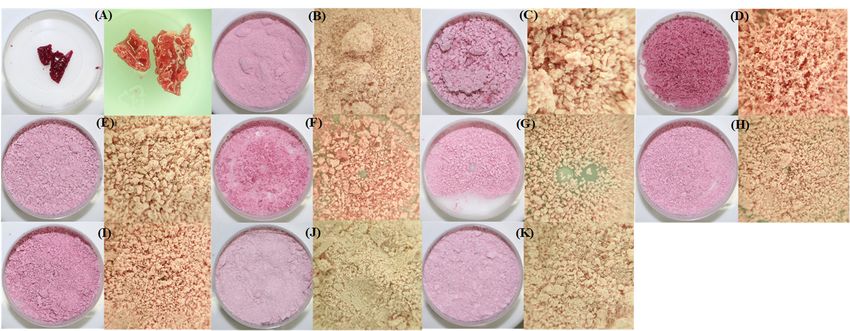
Polymers 2019, 11, 312                                                                              2 of 14

raspberry, mulberry, strawberry, Chilean wineberry (maqui), and blueberry. Although the popularity
in the consumption of blueberries has been extended to other regions of the world such as northern
Europe, Asia, and Latin America, in 2014, the USA and Canada were the main producers and
consumers of blueberries, with 90% of the total global production, equivalent to 444,814 tons [6,7].
The relatively short harvest season of blueberries, and the perishability of the fruit (with a water
content of 85%), limit the availability in the market. Thus, more than 50% of the total production
must be processed in the form of non-perishable products that may support a long shelf life such
as juices, nectars, yogurts, marmalades, syrups, and juice powders [6,8]. Unfortunately, most of the
processes include treatments at temperatures higher than 60 ◦ C, which induce thermal degradation of
the antioxidants [9,10]. Cano-Chauca et al. (2005) concluded that different blueberry juice processing
methods might induce losses of 20%–50% of the antioxidant content [11]. For this reason, it is necessary
to improve the methods for obtaining powders of blueberry juice, that preserve the nutritive and
organoleptic characteristics, while reducing the loss of antioxidants. In this sense, the spray drying
process is a viable alternative because it is economic and of easy operation [12,13].
      The spray drying process is characterized by the use of relatively low temperatures and short
residence times, which are suitable features for the drying of temperature-sensible products, allowing
the preserving of some food properties such as flavor, color, odor, and nutrients [14]. The appearance
of the obtained dried product is a fine powder with particles of regular shape and size, which is easy
to handle, store and transport [11]. However, one of the difficulties that may arise during the spray
drying of fruit juices is the caking of the product on the walls of the dryer, and the agglomeration
of the powder, both causing low yields, operation problems, and erroneous prediction of the quality
of the product [15]. The property that is related to this issue, is the glass transition temperature (Tg )
resulting from the high content of low molecular weight sugars such as fructose, glucose, and sucrose.
An alternative for avoiding this problem is increasing the overall Tg of the food product with the aid
of high molecular weight additives as carrying agents [16].
      Maltodextrins (MX) are polysaccharides derived from acid or enzymatic hydrolysis of the
starch. Based on their physicochemical properties, such as dextrose equivalent (DE), molecular
weight distribution (MWD), and Tg , these compounds have been successfully used as carrying
agents in the spray drying of fruit juices [17,18]. Saavedra-Leos et al. (2015) demonstrated that,
depending on the degree of polymerization (DP) and MWD, the maltodextrins could be employed in
different technological applications [16]. For example, low DP maltodextrins may be used in processes
where keeping the microstructural stability at temperatures about 90 ◦ C is needed, while high DP
maltodextrins may be employed as an additive in low temperature processes such as volume enhancers,
and viscosity promoters. Additionally, other researchers have employed maltodextrin as a carrier
agent in proportions of 10%–75% in the spray drying of different fruit juices [19–21]. Araujo-Díaz et
al. (2017) studied the conservation of two antioxidants during the spray drying of blueberry juice,
and compared the aid of two carrying agents (inulin and maltodextrin) [22]. They concluded that
a maltodextrin with a DE of 10 showed a better performance than inulin, in the conservation of
antioxidants, such as quercetin 3-D-galactoside. The spray drying conditions exerted were an inlet
temperature of 180 ◦ C, maltodextrin content of 30%, and feed flowrate of 7 mL/min. Recently, da Costa
et al. (2018) reported the optimization of the spray drying conditions in the conservation of cupuassu
(Theobroma grandiflorum Schum.) [23]. They found that the content of polyphenols, and flavonoids was
maximized with an inlet temperature of 170 ◦ C, maltodextrin concentration of 50%, and feed flowrate
of 5 mL/min. However, no additional information related to the chemical structure of the maltodextrin
was provided, i.e., DE, DP or MWD.
      Thus, it is of vital importance to set the optimal drying conditions of the blueberry juice that may
preserve the content of antioxidants. Therefore, a D-optimal experimental design, analysis of variance
(ANOVA), and surface response methodology were employed in this work, in the optimization of the
spray drying conditions of blueberry juice assisted with maltodextrin as a carrying agent. The effect of
inlet temperature, maltodextrin concentration, and type of maltodextrin were evaluated in the powder
Polymers 2019, 11, 312                                                                             3 of 14

yield, content and retention of quercetin 3-D-galactoside. The optical appearance, microstructure and
particle size of the powder samples were characterized, and the results correlated with the processing
variables. Additionally, this work demonstrates the application limits of maltodextrins when used as
carrying agents in a technological process such as the spray drying of sugar-rich systems.

2. Materials and Methods

2.1. Materials
      The juice was prepared using fresh blueberry fruit (Vaccinium corymbosum), commercially available
in a market center (Costco Wholesale Corp., San Luis Potosí, México). The fruits were stored in a
refrigerator for 12 h, and crushed in the juice extractor, Turmix E-17 (Guadalajara, Mexico). The juice
and bagasse were stored in a glass container inside the fridge. The separation of the bagasse and
the juice was done by vacuum filtration with a paper filter Whatman NO. 4, which is used in the
clarification of juices and wines. Blueberry juice (BJ) was stored in the refrigerator at 4 ◦ C, and in
darkness to avoid degradation of the antioxidants.
      Four types of maltodextrins (MX) were used as carrying agents, and were identified according
to the dextrose equivalent (DE) as commercial grade maltodextrin (Mc), DE 10 (M10), DE 20 (M20),
and DE 40 (M40). The Mc dry powder was purchased from INAMALT (Guadalajara, Mexico), while
the M10, M20 and M40 were from INGREDION México (Guadalajara, Mexico).

2.2. Experimental Design
     With the D-optimal experimental design, it is possible to determine both the individual effects
of the evaluated variables and their interactions. Without the need for many experimental runs,
and keeping the confidence interval [24], this methodology ensures the optimal selection of the
spray drying conditions for obtaining a high yield of powder, while maximizing the content of
antioxidants. Two independent continuous variables and one categorical independent variable
were tested: inlet temperature (T), maltodextrin concentration (C), and dextrose equivalent (DE),
respectively. The minimum and maximum levels of these variables were: inlet temperature of
170–210 ◦ C, maltodextrin concentration of 10–30 wt %, and dextrose equivalent of Mc-M40. The response
variables were the powder yield (Y), and the content of quercetin 3-D-galactoside retained (R). The
D-optimal experimental design consisted of 25 experiments, necessary to achieve a quadratic model in
the quantitative factors. From these 25 experiments, 5 runs were repeated, i.e. runs 8, 10, 11, 12 and 14
were repeated with runs 21, 22, 23, 24, and 25, respectively. All the experiments were executed randomly.

2.3. Spray Drying
     The dehydration of blueberry juice was carried out in a Mini Spray Dryer B290 (Buchi,
Switzerland). Mixtures of blueberry juice with maltodextrin (BJ-MX) were introduced into the spray
dryer at room temperature. As a drying vehicle, hot air was injected at a volumetric flow rate of
35 m3 /h, and constant pressure of 1.5 bar. The rest of the processing conditions were varied as
inlet temperature 170–210 ◦ C, concentration of MX 10–30 wt %, and type of maltodextrin Mc-M40.
The percentage of the yield (Y) was calculated according to equation 1, with the masses of the collected
dry powder (WP ), and liquid (WL ) fed into the dryer:
                                                    WP
                                          Y (%) =      × 100                                          (1)
                                                    WL

2.4. Quercetin 3-D-Galactoside Content, and Retention
     The antioxidant content of quercetin 3-D-galactoside was quantified by high performance liquid
chromatography (HPLC) with a Waters system (Waters Corp. Milford, MA, USA), equipped with a
binary pump, an auto-injector (model 717), and a dual wavelength absorbance detector (model 2487).
The analyses were carried out at room temperature, and a pH of 3.0. A constant flow rate of 1 mL/min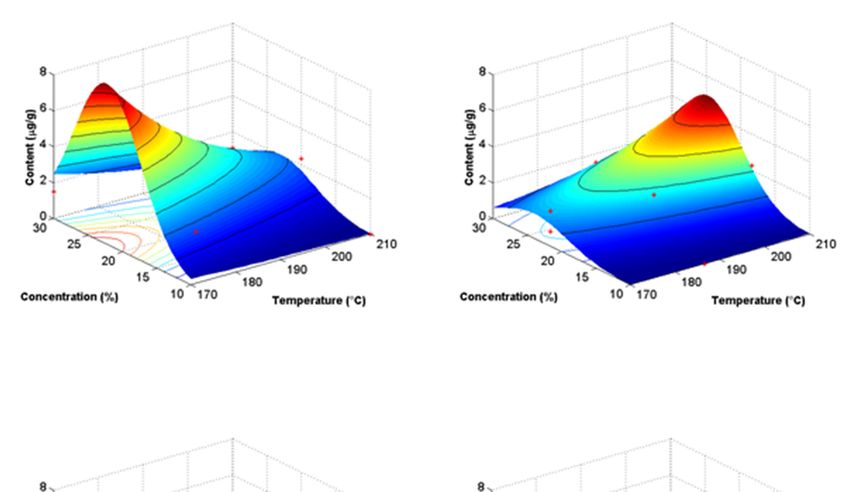
Polymers 2019, 11, 312                                                                                4 of 14

solution of 50% acetonitrile–phosphoric acid was employed as the mobile phase. Detection was set at
306 nm. The chromatographic separation was done with an Agilent C-18 column (75 × 4.6 mm DI
3.5 µm). All data were analyzed with the Empower Pro software (Version 4.0, Waters Corp., Milford,
MA, USA). For more details about the antioxidant quantification by HPLC, please refer to Figures
S2–S4, and Table S1 in the Supplementary Materials.
     Quercetin 3-D-galactoside was evaluated in the original juice, and in the dry powders. The content
of the antioxidant was expressed as the micrograms of quercetin 3-D-galactoside per gram of blueberry
juice powder (µg/g). The percent of retention (R) of quercetin 3-D-galactoside was determined
according to Equation (2):
                                                Q × 1.7 × 100
                                       R (%) = P                                                    (2)
                                                      Qj
where QP is the content of quercetin 3-D-galactoside in the dry powder (in ppm), and Qj is the content
of quercetin 3-D-galactoside in the fresh juice (31.45 ppm). The value of 1.7 is a factor related to the
humidity content, calculated as the ratio of the humidity of the injected juice sample (100%), and the
humidity of the dried sample after the extraction process with methanol (58.46%).

2.5. Statistical Analysis
     The effects of the three factors and their interactions were evaluated with the analysis of variance
(ANOVA). A quadratic model with second-order interactions and the main effects were used to explain
the relationship between the given continuous variables as indicated in Equation (3):

                                Z = α0 + ∑ αi Xi + ∑ αii Xii2 + ∑ αij Xi X j                             (3)

where, Z represents the response variables (yield, or content of quercetin 3-D-galactoside), Xi , Xj are the
factors (temperature and concentration of the maltodextrin), and αi , αii and αij are the linear regression
coefficients of the model.
     In the process of selecting the model, the parameters of the complete model were first adjusted
with Equation (2). Based on the normality test of Anderson Darling for the response variables (Y, and
R), the transformation of the response was made by the Box–Cox analysis when it was necessary
to stabilize the variance. Then, for simplification, the model was hierarchically pruned, and used
only with the significant factors. Here we present the results obtained with the pruned model,
and transformed into the response variables.

2.6. Physicochemical Characterization
     The collected powders were optically characterized with a digital camera EOS Digital Rebel
XSi, (Canon, Tokyo, Japan) with a 1:2.8 aspect EX/Sigma lens, and a high magnification digital
camera THOUGH TG-5 operated in the microscope mode, (Olympus, Hamburg, Germany). The X-ray
diffraction (XRD) analyses were carried out in an X’Pert Empyrean diffractometer (PANalytical,
The Netherlands) with Cu-K radiation (λ = 1.5406 Å) operated at 40 kV, 30 mA and equipped with a
X’Celerator detector in a Bragg–Brentano geometry. Scans were performed in the 2θ range of 4◦ –40◦ ,
with step size of 0.017◦ and 30 s per step. The morphology of the particles was observed in a scanning
electron microscope (SEM) JSM-6010/LA (JEOL, Tokyo, Japan), operated at 15 kV, and in low-vacuum
mode at 30 Pa. Powder sample was manually dispersed on a double-side carbon tape, and images
were acquired at 100×–500×.

3. Results

3.1. Physicochemical Characterization of the Dry Powders
    Figure 1 shows couples of optical micrographs of the BJ-MX samples after the spray drying
process. As observed, the structure of some samples (Figure 1A) collapsed during the drying, while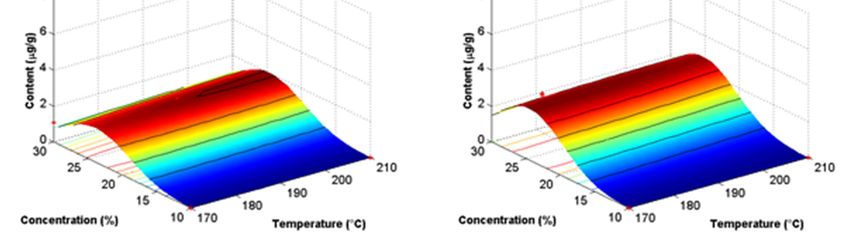
Polymers 2019, 11, 312                                                                                                      5 of 14

other samples remained as non-agglomerated powders (Figure 1B–K). A non-collapsed structure
was observed as well-dispersed materials in bulk, i.e., non-agglomerated particles, and with a light
purple appearance. The effect of the processing variables was observed as slight variations in the
color of the powders (left image in Figure 1), and in the size of the agglomerated particles (right image
Polymers 2019, 11, x FOR PEER REVIEW                                                                 5 of 15
in Figure 1). Although some of the BJ-MX mixtures were successfully dried, there were differences
observed macroscopically and caused by the variations in the processing. On the contrary, the collapsed
observed macroscopically and caused by the variations in the processing. On the contrary, the
structure showed a notorious dark purple color, a bright surface, and an overall volume contraction.
collapsed structure showed a notorious dark purple color, a bright surface, and an overall volume
These observations indicated the collapse of the microstructure, suggesting the crystallization of the
contraction. These observations indicated the collapse of the microstructure, suggesting the
low-molecular weight sugar content in the BJ. Three undesired characteristics may be presented during
crystallization of the low-molecular weight sugar content in the BJ. Three undesired characteristics
the processing, handling, and storing of food products: stickiness, agglomeration, and caking [13].
may be presented during the processing, handling, and storing of food products: stickiness,
Any of these characteristics indicate that during the drying of the sample, a rapid release of water
agglomeration, and caking [13]. Any of these characteristics indicate that during the drying of the
causes the matrix of the food product to be unable to support its own weight, thus collapsing on itself.
sample, a rapid release of water causes the matrix of the food product to be unable to support its own
Additionally, the high content of low molecular sugars in the juice depress the overall Tg value, causing
weight, thus collapsing on itself. Additionally, the high content of low molecular sugars in the juice
the collapse of the structure at lower temperatures. To avoid these problems, carrying agents such as
depress the overall Tg value, causing the collapse of the structure at lower temperatures. To avoid
MX are employed [15]. However, there are limits where the MX may act properly in the conservation
these problems, carrying agents such as MX are employed [15]. However, there are limits where the
of the microstructure of the BJ.
MX may act properly in the conservation of the microstructure of the BJ.

      Figure     Optical micrographs
              1. Optical
      Figure 1.           micrographs ofof Blueberry
                                           Blueberry juice-Maltodextrin
                                                      juice-Maltodextrin (BJ-MX)
                                                                              (BJ-MX) samples
                                                                                         samples after
                                                                                                   after the spray drying
                                                                                                         the spray   drying
      process.
      process. Couples of images were arranged as low magnification in the left and high magnification in
                Couples   of images  were  arranged   as  low  magnification    in  the  left and  high  magnification     in
      the
      the right.  The cylindrical
          right. The  cylindrical container
                                  container has
                                             has aa diameter
                                                    diameter ofof 44 cm,
                                                                     cm, while
                                                                          while the
                                                                                 the length
                                                                                      length ofof the
                                                                                                  the high
                                                                                                      high magnification
                                                                                                            magnification
      image  is 1
      image is   1 cm. Run identification
                   cm. Run   identification (A)
                                            (A) 9,
                                                9, (B)
                                                   (B) 3,
                                                       3, (C)
                                                           (C) 5,
                                                               5, (D)
                                                                  (D) 6,
                                                                       6, (E),
                                                                          (E), 12,
                                                                               12, (F)
                                                                                   (F) 15,
                                                                                        15, (G)
                                                                                            (G) 16,
                                                                                                 16, (H)
                                                                                                     (H) 21,
                                                                                                          21, (I)
                                                                                                              (I) 22,
                                                                                                                  22, (J)
                                                                                                                      (J) 24,
                                                                                                                          24,
      and  (K) 25.
      and (K) 25.

     Figure 2 shows the XRD patterns of BJ-MX samples after the spray drying process. Overall,
     Figure 2 shows the XRD patterns of BJ-MX samples after the spray drying process. Overall, the
the diffractograms showed a broad peak at low diffraction angles (about 2θ=17◦ ), and the absence
diffractograms showed a broad peak at low diffraction angles (about 2θ=17°), and the absence of
of well-defined peaks, indicating the preservation of an amorphous microstructure [16]. Even the
well-defined peaks, indicating the preservation of an amorphous microstructure [16]. Even the
collapsed sample (run 9) showed a similar diffractogram. Unlike other carrying agents based on
collapsed sample (run 9) showed a similar diffractogram. Unlike other carrying agents based on
fructose units such as inulin, MXs are composed of glucose chains, which tend to remain in the
fructose units such as inulin, MXs are composed of glucose chains, which tend to remain in the
amorphous state after the drying process. The advantage of this state is that it presents a high
amorphous state after the drying process. The advantage of this state is that it presents a high
viscosity, which constrains the molecular mobility, while preventing chemical and biochemical
viscosity, which constrains the molecular mobility, while preventing chemical and biochemical
reactions [22]. Additionally, Saavedra-Leos et al. (2018) reported that the MXs did not crystallize
reactions [22]. Additionally, Saavedra-Leos et al. (2018) reported that the MXs did not crystallize with
with the adsorption of water, but presented only a phase change from amorphous dried powders into
the adsorption of water, but presented only a phase change from amorphous dried powders into
liquid saturation, and further liquid condensation [25]. Thus, this indicated that under certain spray
liquid saturation, and further liquid condensation [25]. Thus, this indicated that under certain spray
drying processing conditions, the microstructure of the BJ-MX collapsed not by the crystallization
drying processing conditions, the microstructure of the BJ-MX collapsed not by the crystallization
process, but by the phase change experimented during the rapid release of water molecules. Additional
process, but by the phase change experimented during the rapid release of water molecules.
information regarding the thermal behavior of some selected samples can be found in Figure S1 of the
Additional information regarding the thermal behavior of some selected samples can be found in
Supplementary Materials.
Figure S1 of the Supplementary Materials.
Polymers 2019, 11, 312
x FOR PEER REVIEW 6 of 15
14
600
Intensity (a.u.)
480
360
240
120
3
5
6
r
be
9
um
12
tn
15
en
rim
16
pe
21
Ex
22
24
25
5 10 15 20 25 30 35 40
2θ (degrees)
Figure 2. XRD patterns of BJ-MX samples after the spray drying process.
Figure 2. XRD patterns of BJ-MX samples after the spray drying process.
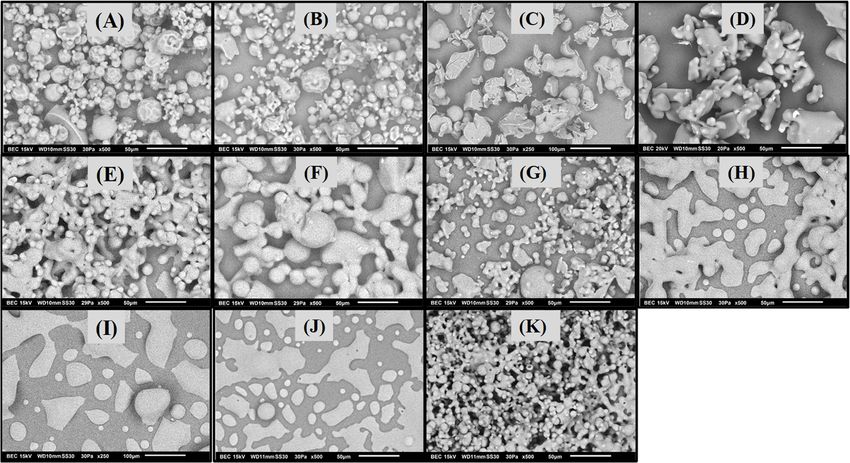
Figure 3 shows the micrographs acquired by SEM of the powders that remained without
microstructure collapse.
Figure 3 shows theIn micrographs
general, the morphology
acquired by and SEMsize of
of the
the particles
powdersvariedthat with the processing
remained without
microstructure collapse. In general, the morphology and size of the particles varied separated
conditions. For some runs (Figure 3A,B), particles were observed as individual particles well with the
from each other,
processing i.e., without
conditions. For some coalescing, with3A,B),
runs (Figures a spherical morphology,
particles were observeda rough surface, and
as individual with
particles
different sizes. Other powders (Figure 3C,E–G,K) presented a combination
well separated from each other, i.e., without coalescing, with a spherical morphology, a rough of individual spheres
and coalesced
surface, and withparticles. Likewise,
different sizes. among these samples,
Other powders (Figures the3C,E–G,K)
particle size varied with
presented the processing
a combination of
conditions,spheres
individual in the following run order
and coalesced 6>15>12>16>25.
particles. Likewise, amongPowders corresponding
these samples, thetoparticle
runs 21,size
22 and 24
varied
(Figure
with the3h–J) showedconditions,
processing a larger content
in theof coalescedrun
following material and pseudo-spherical
order 6>15>12>16>25. Powders particles; the particle
corresponding to
size was
runs similar
21, 22 and 24among(Figurethese
3h–J)runs.
showedTheacollapsed sample
larger content (run 9, Figure
of coalesced 3d),and
material showed micrometric
pseudo-spherical
agglomerated
particles; particlessize
the particle withwas irregular
similarmorphology.
among these The spherical
runs. morphology
The collapsed is typically
sample (run 9, observed
Figure 3d),in
the powders
showed of maltodextrins
micrometric obtained
agglomerated by spray
particles drying
with [26,27].
irregular Additionally,
morphology. thisspherical
The morphology suggests
morphology
the
is conservation
typically observedof the microstructure,
in the and thus the obtained
powders of maltodextrins amorphous state [22].
by spray However,
drying [26,27]. the coalesced
Additionally,
particles
this with irregular
morphology suggestsmorphologies,
the conservation which aremicrostructure,
of the commonly observed and thusinthecollapsed
amorphous systems, also
state [22].
remained inthe
However, thecoalesced
amorphous state, which
particles with was corroborated
irregular by the XRD
morphologies, whichresults
are and optical micrographs.
commonly observed in
Accordingsystems,
collapsed to Ahmed alsoetremained
al. (2018), processing conditions
in the amorphous state, whichsuch was as inlet temperature
corroborated by the XRDand results
MWD
have a negligible effect on the physicochemical properties of spray-dried
and optical micrographs. According to Ahmed et al. (2018), the processing conditions such as inletinulin, but they affect the
microstructure
temperature andandMWD morphology of particles
have a negligible [28].onEvidently,
effect the variations
the physicochemical in the particle
properties size and
of spray-dried
morphology
inulin, were
but they caused
affect by the differences
the microstructure andinmorphology
the MWD ofofthe MXs, and
particles byEvidently,
[28]. the differenttheprocessing
variations
conditions
in exerted
the particle size andduring the spray drying.
morphology were caused by the differences in the MWD of the MXs, and by
the different processing conditions exerted during the spray drying.Polymers 2019, 11, 312 7 of 14
Polymers 2019, 11, x FOR PEER REVIEW 7 of 15
Figure
Figure3.3.SEM
SEMmicrographs
micrographsof ofBJ-MX
BJ-MXsamples
samples after
after the
the spray drying process.
process. Run
Run identification
identification(A)(A)3,
3,(B)
(B)5,5,(C)
(C)6,6,(D)
(D)9,9,(E),
(E),12,
12,(F)
(F)15,
15,(G)
(G)16,16,(H)
(H)21,
21,(I)(I)22,
22,(J)(J)24,
24,and
and(K)
(K)25.
25.Scale
Scalebar
barisisequal
equaltoto5050µm
μmin
inall
allthe
theimages,
images,except
exceptinin(C)(C)and
and(I),
(I),where
whereisisequal
equaltoto100 100µm.
μm.
3.2.Yield
3.2. YieldofofDry
DryPowders,
Powders,Content
Contentand
andRetention
Retentionofofthe
theAntioxidant
Antioxidant
Table11shows
Table shows the the detailed
detailed description
descriptionof ofthe
theexperimental
experimentalruns, runs, the powder
the powder yield, thethe
yield, content,
content,and
retention of the antioxidant, obtained after the spray drying of the
and retention of the antioxidant, obtained after the spray drying of the BJ-MX at the different BJ-MX at the different processing
conditions.conditions.
processing AlthoughAlthough
some qualitative relations relations
some qualitative among the independent
among and categorical
the independent variables
and categorical
may be inferred
variables may befrom Tablefrom
inferred 1, theTable
quantitative analysis of the
1, the quantitative effect ofofthe
analysis theprocessing
effect of the variables on the
processing
yield and the content of the antioxidant, will be discussed in Section 3.3.
variables on the yield and the content of the antioxidant, will be discussed in Section 3.3. Figure 4 Figure 4 shows the calculated
yield and
shows the retention
calculatedofyield the 25andruns, from which
retention of the1825experiments
runs, fromresulted
which 18 in obtaining
experiments a dried powder.
resulted in
The calculated yields were in the range of 0.12%–10.77%, with an average
obtaining a dried powder. The calculated yields were in the range of 0.12%–10.77%, with an average of 5.74%. On the other hand,
ofthe content
5.74%. On of thethe quercetin
other hand, 3-theD -galactoside
content of the forquercetin
these 18 powders was in for
3-D-galactoside thethese
range18 ofpowders
0.0–2.36 µg/g was inof
dried
the range powder,
of 0.0–2.36and μg/g
an antioxidant retention
of dried powder, andofan 4.76%–13.7%. The average
antioxidant retention retention of The
of 4.76%–13.7%. the runs
averagewas
9.15%. However, there is not a direct relation between yield and the
retention of the runs was 9.15%. However, there is not a direct relation between yield and the retention of the antioxidant, since
the calculated
retention of thevalues were very
antioxidant, sincescattered. This means
the calculated values that there
were canscattered.
very be obtained low
This yieldsthat
means with high
there
retention,
can be obtainedand high yields with
low yields with high
low retention.
retention,Of and course, a highwith
high yields yieldlow with a high retention
retention. Of course, is desired.
a high
In this sense, the highest yield obtained was 10.77% with a retention
yield with a high retention is desired. In this sense, the highest yield obtained was 10.77% withof 8.77% (run 14), while the lowesta
yield wasof0.12%
retention 8.77%with(runa14),nullwhile
retention (run 2).
the lowest Thewas
yield highest
0.12%retention obtained
with a null was 13.7%
retention (run 2).withTheahighest
yield of
7.68% (run
retention 20). According
obtained was 13.7% to Lim,
with Ma & Dolan
a yield (2011),
of 7.68% (runthe yield
20). and retention
According to Lim, of Ma
anthocyanin
& Dolan (2011), content
in cull blueberry were 76%–79%, and 562 µg/g of blueberry solids,
the yield and retention of anthocyanin content in cull blueberry were 76%–79%, and 562 μg/g respectively, with a mixture of 30%
of
of blueberry solids in maltodextrin [29]. They mentioned that the exposition
blueberry solids, respectively, with a mixture of 30% of blueberry solids in maltodextrin [29]. They to heat, oxygen and light,
are the main
mentioned thatsources affecting the
the exposition todegradation
heat, oxygen of antioxidants.
and light, are Wach theetmain
al. (2007) obtained
sources 9.5 mg
affecting theof
quercetin 3- D -galactoside per gram of onion (Allium cepa L.) when the
degradation of antioxidants. Wach et al. (2007) obtained 9.5 mg of quercetin 3-D-galactoside per gramantioxidant was extracted with
of40% (v/v)
onion of methanol
(Allium cepa L.) in water
when the[30]. Araujo-Diaz
antioxidant was et al. (2017)
extracted determined
with 40% (v/v)aofconcentration
methanol in of quercetin
water [30].
Araujo-Diaz et al. (2017) determined a concentration of quercetin 3-D-galactoside of 0.093 ppmvalues
3- D -galactoside of 0.093 ppm in a mixture of blueberry juice and 30% of maltodextrin [22]. The in a
of the yield
mixture reported juice
of blueberry herein may
and 30% be of
relatively low when
maltodextrin [22].compared
The valueswith those
of the yieldreported
reported in the literature.
herein may
However,
be relatively it islow
worthwhenmentioning
compared that the yield
with thosewas calculated
reported in thebased on the ratio
literature. of the masses
However, of the
it is worth
dry powder, and the liquid mixture of BJ-MX fed into the dryer (Equation
mentioning that the yield was calculated based on the ratio of the masses of the dry powder, and the (2)).
liquid mixture of BJ-MX fed into the dryer (Equation (2)).Polymers 2019, 11, 312 8 of 14
Table 1. Experimental results of dry powder yield, content and retention of quercetin 3-D-galactoside.
Variation Levels of Variables Dry Powder Quercetin 3-D-Galactoside
Experiment
Number Content Retention
T (◦ C) C (%p/p) MD Yield (%)
(µg/g) (%)
1 170.0 30.0 Mc 6.37 1.51 8.77
3 170.0 30.0 M20 4.23 1.07 6.21
8 170.0 10.0 M40 0.00 0.00 0.00
10 170.0 21.6 M10 9.48 1.98 11.5
11 170.0 10.0 M20 0.00 0.00 0.00
21 170.0 10.0 M40 0.00 0.00 0.00
23 170.0 10.0 M20 0.00 0.00 0.00
25 170.0 21.6 M10 8.92 0.82 4.76
16 175.0 12.5 Mc 1.82 2.13 12.4
12 181.3 30.0 M40 2.02 1.92 11.1
24 181.3 30.0 M40 1.63 1.82 10.6
2 186.6 10.0 M10 0.12 0.00 0.00
13 190.0 20.0 Mc 7.00 2.35 13.6
17 190.0 19.6 M10 8.15 1.81 10.5
18 190.0 25.0 M20 2.81 1.91 11.1
14 193.1 30.0 M10 10.77 1.51 8.77
22 193.1 30.0 M10 9.68 1.31 7.61
19 209.4 24.2 M40 7.43 1.69 9.81
4 210.0 10.0 M40 0.00 0.00 0.00
5 210.0 30.0 Mc 6.74 1.1 6.39
6 210.0 18.4 M10 5.45 2.27 13.2
7 210.0 10.0 M20 0.00 0.00 0.00
9 210.0 10.0 Mc 0.00 0.00 0.00
Polymers 2019, 11, x FOR PEER REVIEW30.0
15 210.0 M20 3.03 0.82 4.76 9 of 15
20 210.0 20.0 Mc 7.68 2.36 13.7
Retention (%)
22 Yield (%)
20
18
Yield and Retention (%)
16
14
12
10
8
6
4
2
0
0
1
2
3
4
5
6
7
8
9
10
11
12
13
14
15
16
17
18
19
20
21
22
23
24
25
26
Experiment number
Figure 4. Yield (%), and retention (%) of quercetin 3-D-galactoside obtained for the 25 runs. The missing
Figure
bars 4. Yield
indicate (%),where
the runs and retention (%) of quercetin
sample collapsed during the3-spray
D-galactoside obtained for the 25 runs. The
drying process.
missing bars indicate the runs where sample collapsed during the spray drying process.
3.3. ANOVA and Surface Response Methodology Analysis
The analysis of variance (ANOVA) was employed to determine the quality of the data, and to
define the contribution of each of the independent variables on the response variables. The responsePolymers 2019, 11, 312 9 of 14
3.3. ANOVA and Surface Response Methodology Analysis
The analysis of variance (ANOVA) was employed to determine the quality of the data, and to
define the contribution of each of the independent variables on the response variables. The response
surface methodology (RSM) was employed to observe the minimum and maximum variations of the
data in the tested intervals. Table 2 shows the results of the ANOVA calculated for both response
variables, yield and content of antioxidant. The F-value indicates the extent of the effect of the
independent variable on the response variable, i.e. if F is equal to 1, then there is no effect, and as F
increases above 1, the independent variable has a larger effect on the response variable. In this sense,
the probability (p-value) of an F-value large enough to influence the experiment also indicates whether
the independent variable affects the experiment. If the p-value is equal or less that the significance level,
then the assumption of the influence of the variables on the experiments is correct. The significance
level represents the probability of rejecting the previous assumption even if it was true. From Table 2,
it is observed that temperature has a negligible effect on the yield, while the concentration of MX was
the variable with the most important effect. The type of maltodextrin is important, but quantitatively
its effect is less than that from the concentration. The p-value confirmed these observations for a
significance level of 0.05. The interactions between the same variable (intra) showed that temperature
(T2 ) has no effect on the yield, while the concentration (C2 ) has an effect, but less than the single
concentration. The interaction between the variables (inter) showed that only the concentration and
the type of maltodextrin (C·MX) had an effect on the yield, but the degree of the combined effects was
still less than the single effect of concentration. Therefore, concentration was the independent variable
with the larger effect on the yield.
The ANOVA results for the content of the antioxidant showed a similar behavior from those of the
yield. The effect of the independent variables showed a major dependence on the concentration, rather
than the temperature, and the type of maltodextrin. Concentration (C) was the only independent variable
with an F-value relatively high, and a p-value below the significance value. The inter-type interaction
of T·MX showed a positive F value, and p-value slightly above the significance value. For this reason,
the effect of the T·MX interaction must be considered with restrictions, since its variance is to some extent
away from the mean. The intra-type interactions of the variables showed that the effect of C2 was less
than the single concentration, and its corresponding p-value was below the significance level.
For both response variables, yield and content of antioxidant, the inlet temperature (T) showed
almost a negligible effect with a p-value above the confidence value in all the cases. This may indicate
that the selected interval of temperatures was not suitable for the experiment, and another range
of temperatures should have been selected, i.e., a wider range of inlet temperatures. However, this
observation could not be known until the end of the experiment and the subsequent analysis of variance.
Table 2. ANOVA results determined for the yield and content of antioxidant in the BJ-MX.
Yield Content
a b c a pa
Source DF SS MS F p DF SS MS b F
Model 14 62.215 4.444 49.242 0.0000 14 85.414 6.101 20.914 0.0000
T 1 0.013 0.013 0.14 0.7158 1 0.350 0.350 1.198 0.2993
C 1 30.857 30.857 341.913 0.0000 1 41.530 41.530 142.362 0.0000
MX 3 3.717 1.239 13.729 0.0007 3 2.350 0.783 2.686 0.1032
T·C 1 0.295 0.295 3.268 0.1007 1 0.240 0.240 0.821 0.3861
T·MX 3 0.587 0.196 2.168 0.1550 3 2.966 0.989 3.389 0.0621
C·MX 3 0.350 0.117 1.293 0.3299 3 1.559 0.520 1.781 0.2142
T2 1 0.067 0.067 0.739 0.4100 1 0.001 0.001 0.004 0.9501
C2 1 7.877 7.877 87.283 0.0000 10 15.021 15.021 51.491 0.0000
Residual 10 0.902 0.090 5 2.917 0.292
Total 24 63.118 24 88.33
a b c
Sum of squares; Mean squares; Calculated at a significance level of 0.05; T = Temperature, C = Maltodextrin
concentration, MX = Type of maltodextrin.Polymers 2019, 11, 312 10 of 14
Figures 5 and 6 show the corresponding response surface plots (RSP) for both, the yield and
content of the antioxidant, as a function of the MX type. The effect of the processing variables
on the yield as a function of the type of MX are presented in Figure 5A–D. As observed in the
plots, the maximum in the yield was found for a concentration of 25% of MX. Lower values of the
concentration of MX produced insignificant yield values. This behavior was similar for all the types
of MXs, but the overall yield value decreased with the type of the MX, which was observed as a flat
surface in the M20 and M40 RSP. Thus, the low molecular weight MXs (Mc, and M10) produced higher
yields than the high molecular weight MXs (M20, and M40). Saavedra-Leos et al. (2015) characterized
a set of maltodextrins similar to those employed herein, and reported an increase in the MWD and
DP of the MXs as McPolymers 2019, 11, 312 11 of 14
The RSP for the content of the quercetin 3-D-galactoside (Figure 6A–D) showed a more magnified
behavior than that of yield. However, the Mc presented the highest content of the antioxidant at 25%
of concentration of MX and 170 ◦ C, while in the M10 the highest content value was about 5% at the
same concentration value of 25% but at 210 ◦ C. In both, M20 and M40, the content of the antioxidant
was relatively low in the range of 2%–3%, and the effect of temperature was negligible.
Clearly, the results of the RSP helped to visualize the relation between the processing conditions,
and the type of MX. Based on these observations, it was possible to elucidate the optimal conditions
for obtaining the highest yield of powder with the highest content of the antioxidant. These conditions
were a concentration of 25% of MX and 170 ◦ C when employing the Mc, and 210 ◦ C with the M10.
Additionally, the RSP allowed setting the utilization limits of the MXs. Results showed that the low
molecular weight MXs (Mc and M10) presented a better performance as carrying agents in the spray
drying of BJ, while the higher molecular weight MXs (M20 and M40) were almost unresponsive in this
application. Specifically, the type of MX showed a selective influence on the content of the antioxidant,
since at low temperature the Mc had the highest value, while at higher temperature, the M10 showed
a better performance. Clearly, these results demonstrated that the different MXs might be employed
Polymers 2019, 11, x FOR PEER REVIEW 12 of 15
selectively as carrying agents in the spray drying of diverse processes.
(A) (B)
(C) (D)
Figure 6. Response surface plots for the content of quercetin 3-D-galactoside in the dry powder. Content
Figure 6. Response surface plots for the content of quercetin 3-D-galactoside in the dry powder.
is expressed in micrograms of antioxidant per gram of dry powder (µg/g). (A) Mc, (B) M10, (C) M20,
Content is expressed in micrograms of antioxidant per gram of dry powder (μg/g). (A) Mc, (B) M10,
and (D) M40.
(C) M20, and (D) M40.
Table 3 summarizes the predictive equations extrapolated from the SRP for the yield and content
Table 3 summarizes the predictive equations extrapolated from the SRP for the yield and content
of antioxidant as a function of the type of MX. The Box–Cox analysis revealed that a logarithmic
of antioxidant as a function of the type of MX. The Box–Cox analysis revealed that a logarithmic
transformation was necessary in order to stabilize the variance. It is worth mentioning that these
transformation was necessary in order to stabilize the variance. It is worth mentioning that these
equations are valid only within the range of conditions tested in this work. Overall, the drying
equations are valid only within the range of conditions tested in this work. Overall, the drying
temperature showed a negative effect on the yield while the concentration presented a positive effect.
temperature showed a negative effect on the yield while the concentration presented a positive effect.
The positive values of the interactions between temperature and concentration (T·C), and the square
of temperature (T^2) seemed to be almost insignificant, but numerically their contributions were in
the order of that from the concentration. The square of the concentration (C^2) showed a negative
effect, but less than the single concentration. The values of these three interactions (T·C, T^2, and
C^2), showed constant values for all the types of MXs, suggesting the unresponsiveness of thesePolymers 2019, 11, 312 12 of 14
The positive values of the interactions between temperature and concentration (T·C), and the square of
temperature (T2 ) seemed to be almost insignificant, but numerically their contributions were in the
order of that from the concentration. The square of the concentration (C2 ) showed a negative effect,
but less than the single concentration. The values of these three interactions (T·C, T2 , and C2 ), showed
constant values for all the types of MXs, suggesting the unresponsiveness of these interactions to the
type of MX. Numerically, the effect of the type of MX showed that the Mc produced a higher yield at
low temperatures, i.e., 170 ◦ C, while in the M10 the highest yield was achieved at a higher temperature,
i.e., 210 ◦ C. The other two MXs (M20 and M40) were almost insensible to the changes in the variables,
confirming the observed from the SRP.
Table 3. Predicting equations extrapolated from the SRP for the yield and content of antioxidant in the
BJ-MX, as a function of the type of MX.
TYPE OF MX YIELD
Mc ln(Y + 0.2) = 12.4315 − 0.1723T + 0.5884C + 0.0009T ·C + 0.0004T 2 − 0.0154C2
M10 ln(Y + 0.2) = 8.3470 − 0.1542T + 0.6239C + 0.0009T ·C + 0.0004T 2 − 0.0154C2
M20 ln(Y + 0.2) = 9.1970 − 0.1603T + 0.5938C + 0.0009T ·C + 0.0004T 2 − 0.0154C2
M40 ln(Y + 0.2) = 6.5865 − 0.1450T + 0.5801C + 0.0009T ·C + 0.0004T 2 − 0.0154C2
CONTENT
Mc ln( Q + 0.03) = −0.8171 − 0.0358T + 0.8108C + 0.0008T ·C − 0.00005T 2 − 0.0213C2
M10 ln( Q + 0.03) = −15.6519 + 0.0311T + 0.8816C + 0.0008T ·C − 0.00005T 2 − 0.0213C2
M20 ln( Q + 0.03) = −10.1509 + 0.0013T + 0.8761C + 0.0008T ·C − 0.00005T 2 − 0.0213C2
M40 ln( Q + 0.03) = −9.9870 − 0.0015T + 0.9058C + 0.0008T ·C − 0.00005T 2 − 0.0213C2
Y = Yield (%), Q = Content of antioxidant (µg/g), T = Temperature (◦ C), C = Concentration of maltodextrin (wt. %).
In general, the content of the antioxidant followed a similar behavior to that of the yield.
The temperature had a negative effect on the content, while the influence of the concentration was
positive and relatively larger than the former variable. The effect of the interactions (T·C, and T2 ) was
positive and negative, respectively, and relatively lower than that of the concentration. The square of
the concentration was negative, with a contribution in the order of that from the concentration.
4. Conclusions
The effect of the processing variables on the spray drying of mixtures of blueberry juice (BJ)
and maltodextrins (MX) were studied in this work. Two independent variables (inlet temperature
and concentration of MX), and one categorical variable (type of MX) were tested in a D-optimal
experimental design. The influence of the variables on the yield, content and retention of an antioxidant
(quercetin 3-D-galactoside), was determined quantitatively by the analysis of variance (ANOVA), and
qualitatively by the surface response plots (SRP). The results showed that the concentration was
the main variable affecting both, the yield and content of the antioxidant, while temperature had a
relatively low effect. Additionally, the low molecular weight MXs showed a better response to this
technological application. The physicochemical characterization by optical micrographs, and X-ray
diffraction (XRD), showed that the powder appearance, and microstructure, remained unaffected with
the variations in the processing conditions. However, from the scanning electron microscopy (SEM)
analysis, variations in both size and morphology of the particles were observed. Based on the SRP, a set
of empirical equations were determined, which could be employed for predicting the yield and content
of the antioxidant. With these results, it was possible to set the optimal processing conditions for the
spray drying of BJ-MX, and elucidate the application limits of the MXs based on the molecular weight
distribution. The commercial grade MX (Mc) showed optimal yield and content of the antioxidant
quercetin 3-D-galactoside at a concentration of 25% of MX and a processing temperature of 170 ◦ C,
while the optimal performance of maltodextrin M10 was at 25% and 210 ◦ C. The other two MXs tested
(M20 and M40) were almost insensitive for this application.Polymers 2019, 11, 312 13 of 14
Supplementary Materials: The following are available online at http://www.mdpi.com/2073-4360/11/2/312/s1.
Figure S1: Thermal analysis of selected BJ-MX samples: (A) TGA and (B) DSC; Figure S2: Chromatograms obtained
for the calibration curve of quercetin 3-D-galactoside at five concentrations (0.1, 1, 5, 10, and 20 µg/mL). Figure S3:
Calibration curves for quercetin 3-D-galactoside. Figure S4: Typical chromatogram of an injected dry powder
(experiment 18) after the extraction process. Table S1: Experimental data obtained for each calibration curve.
Author Contributions: Conceptualization, M.Z.S.-L. and C.L.-P.; Data curation, R.G.-G.; Formal analysis, C.L.-P.
and R.G.-G.; Funding acquisition, M.Z.S.-L.; Investigation, M.Z.S.-L., C.L.-P., L.A.L.-M., J.O.M. and I.C.M.;
Methodology, L.A.L.-M., J.O.M. and I.C.M.; Project administration, M.Z.S.-L.; Software, R.G.-G.; Visualization,
A.T.-T.; Writing—original draft, M.Z.S.-L. and C.L.-P.; Writing—review & editing, C.L.-P.
Funding: This research did not receive any specific grant from funding agencies in the public, commercial, or
not-for-profit sectors.
Acknowledgments: The support provided by Gregorio Vazquez-Olvera and Pedro Pizá-Ruíz, by the assistance
with the acquisition of the optical micrographs, and to Ernesto Guerrero by the XRD analysis.
Conflicts of Interest: The authors declare no conflict of interest. The funders had no role in the design of the
study; in the collection, analyses, or interpretation of data; in the writing of the manuscript, or in the decision to
publish the results.
References
1. Lee, L.; Choi, E.; Kim, C.; Sung, J.; Kim, Y.; Seo, D.; Choi, H.; Choi, Y.; Kum, J.; Park, J. Contribution of
Flavonoids to the Antioxidant Properties of Common and Tartary Buckwheat. J. Cereal Sci. 2016, 68, 181–186.
[CrossRef]
2. Masisi, K.; Beta, T.; Moghadasian, M.H. Antioxidant Properties of Diverse Cereal Grains: A Review on in
Vitro and in Vivo Studies. Food Chem. 2016, 196, 90–97. [CrossRef] [PubMed]
3. Polanski, J.F.; Soares, A.D.; de Mendonça Cruz, O.L. Antioxidant Therapy in the Elderly with Tinnitus.
Braz. J. Otorhinolaryngol. 2016, 82, 269–274. [CrossRef] [PubMed]
4. Sinelli, N.; Spinardi, A.; Di Egidio, V.; Mignani, I.; Casiraghi, E. Evaluation of Quality and Nutraceutical
Content of Blueberries (Vaccinium Corymbosum L.) by Near and Mid-Infrared Spectroscopy. Postharvest
Biol. Technol. 2008, 50, 31–36. [CrossRef]
5. Faria, A.; Oliveira, J.; Neves, P.; Gameiro, P.; Santos-Buelga, C.; de Freitas, V.; Mateus, N. Antioxidant
Properties of Prepared Blueberry (Vaccinium Myrtillus) Extracts. J. Agric. Food Chem. 2005, 53, 6896–6902.
[CrossRef]
6. Skrovankova, S.; Sumczynski, D.; Mlcek, J.; Jurikova, T.; Sochor, J. Bioactive Compounds and Antioxidant
Activity in Different Types of Berries. Int. J. Mol. Sci. 2015, 16, 24673–24706. [CrossRef] [PubMed]
7. Retamales, J.B.; Hancock, J.F. The Blueberry Industry. In Blueberries, 2nd ed.; Russell, R., Wilford, S., Eds.;
Cabi: Boston, MA, USA, 2018; pp. 1–17.
8. Mohideen, F.W.; Solval, K.M.; Li, J.; Zhang, J.; Chouljenko, A.; Chotiko, A.; Prudente, A.D.; Bankston, J.D.;
Sathivel, S. Effect of Continuous Ultra-Sonication on Microbial Counts and Physico-Chemical Properties of
Blueberry (Vaccinium Corymbosum) Juice. LWT-Food Sci. Technol. 2015, 60, 563–570. [CrossRef]
9. Dhuique-Mayer, C.; Tbatou, M.; Carail, M.; Caris-Veyrat, C.; Dornier, M.; Amiot, M.J. Thermal Degradation
of Antioxidant Micronutrients in Citrus Juice: Kinetics and Newly Formed Compounds. J. Agric. Food Chem.
2007, 55, 4209–4216. [CrossRef]
10. Wang, C.Y.; Chen, C.; Wang, S.Y. Changes of Flavonoid Content and Antioxidant Capacity in Blueberries
After Illumination with UV-C. Food Chem. 2009, 117, 426–431. [CrossRef]
11. Cano-Chauca, M.; Stringheta, P.; Ramos, A.; Cal-Vidal, J. Effect of the Carriers on the Microstructure of
Mango Powder obtained by Spray Drying and its Functional Characterization. Innov. Food Sci. Emerg. Technol.
2005, 6, 420–428. [CrossRef]
12. Silva, C.L.; de Noronha, M.N.; Morim, A. Spray Drier–Atomization of Milk. In Experiments in Unit Operations
and Processing of Foods; Cortez Vieira, M.M., Ho, P., Eds.; Springer: New York, NY, USA, 2008; pp. 77–80.
13. Leyva-Porras, C.; López-Pablos, A.L.; Alvarez-Salas, C.; Pérez-Urizar, J.; Saavedra-Leos, Z. Physical
Properties of Inulin and Technological Applications. In Polysaccharides; Ramawat, K.G., Mérillon, J.M.,
Eds.; Springer: New York, NY, USA, 2015; pp. 959–984.
14. Mujumdar, A.S. Innovation in Drying. Drying Technol. 1996, 14, 1459–1475. [CrossRef]Polymers 2019, 11, 312 14 of 14
15. van Sleeuwen, R.M.; Zhang, S.; Normand, V. Spatial Glass Transition Temperature Variations in Polymer
Glass: Application to a Maltodextrin–water System. Biomacromolecules 2012, 13, 787–797. [CrossRef]
[PubMed]
16. Saavedra-Leos, Z.; Leyva-Porras, C.; Araujo-Díaz, S.B.; Toxqui-Terán, A.; Borrás-Enríquez, A.J. Technological
Application of Maltodextrins According to the Degree of Polymerization. Molecules 2015, 20, 21067–21081.
[CrossRef] [PubMed]
17. Antonio-Estrada, C.; Bello-Pérez, L.; Martínez-Sánchez, C.; Montañez-Soto, J.; Jiménez-Hernández, J.;
Vivar-Vera, M. Enzymatic Production of Maltodextrins from Taro (Colocasia Esculenta) Starch. CyTA-J. Food
2009, 7, 233–241. [CrossRef]
18. Valenzuela, C.; Aguilera, J.M. Effects of Maltodextrin on Hygroscopicity and Crispness of Apple Leathers.
J. Food Eng. 2015, 144, 1–9. [CrossRef]
19. Shrestha, A.K.; Ua-Arak, T.; Adhikari, B.P.; Howes, T.; Bhandari, B.R. Glass Transition Behavior of Spray
Dried Orange Juice Powder Measured by Differential Scanning Calorimetry (DSC) and Thermal Mechanical
Compression Test (TMCT). Int. J. Food Prop. 2007, 10, 661–673. [CrossRef]
20. Jittanit, W.; Niti-Att, S.; Techanuntachaikul, O. Study of Spray Drying of Pineapple Juice using Maltodextrin
as an Adjunct. Chiang Mai J. Sci. 2010, 37, 498–506.
21. Tonon, R.V.; Brabet, C.; Hubinger, M.D. Anthocyanin Stability and Antioxidant Activity of Spray-Dried Açai
(Euterpe Oleracea Mart.) Juice Produced with Different Carrier Agents. Food Res. Int. 2010, 43, 907–914.
[CrossRef]
22. Araujo-Díaz, S.; Leyva-Porras, C.; Aguirre-Bañuelos, P.; Álvarez-Salas, C.; Saavedra-Leos, Z. Evaluation of
the Physical Properties and Conservation of the Antioxidants Content, Employing Inulin and Maltodextrin
in the Spray Drying of Blueberry Juice. Carbohydr. Polym. 2017, 167, 317–325. [CrossRef]
23. da Costa, R.S.; Teixeira, C.B.; Gabbay Alves, T.V.; Ribeiro-Costa, R.M.; Casazza, A.A.; Aliakbarian, B.;
Converti, A.; Silva Júnior, J.O.; Perego, P. Optimization of Spray Drying Conditions to Microencapsulate
Cupuassu (Theobroma Grandiflorum) Seed by-Product Extract. Nat. Prod. Res. 2018, 1–9. [CrossRef]
24. Munson-McGee, S.H. D-Optimal Experimental Designs for Uniaxial Expression. J. Food Process Eng. 2014, 37,
248–256. [CrossRef]
25. Saavedra-Leos, M.Z.; Leyva-Porras, C.; Alvarez-Salas, C.; Longoria-Rodríguez, F.; López-Pablos, A.L.;
González-García, R.; Pérez-Urizar, J.T. Obtaining Orange Juice–maltodextrin Powders without Structure
Collapse Based on the Glass Transition Temperature and Degree of Polymerization. CyTA-J. Food 2018, 16,
61–69. [CrossRef]
26. Sansone, F.; Mencherini, T.; Picerno, P.; d’Amore, M.; Aquino, R.P.; Lauro, M.R. Maltodextrin/Pectin
Microparticles by Spray Drying as Carrier for Nutraceutical Extracts. J. Food Eng. 2011, 105, 468–476.
[CrossRef]
27. Santiago-Adame, R.; Medina-Torres, L.; Gallegos-Infante, J.; Calderas, F.; González-Laredo, R.;
Rocha-Guzmán, N.; Ochoa-Martínez, L.; Bernad-Bernad, M. Spray Drying-Microencapsulation of Cinnamon
Infusions (Cinnamomum Zeylanicum) with Maltodextrin. LWT Food Sci.Technol. 2015, 64, 571–577. [CrossRef]
28. Ahmed, I.; Niazi, M.B.K.; Jahan, Z.; Naqvi, S.R. Effect of Drying Parameters on the Physical, Morphological
and Thermal Properties of Spray-Dried Inulin. J. Polym. Eng. 2018, 38, 775–783. [CrossRef]
29. Lim, K.; Ma, M.; Dolan, K.D. Effects of Spray Drying on Antioxidant Capacity and Anthocyanidin Content
of Blueberry By-products. J. Food Sci. 2011, 76, H156–H164. [CrossRef]
30. Wach, A.; Pyrzyńska, K.; Biesaga, M. Quercetin Content in some Food and Herbal Samples. Food Chem. 2007,
100, 699–704. [CrossRef]
31. Wang, Y.; Wang, L. Structures and Properties of Commercial Maltodextrins from Corn, Potato, and Rice
Starches. Starch/Stärke 2000, 52, 296–304. [CrossRef]
© 2019 by the authors. Licensee MDPI, Basel, Switzerland. This article is an open access
article distributed under the terms and conditions of the Creative Commons Attribution
(CC BY) license (http://creativecommons.org/licenses/by/4.0/).You can also read