ENSO feedback drives variations in dieback at a marginal mangrove site
←
→
Page content transcription
If your browser does not render page correctly, please read the page content below
www.nature.com/scientificreports
OPEN ENSO feedback drives variations
in dieback at a marginal mangrove
site
S. M. Hickey1,2,3*, B. Radford1,2,3, J. N. Callow1, S. R. Phinn4, C. M. Duarte5 & C. E. Lovelock6
Ocean–atmosphere climatic interactions, such as those resulting from El Niño Southern Oscillation
(ENSO) are known to influence sea level, sea surface temperature, air temperature, and rainfall in
the western Pacific region, through to the north-west Australian Ningaloo coast. Mangroves are
ecologically important refuges for biodiversity and a rich store of blue carbon. Locations such as
the study site (Mangrove Bay, a World Heritage Site within Ningaloo Marine Park and Cape Range
National Park) are at the aridity range-limit which means trees are small in stature, forests small in
area, and are potentially susceptible to climate variability such as ENSO that brings lower sea level
and higher temperature. Here we explore the relationship between mangrove dieback, and canopy
condition with climatic variables and the Southern Oscillation Index (SOI)—a measure of ENSO
intensity, through remote sensing classification of Landsat satellite missions across a 29 year period
at a north-west Australian site. We find that the SOI, and seasonal mean minimum temperature are
strongly correlated to mangrove green canopy (as indicator of live canopy) area. This understanding
of climate variations and mangrove temporal heterogeneity (patterns of abundance and condition)
highlights the sensitivity and dynamics of this mangrove forest and recommends further research
in other arid and semi-arid tropical regions at mangrove range-limits to ascertain the extent of this
relationship.
The global climate system controls ocean and atmosphere interactions, influencing sea surface temperature (SST),
air temperature, rainfall, and w ind1. Such climatic variables have been reported as drivers of mangrove variability
2
at local and regional scales . Most notably, temperature, salinity and precipitation have been consistently reported
as constraining abiotic variables in mangrove forest condition, and distribution3, and when altered have resulted
in tree mortality4, change in species composition, and loss or reduction in function (e.g., ability to store carbon)5.
Mangroves in arid ecoregions are often characterised by trees that are small in stature and limited in areal
cover, yet they are ecologically important refuges for biodiversity in the r egion3, important blue carbon s inks5,
and act as a buffer for coastal p rotection6. Avicennia spp. covers the largest range, exhibiting a broad tolerance
to such abiotic conditions. Whilst salt-tolerant, mangroves are susceptible to high salinity and as such are vul-
nerable to the effects of climatic changes, including the frequency and intensity of drought events7,8. However,
extreme conditions can result in physiological thresholds being reached or exceeded, thereby impacting metabolic
processes9 and causing physiological stress or mortality, as has been observed during extreme drought events,
or post hydrological enforcements (e.g., tide barriers)10.
Coupled ocean–atmosphere phenomena, such as the El Niño Southern Oscillation (ENSO) influence sea
level, SST, air temperature, and rainfall in the western Pacific region, with effects noted at various regions across
the globe11. In north-west Australia, the Ningaloo coast experiences known fluctuations in sea level, and SST.
The weakening of the equatorial trade winds during El Niño events results in the shoaling of the thermocline
in the western Pacific, and in turn lower sea levels caused by cooler waters on the west Australian coastline12,13.
The reverse occurs during La Niña events. Therefore, during an El Niño event the mangroves of north-western
Australia are subjected to lower sea levels14. The minimal freshwater input in these semi-arid environments means
they are potentially subjected to higher saline conditions in the upper tidal and edge locations, which can lead
to loss of mangrove canopy and mortality. For example, Drexler and Ewel15 reported that during the 1997/98 El
1
The School of Agriculture and Environment, Faculty of Science, University of Western Australia, Perth, WA,
Australia. 2The Oceans Institute, University of Western Australia, Perth, WA, Australia. 3Australian Institute
of Marine Science (AIMS), Crawley, WA, Australia. 4Remote Sensing Research Centre, School of Earth and
Environmental Sciences, The University of Queensland, Brisbane, QLD, Australia. 5Red Sea Research Center,
King Abdullah University of Science and Technology, Thuwal, Saudi Arabia. 6School of Biological Sciences, The
University of Queensland, Brisbane, QLD, Australia. *email: sharyn.hickey@uwa.edu.au
Scientific Reports | (2021) 11:8130 | https://doi.org/10.1038/s41598-021-87341-5 1
Vol.:(0123456789)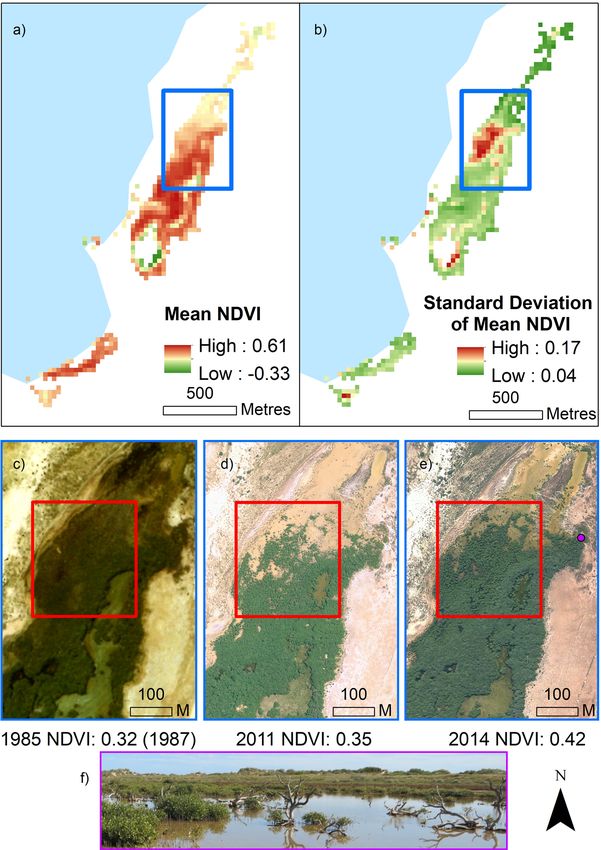
www.nature.com/scientificreports/
Niño, salinity in a Micronesian mangrove forest increased, while rainfall decreased and the water table lowered,
limiting freshwater in the forest and resulting in a decline in mangrove growth rate15. Furthermore, the largest
mangrove mortality observed occurred in remote northern Australia and coincided with the 2015/16 El Niño4,7,16.
This large-scale dieback event has been linked to lower water levels and high s alinity4,7,16, resulting in changes
to the geochemical composition of the trees and sediment pre and post the mortality7.
Mangroves provide critical habitat, coastal protection, and store vast amounts of atmospheric carbon. The
frequency, and duration of El Niño events is expected to intensify with increased global temperatures17. Variations
in climatic events, and in turn the variables they influence, such as sea level, and temperature, have repercus-
sions for the marine environment. ENSO events have shown to influence juvenile fish recruitment, and whale
shark aggregation on the Ningaloo coast (north-west Australian coastline)18. At Mangrove Bay, within Ningaloo
Marine Park and Cape Range National Park, two known mangrove dieback events coincided with El Niño events,
and associated lower sea levels, that resulted in higher soil s alinity5,19. Understanding how variation in climate
and environment influences the temporal heterogeneity (patterns of abundance and condition) of mangrove
forests remains an ongoing priority, especially in a semi-arid climatic zone that is at the upper mangrove abiotic
thresholds (e.g., temperature and salinity).
Remotely sensed spatiotemporal datasets enable large amounts of data to be interrogated at local (site) to
global scales20. In particular, Landsat imagery provides a regular, consistent and recent history of mangrove
change that can be used to compare with environmental data over time. The distinct spectral signature of man-
groves means remotely sensed data can enable their extent and some of their structural and physiological proper-
apped17–22. Previous studies have tended to focus on specific locations within the mangrove canopy
ties to be m
and not across the entire mangrove area, or on a singular event, and not across a significant time-period covering
both impact and recovery of mangrove canopy alongside multiple ENSO phases, we aim to do this here. The
objective of this study is to investigate the relationship between mangrove canopy extent, with climatic variables
(air temperature, precipitation) and the Southern Oscillation Index (SOI). We also explore the Normalised Differ-
ence Vegetation Index (NDVI) as a proxy to determine the spatial variation in the canopy condition through the
study period. The SOI provides an indication of the intensity of ENSO c onditions23 by measuring the strength of
the Walker C irculation23, which refers to the wind circulation in same tropical region (Julian and Chervin 1978).
To examine the relationship between mangroves in north-west Australia, climatic variables and the SOI we
first determine mangrove canopy area for each time-point across the observed period (1987 to 2016) through
classifying green mangrove canopy from the spectral properties in the Landsat image series for Mangrove Bay
(Fig. 1) using a supervised classification method. Mangrove Bay was specifically chosen as it represents a mar-
ginal environment where environmental gradients limiting mangrove growth are expressed in a small accessible
geographic area. We use Generalised Additive Mixed Models (GAMMs) to ascertain the relationship between
climatic variables and the SOI, with mangrove canopy area. We then explore the spatial heterogeneity of the
canopy using the NDVI as a proxy to determine the spatial variation in canopy condition as observed across the
time-period, as a means to illustrate where change in condition has occurred within the canopy. NDVI is related
to condition in mangroves, with higher values indicating healthy, dense f orests24.
Mangrove Bay is located in a semi-arid environment in the Pilbara region of NW Australia within Ningaloo
Marine Park and Cape Range National Park (Fig. 1). It is dominated by Avicennia marina, though a range of
other species make minor contributions to the canopy. The region can experience rapid heavy rainfall due to
tropical cyclones occurring December–April, though a higher incidence of rainy days generally occurs in the
winter months. Mean annual temperature ranges from 18 to 32 °C, with higher temperatures averaging 37 °C
December-February. Despite its small size, Mangrove Bay is of high ecological importance due to its role in sup-
porting biodiversity in the region as one of the southernmost mangrove stands in Western Australia (Cassata and
Collins 2008; Reef et al. 2014), and an important ecotone near the tropical and temperate marine transition zone.
Results
Mangrove classification. The mangrove canopy area derived from supervised classification of the Landsat
image series (5TM, 7 ETM, 8OLI) from 213 time-points (months) varied temporally (Fig. 2). The classification
was based on green canopy and represents the live (as represented by green leaves) mangrove canopy area from
spectral properties. Mean annual canopy area identified illustrated an oscillating pattern (Fig. 2) across the years,
which correlated with the SOI (Fig. 2). Temperature and precipitation varied across the years and were also cor-
related with canopy area (SI1).
Mangroves, climatic variables and the SOI. The GAMMs analysis showed that the SOI intensity, and
mean minimum temperature were strongly correlated to variation in green mangrove canopy area across the
29 years when analysed seasonally (AICc = 326.69, r2(adj) = 0.508, t = 37.09, n = 58; SOI: F = 27.09, P = 0.0001;
Mean Minimum Temperature: F = 36.95, P = 0.0001) (Table 1 and SI6). SOI displayed a positive linear associa-
tion with the canopy area, indicating that increases in green canopy cover occurred when conditions were not
likely to be representative of El Niño events (Fig. 3). Whilst seasonal mean minimum temperature displayed a
negative linear association with canopy, indicating the increases in green canopy occurred when seasonal mean
minimum temperature was lower (Fig. 3).
Mangrove NDVI. The mean temporal NDVI and its standard deviation was calculated for all pixels that
were classified as mangrove from the above mangrove spectral classification. Spatial trends were apparent across
the site (Fig. 4), with the edges of the core mangrove canopy area, particularly at the northern end of the region,
exhibiting high variation in standard deviation of mean NDVI (Fig. 4), and lower mean NDVI. This area coin-
Scientific Reports | (2021) 11:8130 | https://doi.org/10.1038/s41598-021-87341-5 2
Vol:.(1234567890)www.nature.com/scientificreports/
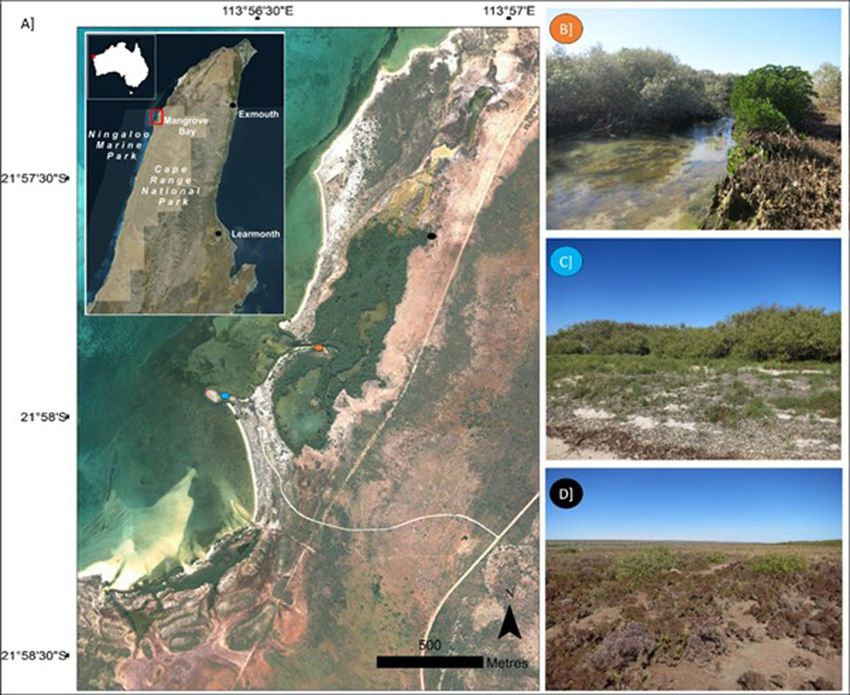
Figure 1. (A) Mangrove Bay, a small lagoon fringing coral reefs lies within Ningaloo Marine Park and Cape
Range National Park, in north-western Australia (inset map). The site is predominately Avicennia marina, with
some Rhizophora stylosa occurring around the lagoon (B), it is bordered by small shrubs and grasses within an
arid bioregion (C, D). Figure created in ArcGIS v10.6. Photo (C, D) credit: S. Hickey. Aerial imagery provided
by WA Department of Biodiversity, Conservation and Attractions.
cides with dead mangrove trees and subsequent new mangrove growth apparent in Fig. 4 and representative of
the changes in green canopy area depicted in the spectral supervised classification (Fig. 2).
Discussion
Climate change has heightened the need for increasing our understanding of how ocean-climate interactions
influence the environmental variables and associated ecosystems. In addressing this issue our study focussed on
the SOI, and variation in air temperature and precipitation. The SOI is known to influence factors that impose
environmental constraints on mangroves in the NW region of Australia including sea level, and temperature,
indicators we found to strongly correlate with mangrove canopy area across the study period. We were able to
demonstrate the effect of SOI and high temperature on mangrove canopy at Mangrove Bay through analysis
of twenty-nine years of near continuous Landsat data and provide a mechanism to further explore mangrove
change relationships to climatic patterns. We found that during this study period mangrove canopy area at this
NW Australian site exhibited a decreasing trend during periods of negative SOI, which are indicative of El Niño
conditions.
The periods of negative SOI (El Niño conditions) coincide with low sea level, and low precipitation along
the west Australian c oast14. Previous studies have reported that high salinity, and low freshwater inputs from
rainfall25, groundwater or river flows can lead to mangrove dieback, particularly in areas of restricted tidal
flows26, or d
roughts7,10. With decreased inundation in arid conditions mangrove trees have been documented to
progressively lose leaves with eventual death due to a diminished capacity for water uptake and salt e xclusion10.
El Niño conditions on the northern and west Australian coast appear to amplify this, with high levels of salinity
associated with low sea level at this World Heritage Area site during two El Niño events19, and large-scale dieback
Scientific Reports | (2021) 11:8130 | https://doi.org/10.1038/s41598-021-87341-5 3
Vol.:(0123456789)www.nature.com/scientificreports/
Figure 2. Annual mean mangrove area determined from the green canopy spectral classification (left axis). The
Southern Oscillation Index (SOI) annual average for the study period (right axis). A value of -7 or less indicates
El Nino conditions, whilst + 7 is indicative of La Nina conditions. The oscillating green mangrove canopy and
SOI have an overlapping trend.
Variable Importance
SOI 0.999
Mean minimum temperature 0.401
Highest temperature 0.302
Mean maximum temperature 0.198
Lowest temperature 0.183
Highest minimum temperature 0.104
Lowest maximum temperature 0.097
Total precipitation 0.095
Table 1. Variable importance from GAMMs. SOI and Mean Minimum temperature had highest importance,
indicating they are the most strongly correlated to mangrove change at Mangrove Bay.
also occurring at the Gulf of Carpentaria in northern Australia during the 2015–2016 El Niño event with low sea
level, low rainfall, and high temperatures also recorded7,16,27. Both the Mangrove Bay and Gulf of Carpentaria
sites occur within the northern Australia tropical region and have climate and other habitats influenced by ENSO
(e.g., sea-surface temperature, coral bleaching). Whilst previous research is limited5,16,19 these dieback events
suggest these areas have similar susceptibility to ENSO changes and in turn similar ecological responses were
observed. Further research of stressors is required to ascertain if this response is apparent in other mangrove
patches in this region.
Spatial differences in mangrove condition were illustrated by areas of high variance in canopy condition
determined from NDVI. These areas were dynamic and illustrated tree death, and subsequent new growth as
an oscillating pattern throughout the long-term study period (Fig. 2) and reflected earlier findings by Lovelock
et al.19 at this site during two El Niño events that occurred during the time span of this study. Mangrove forest
fragmentation has been associated with mangrove deforestation and loss of function, including changes in spe-
cies composition28, the temporal NDVI spatial clustering metrics indicate that there are changes to the canopy
that should be monitored further. The relationship with ENSO and the oscillating pattern in canopy area and
condition displayed through our dataset shows that mangroves are sensitive to climate extremes though are able
to recover during benign climatic periods, and in SOI phases indicative of La Niña conditions when sea level
is higher in this region. The most spatially dynamic area of mangrove decline was found at the landward edge
of the mangrove region, away from the creek entrance and lagoon. This area of the mangrove canopy has been
shown to contain shorter trees compared to those close to the seaward side (Hickey et al. 2018), suggesting that
this northern edge may be at the upper thresholds for optimal growth conditions in the area and therefore may
be most sensitive to changes in environmental variables, such as a decline in sea level (associated with El Nino)14
and increase in air temperature as we report here.
Scientific Reports | (2021) 11:8130 | https://doi.org/10.1038/s41598-021-87341-5 4
Vol:.(1234567890)www.nature.com/scientificreports/
Figure 3. The GAMM analysis indicated the (top) SOI and (bottom) mean minimum temperature were the
best predictors for area changes in mangrove canopy at Mangrove Bay (AICc = 326.69, r2(adj) = 0.508, t = 37.09,
n = 58; SOI: F = 27.09, P = 0.0001; Mean Minimum Temperature: F = 36.95, P = 0.0001). Both variables displayed
a linear relationship with the mangrove canopy area, with (top) SOI values indicative of El Nino and (bottom)
mean minimum temperatures relating to lower green canopy.
Changes in environmental conditions due to SOI are common to many regions of the world, with condi-
tions in marine and terrestrial systems affected, including rainfall and drought conditions (Harris et al. 2018),
sea surface temperature and coral bleaching29. However, this relationship in mangrove environments has only
recently begun to be explored. Limited studies tend to focus on small locations within the mangrove canopy and
not across the entire mangrove area, or on a singular event and not across a significant time-period covering
both impact and recovery of mangrove canopy alongside multiple ENSO phases, as we do here. This study shows
that the benign climatic phases are essential for recovery to occur. However, anthropogenic climate change has
been shown to affect environmental variables such as increased temperature and change in rainfall patterns30.
Such variations in temperature, or rainfall may alter the conditions during the benign climatic phase, potentially
limiting the recovery opportunity for mangroves. This may further increase the vulnerability of these arid and
semi-arid mangroves already near physiological thresholds, during sustained negative SOI impact events (that
is El Niño conditions), such as increasing the area of mortality and decline in canopy c ondition16, or species
composition28. The importance of SOI associated reductions in sea level and increased temperature warrants a
larger investigation of the fate of mangroves in Australia, especially with predicted changes in a ridity31 within
tropical and subtropical regions, and the intensification of the effects of ENSO in the tropical Pacific and eastern
Indian Ocean regions12,13,32.
Ecosystem structure, function, and species distribution are greatly influenced by climate e xtremes33. Further
analysis of ecosystem-scale threshold responses elsewhere would build on the findings of this study and may
provide information on the duration and level of variation in sea level and temperature increase required before
canopy loss or dieback occurs, whilst also providing insight into recovery time, and areas of the mangrove stand
that are most vulnerable. Undertaking such studies enables for enhanced anticipation of the response of man-
groves to changes in climate, including the frequency and intensity of climate e xtremes34.
This study has shown that the SOI is strongly correlated to mangrove changes at Mangrove Bay, a site located
within the World Heritage Area of Ningaloo Marine Park. This site, while relatively small, is representative of
mangrove sites in arid and semi-arid regions. The NW Australian coastline, like other arid locations has man-
grove trees that are small in stature and forests with limited extent, though they function as important habitats
for fish and prawns, as well as other marine fauna in these regions. The long temporal record at Mangrove Bay
has illustrated that ENSO conditions affect mangrove canopy area and ‘greenness’, which has been detected using
free Landsat imagery, alongside climate variables. This method could be applied to other arid and semi-arid
mangroves, or those mangrove stands located within tropical regions affected by ENSO conditions to further
establish the relationship between mangroves condition and ENSO. This information may be used in man-
agement, to establish monitoring sites, and to minimise hydrologic constraints from anthropogenic activities
Scientific Reports | (2021) 11:8130 | https://doi.org/10.1038/s41598-021-87341-5 5
Vol.:(0123456789)www.nature.com/scientificreports/
Figure 4. (a) Mean temporal NDVI across the Mangrove Bay site is highest in the centre of the mangrove
stand, proximal to the lagoon entrance, where (b) standard deviation of mean NDVI is lowest. Spatial clustering
of high standard deviation of mean NDVI is apparent in the northern section, at the edge of the mangrove
canopy. This area (blue outline represents area of insets c–e) in the aerial images shows examples (red box) of
canopy thinning and regrowth across the study period observed at the site. NDVI values correspond to the
average values of the entire mangrove region (the whole site) for that year. Dieback of trees can be seen from the
photo (f) which was captured on site in June 2014 adjacent to this section of the stand (indicated by purple circle
in (e). Aerial imagery provided by WA Department of Biodiversity, Conservation and Attractions. For larger
version (c) see SI10.
during periods when sea level is lower due to ENSO and when mangroves may be experiencing reduced tidal
connectivity and freshwater inundation.
Scientific Reports | (2021) 11:8130 | https://doi.org/10.1038/s41598-021-87341-5 6
Vol:.(1234567890)www.nature.com/scientificreports/
Methods
Mangrove classification. Cloud-free Landsat 5, 7 TM and 8 OLI imagery (path 115, row 75) were acquired
for all available months from 1987 to 2016 (n = 213) where there was no cloud, striping, atmospheric interference
(SI8). Corrections were performed to convert the pixels (30 × 30 m) to top of atmosphere reflectance with the
bands utilised (corrected for sun angle)31–37. A combination of unsupervised and supervised classification within
ERDAS Imagine was used to categorise the mangrove canopy within the site (SI2). This was done separately for
Landsat 8 OLI to account for the difference in band wavelengths (SI3). The site was classified into 7 classes and
accuracy assessment was undertaken for 11 reference dates where high resolution orthorectified aerial imagery
was available (SI5). Orthorectified aerial imagery was subdivided into 30 m grid cells that corresponded with
Landsat scene pixels. Each cell was assigned to a class (SI5). Identification of cell as mangrove canopy, required
dense mangrove surface area, or at least 80% surface coverage (SI5). This study presents the mangrove canopy
classification which yielded the strongest accuracy assessment of the classes (SI5). Assessment in the form of
kappa coefficients was used to assess the level of agreement for all reference dates (SI5)38. For each scene, pixels
identified as mangrove comprised the mangrove canopy area.
Mangroves, climatic variables and the SOI. Temperature and SOI variables were accessed from the
Bureau of Meteorology (BOM) (http://www.bom.gov.au/climate/averages/tables/cw_005007.shtml). Tempera-
ture observations were recorded at Learmonth station (Latitude: − 22.24 Longitude: 114.10; Height of station
above mean sea level (metres: 5) and seasonal statistics were generated from monthly values (mean minimum,
mean maximum, lowest maximum, highest minimum). Seasonal mean SOI was generated from BOM data
(http://www.bom.gov.au/climate/enso/soi/). A GAMM analysis was utilised within the R statistical package
v.3.4.1, accessing the mgcv and MuMIn libraries to ascertain the relationship between air temperature deriva-
tives (SI1), precipitation and the SOI, with mangrove canopy area. A GAMM analysis was utilised as it can fit
both linear and non-linear responses in mixed effect models. Variables were checked for collinearity and were
not highly correlated (correlation coefficients < 0.7). Overdispersion of data was checked a priori and normality
of residuals in posthoc and neither showed significant deviation. All possible combinations of predictors were
considered. The Gaussian model was applied to the data analysis. GAMM provided a flexible robust method to
analyse the independent effects of environmental variables whilst also accounting for the temporal aspect. They
allow for complex responses due to utilising non-parametric smoothing f unctions39. Time was treated as a ran-
dom variable to account for potential temporal autocorrelation. The time variables used was year & season. The
model with the fewest variables and within 2 AICc (Akaike Information Criterion corrected for finite samples)
of the lowest AICc for all possible models was determined to be the best m odel40. A backward stepwise model
was utilised for GAMM analysis. Relative importance of each environmental variable was calculated for each
variable by summing the model weighted AICc values for all model combinations (maximum 4 variables) for
each model where the variable was i ncluded41 (Table 1; SI6). Analysis was conducted using the R language pack-
ages mgcv and MuMIn using the function ‘importance’.
Mangrove NDVI. The mangrove boundary was determined as any pixel that was classified as mangrove
from the spectral classification. Clear misclassified pixels (e.g., in water) were removed (5 pixels). The NVDI
was calculated for each Landsat scene (SI7) for this mangrove boundary. NDVI is strongly correlated to canopy
closure in mangroves (r2 = 0.91)24 and is often used as a proxy for measuring mangrove canopy condition, or
‘greenness’5,19,35–45, including in arid mangrove stands5,19,46. This is as it measures the absorbance of chlorophyll in
the red band and the reflection of the mesophyll in the near-infrared band47. Values range from − 1 to + 1, where
green vegetation corresponds to values above zero, and dense closed canopies are closer to 144. The temporal
mean NDVI for each pixel was used to provide a spatial indication of mangrove canopy condition and identify
clusters of high and low variances (standard deviation) in temporal mean NDVI to investigate any spatial pat-
terns of variance.
Received: 4 December 2020; Accepted: 25 March 2021
References
1. McPhaden, M. J. & Busalacchi, A. J. The tropical ocean-global atmosphere observing system: A Decade of progress research.
Oceans. https://doi.org/10.1029/97JC02906 (1998).
2. Osland, M. J. et al. Climatic controls on the global distribution, abundance, and species richness of mangrove forests. Ecol. Monogr.
87(2), 341–359 (2017).
3. Adame, M. F. et al. Mangroves in arid regions: Ecology, threats, and opportunities. Estuar. Coast. Shelf Sci. 1, 106796 (2020).
4. Asbridge, E. F. et al. Assessing the distribution and drivers of mangrove dieback in Kakadu National Park, Northern Australia.
Estuar. Coast. Shelf Sci. 228, 106353 (2019).
5. Lovelock, C. E. et al. Assessing the risk of carbon dioxide emissions from blue carbon ecosystems. Front. Ecol. Environ. 15(5),
257–265 (2017).
6. Spalding, M. D. et al. The role of ecosystems in coastal protection: adapting to climate change and coastal hazards. Ocean. Coast.
Manag. 90, 50–57 (2014).
7. Sippo, J. Z., Lovelock, C. E., Santos, I. R., Sanders, C. J. & Maher, D. T. Mangrove mortality in a changing climate: An overview.
Estuar. Coast. Shelf Sci. 215, 241–249 (2018).
8. Mafi-Gholami, D., Zenner, E. K., & Jaafari, A. Mangrove regional feedback to sea level rise and drought intensity at the end of the
21st century. Ecol. Indic. 110, 105972 (2020).
Scientific Reports | (2021) 11:8130 | https://doi.org/10.1038/s41598-021-87341-5 7
Vol.:(0123456789)www.nature.com/scientificreports/
9. Jump, A. S., & Penuelas J. Running to stand still: adaptation and the response of plants to rapid climate change. Ecol. Lett. 8(9),
1010–1020 (2005).
10. Jimenez, J. A., Lugo, A. E. & Cintron, G. Tree mortality in mangrove forests. Biotropica 17, 177–185 (1985).
11. Xie, S.-P. et al. Indo-western pacific ocean capacitor and coherent climate anomalies in post-ENSO summer: A review. Adv. Atmos.
Sci. 33(4), 411–432 (2016).
12. Hamlington, B. D. et al. An ongoing shift in Pacific Ocean sea level. J. Geophys/ Res. Oceans 121, 5084–5097 (2016).
13. Merrifield, M. A., Thompson, P. R. & Lander, M. Multidecadal sea level anomalies and trends in the western tropical Pacific.
Geophys. Res. Lett. 39, 2–6 (2012).
14. Godfrey, J. S. & Ridgway, K. R. The large-scale environment of the poleward-flowing Leeuwin Current, Western Australia: Long-
shore steric height gradients, wind stresses and geostrophic flow. J. Phys. Oceanogr. 15, 481–495 (1985).
15. Drexler, J. Z. & Ewel, K. C. Wetland complex linked references are available on JSTOR for this article: Effect of the 1997–1998
ENSO-related drought on hydrology and salinity in a Micronesian wetland complex. Estuaries 24, 347–356 (2001).
16. Duke, N. C. et al. Large-scale dieback of mangroves in Australia’s Gulf of Carpentaria: A severe ecosystem response, coincidental
with an unusually extreme weather event. Mar. Freshw. Res. 68(10), 1816–1829 (2017).
17. Cai, W. et al. More extreme swings of the South Pacific convergence zone due to greenhouse warming. Nature 488, 365–369 (2012).
18. Wilson, S. G., Taylor, J. G., & Pearce, A. F. The Seasonal Aggregation of Whale Sharks at Ningaloo Reef, Western Australia: Currents,
Migrations and the El Niño/Southern Oscillation. Environmental Biology of Fishes. https://idp.springer.com/authorize/c asa?redir
ect_uri=https://link.springer.com/article/10.1023/A:1011069914753&casa_token=55v4NHJmcDcAAAAA:owpASeBazqNzQzH
7Z9xJI0BOtHzNZMvjTiJHRjLGIFCWzhyiWwMvYJUU8cloH46JDWCSZ7XOhu_CZuzZ0w. (2001).
19. Lovelock, C. E., Feller, I. C., Reef, R., Hickey, S. & Ball, M. C. Mangrove dieback during fluctuating sea levels. Sci. Rep. 1, 1–8 (2017).
20. Giri, C. Observation and monitoring of mangrove forests using remote sensing: Opportunities and challenges. Remot. Sens. 8, 783
(2016).
21. Fatoyinbo, T. E., Simard, M., Washington-Allen, R. A. & Shugart, H. H. Landscape-scale extent, height, biomass, and carbon esti-
mation of Mozambique’s mangrove, forests with Landsat ETM+ and Shuttle Radar Topography Mission elevation data. J. Geophys.
Res. Biogeosci. 113, 1–13 (2008).
22. Rodriguez, W., Feller, I. C. & Cavanaugh, K. C. Spatio-temporal changes of a mangrove saltmarsh ecotone in the northeastern
coast of Florida, USA. Glob. Ecol. Conserv. 7, 245–261 (2016).
23. Bureau of Meteorology. Record-Breaking La Niña Events. Australian Government. http://www.bom.gov.au/climate/enso/histor y/
La-Nina-2010-12.pdf (2012).
24. Jensen, J. R. et al. The measurement of mangrove characteristics in southwest Florida using spot multispectral data. Geocarto Int.
6, 13–21 (1991).
25. Eslami-Andargoli, L., Dale, P., Sipe, N. & Chaseling, J. Mangrove expansion and rainfall patterns in Moreton Bay, Southeast
Queensland, Australia. Estuar. Coast. Shelf Sci. 85, 292–298 (2009).
26. Hicks, W., Fitzpatrick, R. W., & Bowman, G. (2003) Managing coastal acid sulfate soils: the East Trinity example. in Advances in
regolith: Proceedings of the CRC LEME regional regolith symposia. CRC LEME, Bentley 174–177.
27. Harris, N. L. et al. Using spatial statistics to identify emerging hot spots of forest loss. Environ. Res. Lett. 12, 024012 (2017).
28. Bryan-Brown, D. N. et al. Global trends in mangrove forest fragmentation. Sci. Rep. 10(1), 7117 (2020).
29. Hughes, T. P. et al. Spatial and temporal patterns of mass bleaching of corals in the anthropocene. Science 359(6371), 80–83 (2018).
30. Wang, H. J., Zhang, R. H., Cole, J. & Chavez, F. El Niño and the related phenomenon southern oscillation (ENSO): The largest
signal in interannual climate variation. Proc. Natl. Acad. Sci. USA. 96(20), 11071–11072 (1999).
31. Berg, A. et al. Land-atmosphere feedbacks amplify aridity increase over land under global warming. Nat. Clim. Chang. 6, 869–874
(2016).
32. Perry, S. J., McGregor, S., Gupta, A. S. & England, M. H. Future changes to El Niño-southern oscillation temperature and precipita-
tion teleconnections. Geophys. Res. Lett. 44(20), 10608–10616 (2017).
33. Osland, M. J. et al. Beyond just sea-level rise: Considering macroclimatic drivers within coastal wetland vulnerability assessments
to climate change. Glob. Change Biol. 22, 1–11 (2016).
34. Jentsch, A. & Beierkuhnlein, C. Research frontiers in climate change: Effects of extreme meteorological events on ecosystems. C.R.
Geosci. 340, 621–628 (2008).
35. Chander, G., Markham, B. L. & Helder, D. L. Summary of current radiometric calibration coefficients for Landsat MSS, TM, ETM+,
and EO-1 ALI sensors. Remote Sens. Environ. 113, 893–903 (2009).
36. Landsat 7 (L7) Data Users Handbook. USGS. https://prd-wret.s3.us-west-2.amazonaws.com/assets/palladium/production/atoms/
files/LSDS-1927_L7_Data_Users_Handbook-v2.pdf. (2009).
37. Landsat 8 (L8) Data Users Handbook. USGS. https://prd-wret.s3.us-west-2.amazonaws.com/assets/palladium/production/atoms/
files/LSDS-1574_L8_Data_Users_Handbook-v5.0.pdf. (2009).
38. Story, M. & Congalton, R. G. Accuracy assessment: A user’s perspective. Photogramm. Eng. Remote. Sens. 52, 397–399 (1986).
39. Moore, C. et al. Improving essential fish habitat designation to support sustainable ecosystem-based fisheries management. Mar.
Policy 69, 32–41 (2016).
40. Burnham, K. P., & Anderson, R. A practical information-theoretic approach. in Model Selection and Multimodel Inference 2. http://
sutlib2.sut.ac.th/sut_contents/H79182.pdf.
41. Burnham, K. P., & Anderson, D. R. Practical use of the information-theoretic approach. in Model Selection and Inference: A Practical
Information-Theoretic Approach (eds. Burnham K. P. & Anderson D. R.) 75–117 (New York, NY, Springer, 1998).
42. Cornforth, W. A., Fatoyinbo, T. E., Freemantle, T. P. & Pettorelli, N. Advanced land observing satellite phased array type L-Band
SAR (ALOS PALSAR) to inform the conservation of mangroves: Sundarbans as a case study. Remot. Sens. 5, 224–237 (2013).
43. Giri, C., Pengra, B., Zhu, Z., Singh, A. & Tieszen, L. L. Monitoring mangrove forest dynamics of the Sundarbans in Bangladesh
and India using multi-temporal satellite data from 1973 to 2000. Estuar. Coast. Shelf Sci. 73, 91–100 (2007).
44. Long, J., Giri, C., Primavera, J. & Trivedi, M. Damage and recovery assessment of the Philippines ’ mangroves following Super
Typhoon Haiyan. MPB 109, 734–743 (2016).
45. Satyanarayana, B., Mohamad, K. A., Idris, I. F., Husain, M.-L. & Dahdouh-Guebas, F. Assessment of mangrove vegetation based
on remote sensing and ground-truth measurements at Tumpat, Kelantan Delta, East Coast of Peninsular Malaysia. Int. J. Remot.
Sens. 32, 1635–1650 (2011).
46. Almahasheer, H., Aljowair, A., Duarte, C. M. & Irigoien, X. Decadal stability of red sea mangroves. Estuar. Coast. Shelf Sci. 169,
164–172 (2016).
47. Pettorelli, N. et al. Using the satellite-derived NDVI to assess ecological responses to environmental change. Trends Ecol. Evol. 20,
503–510 (2005).
Acknowledgements
BR and SH undertook the research as part of the ICoAST collaborative project and acknowledge support from
the Indian Ocean Marine Institute Research Centre collaborative research fund and partner organisations AIMS,
CSIRO, DPIRD and UWA.
Scientific Reports | (2021) 11:8130 | https://doi.org/10.1038/s41598-021-87341-5 8
Vol:.(1234567890)www.nature.com/scientificreports/
Competing interest
The authors declare no competing interests.
Additional information
Supplementary Information The online version contains supplementary material available at https://doi.org/
10.1038/s41598-021-87341-5.
Correspondence and requests for materials should be addressed to S.M.H.
Reprints and permissions information is available at www.nature.com/reprints.
Publisher’s note Springer Nature remains neutral with regard to jurisdictional claims in published maps and
institutional affiliations.
Open Access This article is licensed under a Creative Commons Attribution 4.0 International
License, which permits use, sharing, adaptation, distribution and reproduction in any medium or
format, as long as you give appropriate credit to the original author(s) and the source, provide a link to the
Creative Commons licence, and indicate if changes were made. The images or other third party material in this
article are included in the article’s Creative Commons licence, unless indicated otherwise in a credit line to the
material. If material is not included in the article’s Creative Commons licence and your intended use is not
permitted by statutory regulation or exceeds the permitted use, you will need to obtain permission directly from
the copyright holder. To view a copy of this licence, visit http://creativecommons.org/licenses/by/4.0/.
© The Author(s) 2021
Scientific Reports | (2021) 11:8130 | https://doi.org/10.1038/s41598-021-87341-5 9
Vol.:(0123456789)You can also read


