2017: ANOTHER RECORD-BREAKING YEAR FOR HEAT AND EXTREME WEATHER - CLIMATECOUNCIL.ORG.AU
←
→
Page content transcription
If your browser does not render page correctly, please read the page content below
2017: ANOTHER
RECORD-BREAKING
YEAR FOR HEAT AND
EXTREME WEATHER

CLIMATECOUNCIL.ORG.AU
Thank you for
supporting the
Climate Council.
The Climate Council is an independent, crowd-funded organisation
providing quality information on climate change to the Australian public.

    Published by the Climate Council of Australia Limited
    ISBN:    978-1-925573-46-6 (print)
             978-1-925573-47-3 (web)
    © Climate Council of Australia Ltd 2018
                                                                                   Professor Will Steffen
    This work is copyright the Climate Council of Australia Ltd. All material
                                                                                   Climate Councillor
    contained in this work is copyright the Climate Council of Australia Ltd
    except where a third party source is indicated.
    Climate Council of Australia Ltd copyright material is licensed under the
    Creative Commons Attribution 3.0 Australia License. To view a copy of this
    license visit http://creativecommons.org.au.
    You are free to copy, communicate and adapt the Climate Council of Australia
    Ltd copyright material so long as you attribute the Climate Council of
    Australia Ltd and the authors in the following manner:
                                                                                   Dr. Martin Rice
    2017: Another record-breaking year for heat and extreme weather
    Authors: Professor Will Steffen, Dr. Martin Rice and Dr. David Alexander.
                                                                                   Head of Research,
                                                                                   Climate Council

    —
    Image credit: Cover photo “Big Sun on sunset. Nature composition.” (ID:
    131341742) copyright by djgis.
    This report is printed on 100% recycled paper.

                                                                                   Dr. David Alexander
                                                                                   Researcher
         facebook.com/climatecouncil                 info@climatecouncil.org.au

         twitter.com/climatecouncil                  climatecouncil.org.au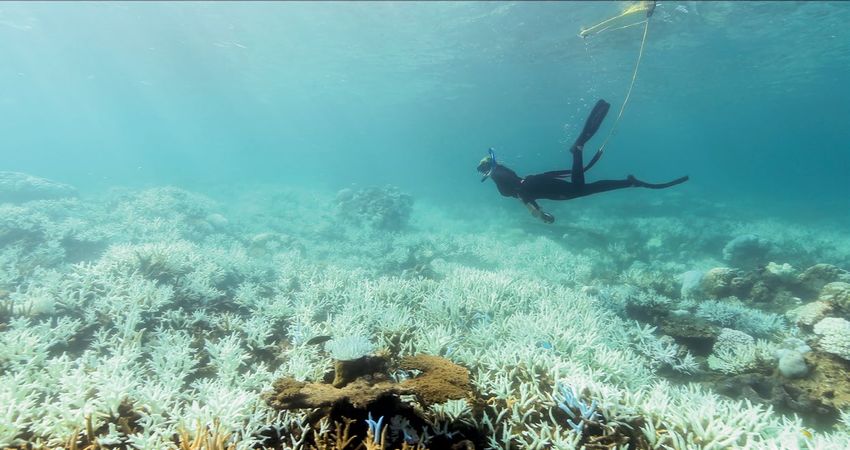
CLIMATE COUNCIL                      i

Contents
Key Findings..................................................................................................................................................................................... ii

1.     Introduction...............................................................................................................................................................................1

2.     Global Heat Records in 2017................................................................................................................................................. 4

3.     Australian Heat Records Broken in 2017................................................................................................................................7

4.     Consequences of 2017 Record Heat: Impacts of Extreme Weather Globally....................................................... 10

5.     Impacts of Extreme Weather in Australia in 2017 ....................................................................................................... 12

       5.1 Heat-related Extreme Weather                                                                                                                                                         13
              5.1.1 Heatwaves                                                                                                                                                                   13
              5.1.2 Bushfires                                                                                                                                                                   15
       5.2 Impacts on Ecosystems                                                                                                                                                                16
       5.3 Tropical Cyclones                                                                                                                                                                    17

6.     The Window of Opportunity to Tackle Climate Change is Closing....................................................................... 18

References....................................................................................................................................................................................... 20

Image Credits................................................................................................................................................................................. 22
ii   2017:
     ANOTHER RECORD-BREAKING YEAR FOR HEAT AND EXTREME WEATHER

     Key Findings
     1            2
     The four hottest years on record are 2016, 2015,        Temperature records toppled across Australia
     2017 and 2014, continuing the strong, long-             through 2017.
     term upswing in global temperatures.
                                                             ›› 2017 was Australia’s third warmest year on record.
     ›› The 2013-2017 period has been the hottest five-
        year period ever recorded.                           ›› Seven of the ten hottest years on record in
                                                                Australia have happened since 2005. Five of the
     ›› 2017 was the third hottest year ever recorded, and      seven have occurred the past five years.
        was the hottest year where the temperature was
        not boosted by an El Niño event.                     ›› 2017 broke records for hot, dry conditions with
                                                                more than 260 heat and low rainfall records broken
     ›› The world’s 10 hottest years on record have all         throughout winter.
        occurred since 1998 and 17 of the 18 hottest years
        on record have occurred this century.                ›› Many remarkable records were set across Australia
                                                                in 2017. In the summer, Moree had 54 consecutive
                                                                days of 35°C or above. In autumn, Launceston
                                                                experienced its warmest night on record on
                                                                16 March. Queensland, Western Australia and
                                                                the Northern Territory had their highest winter
                                                                average maximum temperatures on record. Cape
                                                                Jaffa in South Australia experienced its highest
                                                                spring mean daily temperature on record.

                                                             ›› Oceans around Australia also experienced record
                                                                breaking heatwaves, with high sea surface
                                                                temperatures contributing to mass coral bleaching
                                                                on the Great Barrier Reef in early 2017.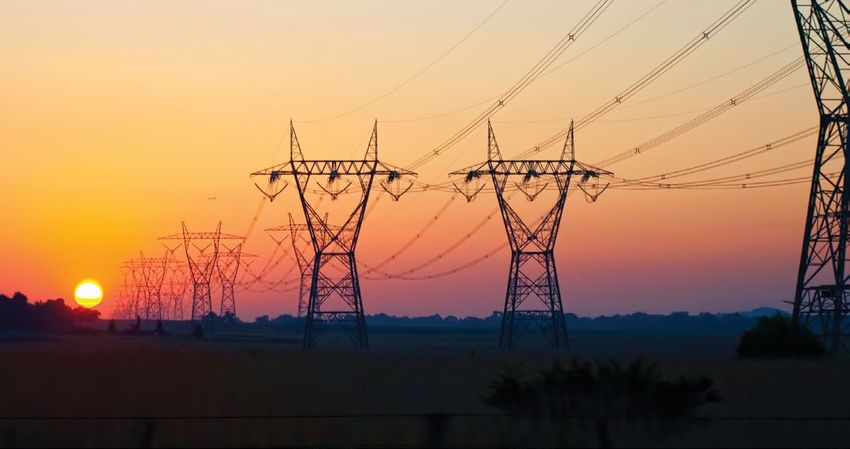
KEY FINDINGS   iii

3
The increasing global heat, driven primarily
by the burning of fossil fuels, exacerbated
extreme weather events around the globe and
in Australia in 2017.

›› Floods: Massive flooding in South Asia took over a
   thousand lives.

›› Fires: Forests across southern Europe and in
   California were devastated by wildfires. NSW
   experienced an early start to the bushfire season.

›› Cyclones: A series of destructive tropical cyclones
   swept across the Caribbean and southern US
   with some of the most intense rainfall and winds
   ever recorded. Tropical Cyclone Debbie struck
   Queensland and NSW causing power losses to
   homes and the evacuation of thousands as storms
   brought heavy rainfall and mass flooding. At least
   five Australians died, and the damage bill is an
   estimated $2 billion.

›› Heat: During a February 2017 heatwave nearly 100
   bushfires in New South Wales destroyed at least
   30 homes. This same severe heatwave caused
   problems for the South Australian and New South
   Wales energy systems.

                                                         climatecouncil.org.au
1 2017:
ANOTHER RECORD-BREAKING YEAR FOR HEAT AND EXTREME WEATHER
1. Introduction
More record-breaking heat was In fact, 2013-2017 was the hottest five-year
experienced around the world in period on record (NOAA 2018a; Figure 1).
2017, with the year joining 2014, 2015 This recent record heat is part of a long-term
and 2016 as the four hottest years global warming trend that began most clearly
ever recorded in the 138-year global in the mid-20th century and has continued
temperature archive. unabated since then. The world’s 10 hottest
years on record have all occurred since 1998
and 17 of the 18 hottest years on record have
occurred this century.
Figure 1: Global Land-Ocean Temperature Index, from 1880 to present, using 1951-1980 as a baseline period. The average
temperature of both hot and cold years has risen rapidly since the 1970s.
GLOBAL LAND−OCEAN TEMPERATURE INDEX
1.0
‘Hot’ years warming
.8
Annual Mean
5−year Running Mean
.6
Temperature Anomaly (°C)
.4
.2
0.
−.2
‘Cold’ years warming
−.4
1880 1900 1920 1940 1960 1980 2000
Source: Adapted from NASA 2018.CHAPTER 01 2
INTRODUCTION
The last five-year period has been the
hottest such period ever recorded.
Australia experienced its third hottest year Globally, intense monsoonal rains and
on record in 2017. The ‘Angry Summer’ of consequent flooding in South Asia led to
2016-17 broke more than 205 climate records more than 1,200 deaths and left 40 million
across the nation, and included several people displaced or affected. Within one
intense heatwaves in January and February. month, a series of powerful, damaging
In winter, over 260 records were broken once hurricanes—Harvey, Irma and Maria – tore
again across the country, with the winter through the Caribbean and southern United
of 2017 the hottest on record for maximum States, leading to some of the most intense
temperatures. Low rainfall records were also rainfall and winds ever recorded. Heavy
broken throughout the season, resulting, rains in Peru led to landslides leaving 75
along with the high temperatures, in an early people dead and making tens of thousands
start to the bushfire season across much of homeless. Meanwhile, wildfires brought
New South Wales. Oceans around Australia on by extreme heat and drought caused
recorded temperatures well above average devastation across the Mediterranean, with
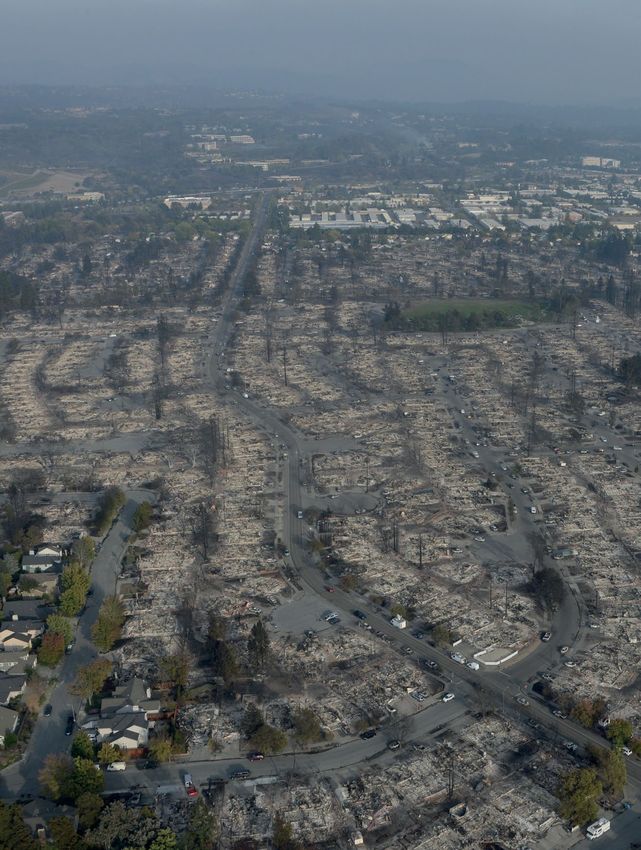
through the year. Portugal worst hit. California was also hit by
wildfires in October and December, leaving a
The ongoing, long-term trend of record- trail of devastation across the state (Figure 2).
breaking heat is increasing the frequency
and destructiveness of many extreme The record-breaking heat and its associated
weather events, with devastating impacts in impacts are amongst the most prominent
Australia and elsewhere around the world. fingerprints of climate change and are
Early in 2017, the Great Barrier Reef suffered primarily caused by the human emission
its second consecutive mass bleaching of carbon dioxide from the burning of
event as a result of prolonged high sea coal, oil and gas. Carbon dioxide and other
surface temperatures, while later in the year, greenhouse gases trap additional heat at the
Queensland and northern New South Wales Earth’s surface and in the lower atmosphere,
experienced record high May-September driving the trends of increasing heat and
forest fire danger index values. worsening extreme weather. Human-
driven greenhouse gas pollution has been
rising strongly since the mid-20th century.
Rapid and deep reductions in the level of
greenhouse gas pollution is the only way to
slow and eventually halt the strong upward
trend in global temperature and the trend
towards more frequent and intense extreme
weather events.Figure 2: Santa Rosa, California, devastated by wildfires in October 2017.
CHAPTER 02                   4
                                                                                                        GLOBAL HEAT RECORDS IN 2017

2. Global Heat
   Records in 2017
                     Global average temperature for 2017 was                         Although 2017 was the third hottest year
                     0.84°C* warmer than the 20th century                            globally, it was the hottest year on record in
                     average (NOAA 2018a), equivalent to                             which the temperature was not boosted by
                     an approximately 1°C temperature rise                           an El Niño event (Box 1). Both 2015 and 2016,
                     since the pre-industrial period. It was                         the only years with higher global average
                     the third hottest year globally. Together                       temperature than 2017, were influenced by
                     with 2014, 2015 and 2016, 2017 was one                          an exceptionally strong El Niño event that
                     of the four hottest years ever recorded                         straddled the two years. 2017 was much
                     in the 138-year global temperature                              warmer than the previous non-El Niño year
                     archive. The average global temperature                         of 2014, and was also much warmer than
                     for the 2013-2017 period was the highest                        recent El Niño-boosted years, such as 2010,
                     recorded for any five-year period (NOAA                         2003 and 1998 (Figure 3), reflecting the
                     2018a). The world’s 10 hottest years on                         dominance of the long-term warming trend
                     record have all occurred since 1998 and                         associated with climate change.
                     17 of the 18 hottest years on record have
                     occurred this century (NOAA 2018a).

17 of the 18 hottest years have
occurred this century.

* Temperature data in this report are based on the National Oceanic and Atmospheric Administration (NOAA) data, from the US. For more information
regarding the data, please refer to the official NOAA website: www.noaa.gov
5 2017:
ANOTHER RECORD-BREAKING YEAR FOR HEAT AND EXTREME WEATHER
BOX 1: THE EL NIÑO CONNECTION
The long-term trend since the mid-20th (BoM definition, taken from BoM website). In
century of increasing global temperatures addition to drier conditions in the east, El Niño
is undeniably driven primarily by events usually bring (i) warmer temperatures, (ii)
greenhouse gas pollution from human increased fire danger in the southeast and (iii)
activities, but from year-to-year, modes of reduced tropical cyclone numbers to Australia.
natural variability can add tweaks to the
long-term trend. One of the most important Globally, an El Niño event provides an extra boost
modes of variability is the El Niño- to the global average temperature, typically around
Southern Oscillation (ENSO) phenomenon. 0.1 – 0.2°C (Trenberth et al. 2002; Foster and
Rahmstorf 2011). El Niño years stand out as being
The El Niño phase of ENSO refers to the extensive somewhat warmer than the years around them,
warming of the central and eastern Pacific Ocean and, conversely, La Niña years (the opposite phase
that leads to a major shift in weather patterns of ENSO to El Niño) are somewhat cooler (Figure 3),
across the Pacific. In Australia, particularly but they do not alter the long-term, multi-decadal
eastern Australia, El Niño events are associated global warming trend.
with an increased probability of drier conditions
Figure 3: Global temperature anomalies relative to the 1981–2010 average, showing El Niño, Neutral and La Niña years.
2017 - THE WARMEST NON-EL NIÑO YEAR ON RECORD
El Niño
0.6
Neutral
La Niña
Anomaly relative to 1981–2010 (°C)
0.4
0.2
0
-0.2
-0.4
Weak then strong El Niño
conditions held through 2015
-0.6
1950 1960 1970 1980 1990 2000 2010
Year
Note: 2017 data point shows global mean temperature for the period January to September 2017 (0.47°±0.08°C
warmer than the 1981-2010 average).
Source: Adapted from WMO 2017.CHAPTER 02 6
GLOBAL HEAT RECORDS IN 2017
Global temperature records tumbled yet
again in 2017. Here are some examples:
›› Hong Kong experienced its warmest
January on record (NOAA 2017a).
›› Germany, France and Austria had their
warmest March on record (NOAA 2017b).
›› May, June and July temperatures were the
hottest on record in Africa (NOAA 2017c,
2017d, 2017e).
›› Austria recorded a new May national
maximum temperature on 30 May 2017,
when temperatures reached 35°C (NOAA
2017c).
›› The July 2017 global land temperature was
the highest on record, 1.2°C above the 20th
century average of 14.3°C (NOAA 2017e).
›› The Kingdom of Bahrain had its warmest
July since records began in 1902, with a
national temperature of 36.9°C (3°C above
average) (NOAA 2017e).
›› Portugal had its highest October
temperature on record (NOAA 2017f).
›› Alaska had its warmest December on
record (NOAA 2018b).7 2017:
ANOTHER RECORD-BREAKING YEAR FOR HEAT AND EXTREME WEATHER
3. Australian Heat
Records Broken in 2017
2017 continued a long trend of Rainfall was a somewhat different story
increasing heat, ‘angry summers’ through 2017, with very dry conditions through
and smashed weather records across the middle of the year, but wetter conditions
Australia. The country experienced during the last quarter of the year. June 2017
its third warmest year on record; the was the second driest June on record, while
annual average temperature across September was the driest on record for the
the continent was 0.95°C warmer than Murray-Darling Basin.
the 1961-1990 average (BoM 2018). The
maximum temperatures across the The records listed below are referenced against
country were the second highest on the 1961–1990 average, and are sourced from
record. Oceans around Australia also BoM’s climate archives (http://www.bom.gov.
recorded temperatures through 2017 au/climate/current/statement_archives.shtml).
that were well above average.CHAPTER 03 8
AUSTRALIAN HEAT RECORDS BROKEN IN 2017
Summer Autumn
›› Sydney and Brisbane had their hottest ›› Mean maximum temperatures were very
summers on record. much above average (+1.21°C) for Australia,
the seventh warmest autumn on record.
›› Canberra experienced its warmest
summer on record for daytime ›› March was an exceptionally warm
temperatures. month. The national mean temperature
was the third highest on record, 1.66°C
›› January and February heatwaves caused above average, while the national mean
record hot days and nights for southern maximum temperature was 1.87°C above
Queensland and northern to eastern New average, the second warmest on record for
South Wales. March.
›› Moree had 54 consecutive days of 35°C or ›› Mean maximum temperatures were the
above, a new record for New South Wales. warmest on record for autumn for parts
of western Queensland and the Northern
›› On 11 February the state-wide New South Territory.
Wales average maximum temperature
reached 44°C, the hottest February day on ›› Launceston (37 years of record) had its
record. warmest night (highest daily minimum
temperature) on record on 16 March.
›› Both Moorabbin and Laverton (outer
suburbs of Melbourne) experienced their ›› On 26 March, five locations in South
hottest January night on record on the 8th. Australia experienced their highest
autumn temperature on record - Tarcoola
Aero (44°C), Nullarbor (43.4°C), Woomera
Aerodrome (43°C), Minnipa Pirsa (42.4°C)
and Coulta (Coles Point) (40.6°C).9 2017:
ANOTHER RECORD-BREAKING YEAR FOR HEAT AND EXTREME WEATHER
Winter Spring
›› Australia had its warmest winter on record ›› Spring was the sixth-warmest on record
for average maximum temperatures, for national average temperatures.
reaching nearly 2°C above average.
›› 22 September was the hottest September
›› Australia had its fifth warmest winter on day experienced in Australia since records
record for average temperatures. began, with a temperature of 33.47°C,
more than six degrees warmer than the
›› Queensland, Western Australia and the September average.
Northern Territory had their highest
winter average maximum temperatures ›› High temperature records for September
on record. were set in Victoria, New South Wales and
Queensland.
›› Winter days were the second-warmest on
record for South Australia and the third ›› Melbourne had a record 15 days of 30°C or
warmest for New South Wales. more during spring.
›› Cape Jaffa in South Australia experienced
its highest spring mean daily temperature
on record (37.4 °C).
›› Derby Aerodrome in Western Australia had
a record high spring temperature of 44.8°C
on 30 October.CHAPTER 04 10
CONSEQUENCES OF 2017 RECORD HEAT: IMPACTS OF EXTREME WEATHER GLOBALLY
4. Consequences of
2017 Record Heat:
Impacts of Extreme
Weather Globally
Extreme weather has had devastating The increasing global heat associated with
impacts across all areas of the world in climate change is now influencing all
2017—from intense monsoonal rains extreme weather events, because all extreme
and consequent flooding in South Asia, weather events are now occurring in a more
to powerful hurricanes striking the energetic climate system with a hotter,
Caribbean and the southern United moister atmosphere (Trenberth 2012). Many
States, while wildfires caused numerous extreme weather events, such as heatwaves,
fatalities and destruction across bushfires and coastal flooding are occurring
southern Europe and California. Figure more frequently and becoming more
4 provides an overview of some of the damaging. 2017 provided more evidence of
major extreme weather events of 2017. the increasing impacts and risks that climate
change is driving for our health and well-
being, our livelihoods and economies, and
for the natural world.
Climate change is now influencing
all extreme weather events.Figure 4: Global overview of some of the major extreme weather events of 2017.
MAJOR EXTREME
WEATHER EVENTS 2017 IN
ITALY TEXAS, U.S.
Hurricane Harvey
Drought
Prolonged extreme rainfall and flooding,
Record-breaking heat
including the single largest rainfall event
and well below average
recorded on the mainland.
rainfall resulted in less
agricultural productivity. $125 billion in damages (NOAA 2018c).
PORTUGAL NORTHERN CALIFORNIA, U.S. CARRIBEAN & U.S.
Wildfires Wildfires Hurricane Irma
64 deaths during a High-intensity fires Winds of 300 km/h and
major fire, exacerbated with the most number three consecutive days as
by extreme heat and of deaths (41) in the a Category 5 hurricane.
drought. U.S. since 1918. 72 deaths (Phys.Org 2017)
and $50 billion in
damages (NOAA 2018c).
SOMALIA
PERU
Drought
Flooding
More than 50% of
cropland affected, 75 people died and
number of people on 70,000 were left
brink of famine is homeless after severe
800,000. flooding.
SOUTH ASIA AUSTRALIA CHILE
Extreme monsoonal Extreme heat Heatwaves
rains and flooding Scorching temperatures Many areas had their highest
1,200+ deaths, occurred in NSW in January temperatures on record,
40 million+ people February, reaching including Santiago (37.4°C).
displaced or affected. 47°C in some parts. The hot, dry conditions caused
massive wildfires, burning
homes and forests (Reuters 2017).
Source: Based on information presented in WMO 2017, unless otherwise stated.CHAPTER 05 12
IMPACTS OF EXTREME WEATHER IN AUSTRALIA IN 2017
5. Impacts of Extreme
Weather in Australia
in 2017
In Australia, extreme weather events
in 2017 drove serious impacts. This For more details about the
section explores these impacts. influence of climate change
on extreme weather events
and the escalating impacts
and risks, please refer to
the Climate Council report:
Cranking Up The Intensity:
Climate Change and
Extreme Weather Events.
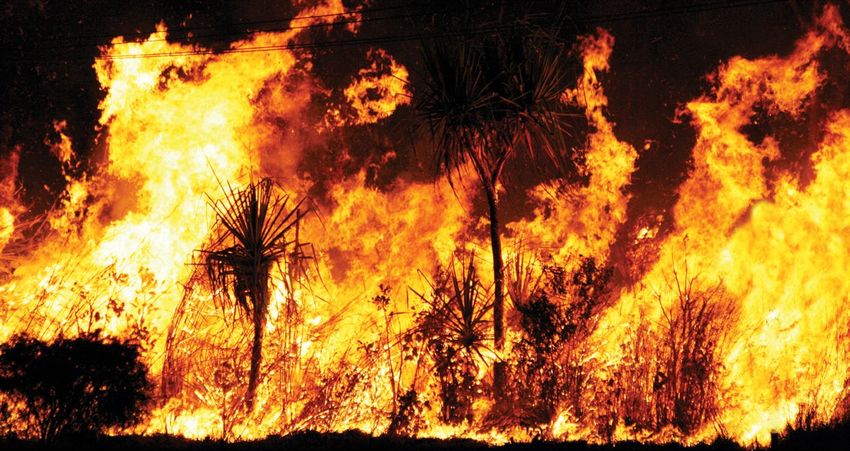
Figure 5: Bushfires in southeast Australia have become more frequent and dangerous due to climate change.13 2017:
ANOTHER RECORD-BREAKING YEAR FOR HEAT AND EXTREME WEATHER
5.1 Heat-related Extreme Weather
5.1.1 Heatwaves
Extreme heat is a serious health threat for Extreme heat increases the risk of heat-
many Australians, often called the silent related illness and can also exacerbate pre-
killer. Major heatwaves have caused more existing conditions – children, the elderly
deaths since 1890 than bushfires, cyclones, and outdoor workers are most at risk (ABS
earthquakes, floods and severe storms 2015; Watts et al. 2015). Australia’s mortality
combined (DIT 2013; Coates et al. 2014). data indicate that over the past four decades
Longer, hotter and more intense heatwaves there has been a steady increase in the
in Australia are being driven by climate number of deaths in summer compared
change. For example, since 1960, the number to those in winter, suggesting that climate
of record hot days has doubled (Perkins and change may already be affecting mortality
Alexander 2013; Cowan et al. 2014). rates (Bennett et al. 2013). Extreme heatwaves
led to a 10% increase in both deaths and
ambulance callouts in New South Wales from
2005 to 2015 (Jegasothy et al. 2017).
Figure 6: Power pylons in southeast Australia – climate change is worsening extreme weather including heatwaves and is
increasing the vulnerability of energy systems to blackouts.CHAPTER 05 14
IMPACTS OF EXTREME WEATHER IN AUSTRALIA IN 2017
The most severe heatwave of last summer Several days later on 10 February, New South
was in southeast Australia, which Wales experienced the same heatwave with
experienced daytime temperatures over temperatures at Sydney Airport reaching
40°C. The highest temperatures recorded 42.9°C, its hottest February temperature on
were 48.2°C on 9 February at Tarcoola, South record (BoM 2017d). With near record all-time
Australia, followed by 47.9 °C on 12 February peak electricity demand, the state narrowly
at Walgett, New South Wales (BoM 2017a). avoided widespread blackouts. Imports of
This heatwave was made twice as likely to electricity via three interconnections with
occur because of climate change (Perkins- Victoria and Queensland ran above design
Kirkpatrick et al. 2017), while the extreme heat limits, contributing 12% to meeting peak
in New South Wales over the entire summer demand (AEMO 2017). Around 3000MW
season was at least 50 times as likely to occur of fossil fuel plant was not available due
because of climate change (King et al. 2017). to: tripping off (400MW), unable to start
(760MW), out for maintenance (1000MW)
The same severe heatwave in early February or output limited due to cooling water
2017 caused issues for the South Australian limits (600MW). At one stage, the Tomago
and New South Wales energy systems. In aluminium smelter shed 580 MW of load.
South Australia, 40,000 people were left It was this, and careful use by consumers,
without power for about half an hour in the saving 200MW, that allowed New South
early evening 8 February while temperatures Wales to avoid widespread blackouts.
were over 40°C. The highest temperature in
South Australia recorded on 8 February was This heatwave in February 2017 highlights
at Moomba where the daytime maximum the vulnerability of our energy systems to
reached 46.6°C at Moomba Airport, while extreme weather. Climate change is making
Adelaide reached a high of 42.4°C (BoM heatwaves longer, hotter and more frequent,
2017b, c). This extreme summer heat placed increasing stresses on Australia’s ageing
the energy system under great pressure energy infrastructure.
(despite energy supply being available).15 2017:
ANOTHER RECORD-BREAKING YEAR FOR HEAT AND EXTREME WEATHER
5.1.2 Bushfires
Climate change is increasing the likelihood Hot weather, combined with very dry
of dangerous bushfire weather, particularly conditions in New South Wales and the
in the southwest and southeast of Australia. Australian Capital Territory, led to tinderbox
As temperatures continue to rise, climate fire conditions in January and February
change is lengthening the fire season, which 2017. During the February heatwave, nearly
now extends well beyond summer, into 100 bushfires were raging simultaneously in
October and March, in many regions (Clarke New South Wales (BBC 2017), and destroyed
et al. 2013). Analysis of global climate data at least 30 homes (ABC 2017a). Meanwhile
has shown that the frequency of long fire in Victoria, 40 fires were burning in mid-
weather seasons has increased in eastern January with temperatures across much of
Australia (VIC, NSW, ACT and QLD) - where Victoria exceeding 40°C (News Limited 2017).
around 77% of the population live (ABS 2015;
Jolly et al. 2015). Dangerous bushfire weather is becoming
more common in the south and east of
Australia (CSIRO and BoM 2016), and climate
change is projected to lead to harsher fire
weather in the southeast of Australia over the
coming decades (CSIRO and BoM 2015).
Southwest and southeast Australia
is facing increasingly dangerous
bushfire seasons because of
intensifying climate change.CHAPTER 05 16
IMPACTS OF EXTREME WEATHER IN AUSTRALIA IN 2017
5.2 Impacts on Ecosystems
Ecosystems suffer severe impacts from heat- The severe summer heat in 2017 has also
related extreme weather. affected terrestrial wildlife such as flying
foxes, which are particularly susceptible
The Great Barrier Reef experienced its worst to extreme heat events. Exposure to air
ever bleaching event in 2016 (Figure 7) temperatures over 40°C can lead to heat
resulting in the mortality of two-thirds of the stress and death from dehydration, especially
coral in the pristine, northern sector. Warmer when very hot conditions are accompanied
than average sea surface temperatures off by dry weather (Climate Council 2017a). The
the Queensland east coast again triggered February 2017 heatwave caused thousands of
another bleaching event in 2017, with further flying fox deaths across southeast Australia.
consequences for the reef’s health. The The worst affected areas were in northern
Great Barrier Reef employs around 70,000 New South Wales, where more than 2,000
people (Deloitte Access Economics 2013) and flying foxes died (ABC 2017b).
contributes around $7 billion to the national
economy annually (Jacobs 2016), so the loss
in tourism as a result of coral bleaching could
be dire for the region.
Figure 7: After the Great Barrier Reef’s worst mass bleaching event in its history in 2016, above-average sea surface
temperatures in summer 2017 triggered a second year of bleaching (photo of bleaching near Port Douglas).17 2017:
ANOTHER RECORD-BREAKING YEAR FOR HEAT AND EXTREME WEATHER
5.3 Tropical Cyclones
Category-four Tropical Cyclone Debbie The most direct influence of climate change
struck Northern Queensland in late March on the impacts of tropical cyclones is via
2017 before tracking slowly down into coastal flooding. Typically, the damage from
southern Queensland and northern NSW tropical cyclones comes from: (i) excessively
as an ex-tropical cyclone. This event caused high winds that directly damage built
the loss of power to tens of thousands of infrastructure and the natural environment;
homes and the evacuation of thousands as and (ii) coastal flooding caused by a storm
powerful storms brought heavy rainfall and surge and by the heavy rainfall that often
mass flooding. At least five Australians died accompanies the storm (Climate Council
and damages are estimated at $2 billion (The 2017b).
Guardian 2017).
Cyclone Debbie is a tragic reminder of how
Trends in tropical cyclone frequency extreme weather events place lives, property
and intensity are difficult to discern for and critical infrastructure at risk. Climate
the Australian region due to the short change is intensifying many extreme
observational records, as well as high year-to- weather events in an atmosphere that is
year variability. However, where a long record warmer and wetter because of increasing
of reliable data exists, some trends have greenhouse gas emissions from human
been identified in tropical cyclone activity in activities, primarily the burning of fossil fuels
the past few decades, such as a statistically – coal, oil and gas.
significant increase in intense cyclone
activity in the North Atlantic region since the
1970s (Kossin et al. 2007; IPCC 2013).
Climate change is worsening many
extreme weather events, risking the
lives and livelihoods of Australians.CHAPTER 06 18
THE WINDOW OF OPPORTUNITY TO TACKLE CLIMATE CHANGE IS CLOSING
6. The Window of
Opportunity to
Tackle Climate
Change is Closing
The 2017 global heat and its associated target, global greenhouse gas pollution
impacts are yet another reminder of must have peaked by 2020 and we need to
the urgency of the challenge to reduce reach net-zero emissions in about 25 years
emissions. Furthermore, 2018 started (Figure 8). Delaying peak emissions to 2025
with more climate disruption. would leave too little time to transform the
economy; the world would be locked into a
On 7 January 2018, Sydney was the hottest very dangerous future (Figueres et al. 2017;
city on Earth over a 24-hour period with the Rockström et al. 2017).
temperature at the western suburb of Penrith
reaching 47.3°C (ABC 2018). In the northern While the greenhouse gas pollution from
hemisphere, the ongoing exceptional heating most of our closest allies’—the United States,
around the north pole – twice the global European Union and the United Kingdom—
average – is breaking down circumpolar air are trending downwards, Australia’s
flows that normally keep the cold air around emissions have been rising steadily since
the north pole and more temperate air to the March 2015 (Australia Government 2017a).
south (Mann 2017; Mann 2018). As Sydney We have rapidly become the global laggard
was sweltering, icy polar air was penetrating on climate change. Indeed, Australia holds
as far south as Florida while unusually the embarrassing title of being the fourth
warm conditions were experienced north of worst country out of 57 ranked nations on
Finland (SMH 2018). tackling climate change, only ahead of Iran,
the Republic of Korea and Saudi Arabia
Tackling climate change is urgent. There (Germanwatch 2017). Furthermore, without
is no time to lose if we are to meet the a policy to reduce emissions and a pathway
Paris Agreement goal of limiting global to do so, it is unlikely that Australia will meet
temperature rise to no more than 2°C above its 2030 emission reduction target (UNEP
pre-industrial levels, and prevent worsening 2017; Australian Government 2017b), which is
extreme weather and other escalating already well below what is necessary to tackle
risks of climate change. To meet the 2°C climate change (CCA 2015).19 2017:
ANOTHER RECORD-BREAKING YEAR FOR HEAT AND EXTREME WEATHER
Figure 8: Emission reduction trajectories for meeting the Paris target(s). The year of peak emissions has an enormous effect
on the steepness of the subsequent trajectory. Delaying peak emissions to 2025 is too late for any achievable emission
reduction trajectory.
50 Peaking emissions now Delaying the peak by a
will give us 25 years to 2020 2025 decade gives too little time
reduce emissions to zero. 2016 to transform the economy.
40
CO2 emissions (Gt per year)
30
Historical emissions*
20 600-Gt carbon budget
2016 peak (best)
2020
10 2025
800-Gt carbon budget
2020 peak
0
1990 2000 2010 2020 2030 2040 2050
Source: Figueres et al. 2017.
But there is hope. States, territories, local and aims to reach net-zero emissions in its
councils and individuals are taking the lead. entire economy by 2050 at the latest (Climate
Australia is a world leader in the uptake Council 2017b). Such action at the state level
of household solar with nearly 1.7 million shows that meeting the climate change
systems installed, and industrial-scale solar challenge is possible.
systems are being rolled out at an increasing
rate. Wind energy is becoming a major The many heat-related records of 2017 are
source of electricity in Australia’s populous yet another reminder that the task of dealing
southeast. South Australia already generates effectively with climate change is urgent.
nearly 50% of its electricity from renewables The solutions to the challenge are appearing
(Climate Council 2017b), and is moving rapidly and the pathway to a prosperous,
forward on solar thermal and energy storage carbon-neutral society is becoming clearer.
technologies, including the commissioning What we now need at the national level is
of the world’s largest lithium-ion battery leadership, a clear vision for tackling climate
in December 2017. The Australian Capital change, and coherent policies for getting the
Territory will be 100% renewable by 2020, job done.REFERENCES 20
References
AAS (Australian Academy of Science). 2015. Climate BoM (2017c) BoM (2017i) Daily Extremes. Accessed
change challenges to health: Risks and Opportunities. at http://www. bom.gov.au/cgi-bin/climate/
Recommendations from the 2014 Theo Murphy High Flyers extremes/daily_extremes. cgi?period=%2Fcgi-
Think Tank. Canberra. bin%2Fclimate%2Fextremes%2Fdaily_ extremes.
cgi&climtab=tmax_high&area=sa&year=2017&m
ABC (Australian Broadcasting Corporation) (2017a) NSW
on=2&day=8.
fires: At least 30 homes confirmed lost across NSW, fires
continue. 14 February 2017. Accessed at http://www.abc.net. BoM (2017d) BoM (2017v) Sydney Airport, New South Wales
au/news/2017-02-13/nsw-fireswipe-out-dozens-of-homes- February 2017 Daily Weather Observations. Accessed at
with-numbers-expected-torise/8264870. http://www. bom.gov.au/climate/dwo/IDCJDW2125.latest.
shtml.
ABC (2017b) Heatwave kills thousands of bats across New
South Wales. 13 February 2017. Accessed at http://www. abc. BoM (2018) Annual Climate Statement 2017. Accessed at
net.au/news/2017-02-13/heatwave-kills-thousands-ofbats- http://www.bom.gov.au/climate/current/annual/aus/2017/.
nsw/8265530.
Canadell P, Le Quéré C, Peters G, Andrew R, Jackson
ABC (2018) NSW heatwave: Sydney set to swelter again with R and Haverd V (2017) Fossil fuel emissions hit record
fire bans in place and crews on standby. Accessed at http:// high after unexpected growth: Global Carbon Budget
www.abc.net.au/news/2018-01-08/sydney-heatwave- 2017. The Conversation, November 13. Accessed at:
continues-after-near-record-breaking-temps/9310226. https://theconversation.com/fossil-fuel-emissions-hit-
record-high-after-unexpected-growth-global-carbon-
ABS (Australian Bureau of Statistics) (2015) Australian
budget-2017-87248.
Demographic Statistics, March 2015. Accessed at: http://
www.abs.gov.au/ausstats/abs@.nsf/mf/3101.0. CCA (Climate Change Authority) (2015) Final Report on
Australia’s Future Emissions Reduction Targets, 2 July
AEMO (Australian Energy Market Operator) (2017)
2015. Accessed at: http://climatechangeauthority.gov.au/
System Event Report New South Wales, 10 February 2017.
sites/ prod.climatechangeauthority.gov.au/files/Final-
Accessed at http://www.aemo.com.au/-/media/Files/
reportAustralias-future-emissions-reduction-targets.pdf.
Electricity/NEM/Market_Notices_and_Events/Power_
System_Incident_Reports/2017/Incident-report-NSW-10- Clarke H, Lucas C and Smith P (2013) Changes in Australian
February-2017.pdf. fire weather between 1973 and 2010. International Journal
of Climatology, 33: 931-944.
Australian Government (2017a) Quarterly Update of
Australia’s National Greenhouse Gas Inventory: March Climate Council (2017a) Cranking Up The Intensity:
2017. Accessed at: http://www.environment.gov.au/ Climate Change And Extreme Weather Events. Accessed
climate-change/climate-science-data/greenhouse- at https://www.climatecouncil.org.au/cranking-
gasmeasurement/publications/quarterly-update- intensityreport.
australiasnational-greenhouse-gas-inventory-mar-2017.
Climate Council (2017b) Critical Decade 2017: Accelerating
Australian Government (2018) Australia’s Emissions Climate Action. Accessed at https://www.climatecouncil.
Projections 2017. Accessed at https://www.environment. org.au/critical-decade-2017.
gov.au/system/files/resources/eb62f30f-3e0f-4bfa-bb7a-
Coates L, Haynes K, O’Brien J, McAneney J and de
c87818160fcf/files/australia-emissions-projections-2017.
Oliveira FD. 2014. Exploring 167 years of vulnerability: an
pdf.
examination of extreme heat events in Australia 1844–2010.
BBC (British Broadcasting Corporation) (2017) Nearly 100 Environmental Science & Policy, 42:33-44.
bushfires raging in Australia’s New South Wales state. 12
Cowan T, Purich A, Perkins S, Pezza A, Boschat G, and
February 2017. Accessed at http:// www.bbc.com/news/
Sadler K (2014) More Frequent, Longer, and Hotter Heat
world-australia-38948669.
Waves for Australia in the Twenty-First Century. Journal of
Bennett CM, Dear KBG and McMichael AJ (2013) Shifts in Climate, 27: 5851-5871.
the seasonal distribution of deaths in Australia, 1968-2007.
CSIRO and BoM (2015) Climate Change in Australia –
International Journal of Biometeorology, 58: 835-842.
Technical Report, CSIRO and Bureau of Meteorology,
BoM (Bureau of Meteorology) (2017a) Special Climate Melbourne, 216pp.
Statement 61—exceptional heat in southeast Australia in
CSIRO (Commonwealth Scientific and Industrial Research
early 2017. Accessed at http://www.bom.gov.au/climate/
Organisation) and BoM (2016) State of the Climate 2016.
current/statements/scs61.pdf.
CSIRO and BoM, Melbourne, 22p.
BoM (2017b) Adelaide, South Australia February 2017 Daily
Observations. Accessed at http://www.bom.gov.au/climate/
dwo/201702/html/IDCJDW5002.201702.shtml.21 2017:
ANOTHER RECORD-BREAKING YEAR FOR HEAT AND EXTREME WEATHER
Deloitte Access Economics (2013) Economic contribution Kossin JP and Vimont DJ (2007) A more general framework
of the Great Barrier Reef, March 2013, Great Barrier Reef for understanding Atlantic hurricane variability and trends.
Marine Park Authority, Townsville. Accessed at https:// Bulletin of the American Meteorological Society, 88: 1767–
www.environment.gov.au/system/files/resources/ 1781.
a3ef2e3f-37fc-4c6f-ab1b-3b54ffc3f449/files/gbr-
Mann M (2017) Dr. Michael Mann on Extreme Weather:
economiccontribution.pdf.
“We predicted this long ago”. The Climate Reality
DIT (Australian Government Department of Infrastructure Project, 21 October 2017. Accessed at https://www.
and Transport) (2013) State of Australian Cities 2013. climaterealityproject.org/blog/dr-michael-mann-extreme-
Accessed at: https://infrastructure.gov.au/infrastructure/ weather-we-predicted-long-ago.
pab/soac/files/2013_00_infra1782_mcu_soac_full_web_
Mann M (2018) A ‘Perfect Storm’: Extreme winter weather,
fa.pdf.
bitter cold and climate change. The Climate Reality
Figueres C, Schellnhuber HJ, Whiteman G, Rockström J, Project, 4 January 2018. Accessed at https://www.
Hobley A and Rahmstorf S (2017) Three years to safeguard climaterealityproject.org/blog/perfect-storm-extreme-
our climate. Nature, 546: 593–595. winter-weather-bitter-cold-and-climate-change.
Foster G and Rahmstorf S (2011) Global temperature NASA (2018) (National Aeronautics and Space
evolution 1979–2010. Environmental Research Letters, 6 Administration) Global Land-Ocean Temperature Index.
044022, doi:10.1088/1748-9326/6/4/044022. Accessed at https://data.giss.nasa.gov/gistemp/graphs_v3/
Fig.A2.gif.
Fraser P, Krummel P and Loh Z (2017) World greenhouse gas
levels made unprecedented leap in 2016. The Conversation, NOAA (National Oceanic and Atmospheric Administration)
October 31. Accessed at: https://theconversation.com/ (2017a) NOAA National Centers for Environmental
world-greenhouse-gas-levels-made-unprecedented-leap- Information, State of the Climate: Global Climate Report for
in-2016-86545. January 2017. Accessed at https://www.ncdc.noaa.gov/sotc/
global/201701.
Germanwatch (2017) Climate Change Performance Index.
Accessed at: https://germanwatch.org/en/ccpi. NOAA (2017b) NOAA National Centers for Environmental
Information, State of the Climate: Global Climate Report for
IPCC (Intergovernmental Panel on Climate Change) (2013)
March 2017. Accessed at https://www.ncdc.noaa.gov/sotc/
Summary for Policymakers. In: Climate Change 2013: The
global/201703.
Physical Science Basis. Contribution of Working Group I
to the Fifth Assessment Report of the Intergovernmental NOAA (2017c) NOAA National Centers for Environmental
Panel on Climate Change [Stocker TF and 9 others (eds.)]. Information, State of the Climate: Global Climate Report
Cambridge University Press, Cambridge, United Kingdom for May 2017. Accessed at https://www.ncdc.noaa.gov/sotc/
and New York, NY, USA. global/201705.
Jacobs (2016) Investing in the Great Barrier Reef as NOAA (2017d) NOAA National Centers for Environmental
economic infrastructure. Accessed at http://www.wwf.org. Information, State of the Climate: Global Climate Report for
au/ArticleDocuments/353/pub-jacobs-report-investing- June 2017. Accessed at https://www.ncdc.noaa.gov/sotc/
inthe-great-barrier-reef-as-economic-infrastrucure- global/201706.
15dec16. pdf.aspx.
NOAA (2017e) NOAA National Centers for Environmental
Jegasothy, E., McGuire, R., Nairn, J. Fawcett R and Scalley Information, State of the Climate: Global Climate Report
B (2017) Extreme climatic conditions and health service for July 2017. Accessed at https://www.ncdc.noaa.gov/sotc/
utilisation across rural and metropolitan New South Wales. global/201707.
International Journal of Biometeorology (2017) 61: 1359.
NOAA (2017f) NOAA National Centers for October 2017.
https://doi.org/10.1007/s00484-017-1313-5.
Accessed at https://www.ncdc.noaa.gov/sotc/global/201710.
Jolly M and 6 others (2015) Climate-induced variations
NOAA (2018a) Global Analysis - Global Climate Report -
in global wildfire danger from 1979 to 2013. Nature
Annual 2017. Accessed at: https://www.ncdc.noaa.gov/sotc/
Communications, 6: 7537.
global/201713.
King A, Karoly D, van Oldenborgh GJ, Hale M and
NOAA (2018b) National Climate Report - December
Perkins-Kirkpatrick S (2017) Climate change’s signature
2017. Accessed at https://www.ncdc.noaa.gov/sotc/
was writ large on Australia’s crazy summer of 2017.
national/201712.
The Conversation, 2 March 2017. Accessed at https://
theconversation.com/climate-changes-signature-waswrit- NOAA (2018c) U.S. Billion-Dollar Weather and Climate
large-on-australias-crazy-summer-of-2017-73854. Disasters (2018). National Centers for Environmental
Information (NCEI). Accessed at https://www.ncdc.noaa.
gov/billions/.REFERENCES 22
Image Credits
Perkins S and Alexander L (2013). On the measurement of Cover: “Big Sun on sunset. Nature composition.” by djgis
heat waves. Journal of Climate, 26: 4500-4517. (Shutterstock ID: 131341742).
Perkins-Kirkpatrick S, King A and Hale M (2017) Climate Page 3: Figure 2 “NorCal Fires Oct 11” by Flickr user
change doubled the likelihood of the New South Wales California National Guard licensed under CC BY 2.0.
heatwave. The Conversation, 6 February 2017. Accessed
Page 12: Figure 5 “Bushfire close up at night“ by VanderWolf
at https://theconversation.com/climate-change-doubled-
Images (Shutterstock ID: 54354991).
thelikelihood-of-the-new-south-wales-heatwave-72871.
Page 13: Figure 6 “The power” by Flickr user Indigo Skies
Phys.Org (20017) Hurricane Irma death toll rises to 72
Photography licensed under CC BY-NC-ND 2.0.
in Florida. Accessed at https://phys.org/news/2017-09-
hurricane-irma-death-toll-florida.html. Page 16: Figure 7 “Bleached coral at the Great Barrier Reef”
courtesy of Dean Miller (GBR Legacy).
Reuters (2017) Chile’s wine industry sees little impact from
fires, heatwave. Rosabla O’Brien, 7 April 2017. Accessed at
https://www.reuters.com/article/us-chile-wines/chiles-
wine-industry-sees-little-impact-from-fires-heatwave-
idUSKBN1782R3.
Rockström J et al. (2017) A roadmap for rapid
decarbonization. Science, 355: 1269-1271.
Sydney Morning Herald (2018) Penrith swelters while
Florida freezes: climate disruption is to blame. Will Steffen,
8 January 2018. Accessed at http://www.smh.com.au/
comment/penrith-swelters-while-florida-freezes-climate-
disruption-is-to-blame-20180107-h0ewb2.html.
The Guardian (2017) From ‘angry summer’ to ‘weird winter’:
2017 was riddled with extreme weather. Amanda McKenzie,
27 December 2017. Accessed at https://www.theguardian.
com/commentisfree/2017/dec/28/from-angry-summer-to-
weird-winter-2017-was-riddled-with-extreme-weather.
Trenberth KE, Caron JM, Stepaniak DP and Worley S
(2002) Evolution of El Niño–Southern Oscillation and
global atmospheric surface temperatures. Journal
of Geophysical Research: Atmospheres, 107(D8),
doi:10.1029/2000JD000298.
Trenberth KE (2012) Framing the way to relate climate
extremes to climate change. Climatic Change, 115: 283–290.
UNEP (United Nations Environment Programme) (2017)
The Emissions Gap Report 2017: A UN Environment
Synthesis Report. Accessed at: https://wedocs.unep.org/
bitstream/ handle/20.500.11822/22070/EGR_2017.pdf.
Watts N, Adger W, Agnolucci P, Byass P, Cai W, Chaytor
S, Colbourn T, Collins M, Cooper A, Cox P, Depledge J,
Drummond P, Ekins P, Galaz V, Grace D, Graham H, Grubb
M, Haines A, Hamilton I, Hunter A, Jiang X, Li M, Kelman I,
Liang L, Lott M, Lowe R, Luo Y, Mace G, Maslin M, Nilsson
M, Oreszczyn T, Pye S, Quinn T, Svensdotter M, Venevsky
S, Warner K, Xu B, Yang J, Yin Y, Yu C, Zhang Q, Gong P,
Montgomery H and Costello A. 2015. Health and climate
change: policy responses to protect public health. The
Lancet, 386: 1861-1914.
WMO (World Meteorological Organisation) (2017) 2017 is
set to be in top three hottest years, with record-breaking
extreme weather. Media Release. Accessed at: https://public.
wmo.int/en/media/press-release/2017-set-be-top-three-
hottest-years-record-breaking-extreme-weather.Thank you for
supporting the
Climate Council.
The Climate Council is an independent, crowd-funded organisation
providing quality information on climate change to the Australian public.
CLIMATE COUNCIL
facebook.com/climatecouncil
twitter.com/climatecouncil
info@climatecouncil.org.au
climatecouncil.org.au
The Climate Council is a not-for-profit organisation
and does not receive any money from the Federal
Government. We rely upon donations from the
public. We really appreciate your contributions.
DONATE climatecouncil.org.au/donateYou can also read