TRANSMISSION MAKES THE POWER SYSTEM RESILIENT TO EXTREME WEATHER - PREPARED FOR ACORE, WITH SUPPORT FROM THE MACRO GRID INITIATIVE
←
→
Page content transcription
If your browser does not render page correctly, please read the page content below
TRANSMISSION MAKES
 THE POWER SYSTEM
RESILIENT TO EXTREME
      WEATHER

       PREPARED FOR ACORE, WITH SUPPORT
       FROM THE MACRO GRID INITIATIVE
AUTHOR                                       This February, millions of Americans experienced

MICHAEL GOGGIN                               prolonged power outages when electricity demand
Grid Strategies LLC                          exceeded supply as record cold gripped much of the
                                             Central U.S. Power outages are always life-threatening
JULY 2021                                    for those who rely on electric medical devices, but they
                                             can be dangerous for anyone during a period of extreme
                                             cold or heat. Tragically, it appears the February power
                                             outages contributed to hundreds of deaths in Texas alone.1
                                             Electricity is also increasingly the lifeblood of America’s
TABLE OF CONTENTS                            economy, and is essential for powering first responders
                                             and national security workers. The Congressional
EXECUTIVE SUMMARY                        2   Research Service estimates that weather-related power
                                             outages cost Americans $25-70 billion annually. 2
RESULTS: VALUE OF TRANSMISSION           7
                                             Investigations are underway to determine what caused
DURING RECENT SEVERE WEATHER
EVENTS                                       February’s outages. Regardless of which energy sources
   Winter Storm Uri in February 2021     7
                                             failed, strengthening transmission is an essential part
                                             of the solution for preventing future outages. Extreme
   August 2019 ERCOT heat wave          13
                                             weather events tend to be most severe in relatively
   The “Bomb Cyclone” cold snap         14
   across the Northeast in December          small areas, so stronger transmission ties to neighboring
   2017-January 2018                         regions can be a lifeline to keep homes warm and people
   The January 2014 “polar vortex”      15   safe. Transmission ties cancel out local fluctuations in the
   event in the Northeast                    weather that affect electricity demand. This is primarily
   The “polar vortex” event in the      17   due to heating/cooling needs and supply, including
   Midwest in 2019                           changes in wind and solar output as well as failures of
                                             conventional power plants due to extreme weather.
PRO-TRANSMISSION POLICIES TO            18
REALIZE THESE BENEFITS                       Many severe weather events migrate from region to
   Transmission investment tax credit   18
                                             region, allowing one region to import during its time of
                                             need and then export to other regions once the storm
   Anchor tenant                        19
                                             moves on. Grid operators have confirmed that connecting
   FERC Action                          19

                                                                                                                                             TRANSMISSION MAKES THE POWER SYSTEM RESILIENT TO EXTREME WEATHER
                                             large geographic areas via transmission saves billions of
   Streamlined permitting               19
                                             dollars per year by reducing the need for power plant
                                             capacity by reducing variability in electricity supply
TECHNICAL APPENDIX                      20
                                             and demand. 3 A strongly integrated grid network also
                                             provides valuable resilience, so if some power lines or
                                             power plants are taken offline by any type of disaster,
                                             there are alternative sources of power available.

                                             1   Peter Aldhous, Stephanie M. Lee, and Zahra Hirji, “The Texas Winter Storm and Power
                                             Outages Killed Hundreds More People Than the State Says,” (May 26, 2021), available at:
                                             https://www.buzzfeednews.com/article/peteraldhous/texas-winter-storm-power-outage-
                                             death-toll.
                                             2 Executive Office of the President, Economic Benefits of Increasing Electric Grid Resilience
                                             to Weather Outages, (August 2013), available at: https://www.energy.gov/sites/default/
                                             files/2013/08/f2/Grid%20Resiliency%20Report_FINAL.pdf.
                                             3 For example, see PJM, “PJM Value Proposition,” (2019) available at: https://www.pjm.com/
                                             about-pjm/~/media/about-pjm/pjm-value-proposition.ashx, MISO, “Value Proposition,” (n.d.),
                                             available at: https://www.misoenergy.org/about/miso-strategy-and-value-proposition/miso-
                                             value-proposition/.

                                                                                                                                                                        1
EXECUTIVE SUMMARY
Severe weather events are becoming more common and more extreme, with severe events
challenging nearly every part of the U.S. power grid in the last decade alone.4 This analysis
reviews five recent severe weather events to determine the value additional transmission would
have provided.

February 2021 Winter Storm Uri — Each additional 1 GigaWatt (GW) of transmission ties
between the Texas power grid (ERCOT) and the Southeastern U.S. could have saved nearly
$1 billion, while keeping the heat on for hundreds of thousands of Texans. With stronger
transmission ties, other parts of the Central U.S. also could have avoided power outages while
saving consumers hundreds of millions of dollars. In particular, consumers in the Great Plains,
served by the Southwest Power Pool (SPP), and those in the Gulf Coast states, served by the
southern part of the Midcontinent Independent System Operator (MISO), each could have
saved in excess of $100 million with an additional 1 GW of transmission ties to power systems
to the east.

Texas heat wave in August 2019 — An extended heat wave in Texas led to high power prices
across 12 days in August 2019. An additional 1 GW transmission tie to the Southeast could have
saved Texas consumers nearly $75 million. As summer heat waves become more frequent and
severe, the value of transmission for delivering needed electricity supplies from regions that are
less affected will grow.

The “Bomb Cyclone” cold snap across the Northeast in December 2017-January 2018 —
New England, New York, and the Mid-Atlantic region suffered cold weather for nearly three
weeks, causing natural gas price spikes and nearly exhausting fuel oil supplies in New England.
Each of these regions could have saved $30-40 million for each GW of stronger transmission
ties among themselves or to other regions. These regions routinely switched between importing

                                                                                                                                                            TRANSMISSION MAKES THE POWER SYSTEM RESILIENT TO EXTREME WEATHER
and exporting as the most severe cold migrated among the regions over the course of the
three-week event, demonstrating that transmission benefits all users across broad geographic
areas. In addition, one GW of stronger transmission ties between eastern and western PJM,
the grid operator for much of the region between the Mid-Atlantic and Chicago, would have
provided over $40 million in net benefits during this event.

4 See, e.g. NOAA National Centers for Environmental Information, “Billion-Dollar Weather and Climate Disasters: Overview,” (2021), available at: https://
www.ncdc.noaa.gov/billions/.

                                                                                                                                                                                       2
The January 2014 “polar vortex” event in the Northeast — New England, New York, and
the Mid-Atlantic region suffered several days of extreme cold in early January 2014. The grid
operator for the Mid-Atlantic region, PJM, resorted to voltage reductions to avoid the need for

                                                                                                  TRANSMISSION MAKES THE POWER SYSTEM RESILIENT TO EXTREME WEATHER
rolling outages. Greater transmission ties within and among these regions could have saved
consumers tens of millions of dollars and prevented reliability concerns. Like the 2017/2018
Bomb Cyclone event, regions switched between importing and exporting as the most extreme
cold migrated from region to region.

The “polar vortex” event in the Midwest in 2019 — While an additional 1 GW of transmission
between MISO and PJM would have only saved a few million dollars during this short-lived
cold snap, this event was notable for illustrating how transmission expansion benefits both
interconnected regions. As the extreme cold moved eastward from MISO to PJM, so did the
high power prices, and transmission flows switched from westward to eastward.

These results for these five events are summarized in the table below. For reference, long-
distance transmission costs around $700 million per GW of transfer capacity, based on the
average cost for the 18 above-ground shovel-ready projects identified in a recent report,

                                                                                                                             3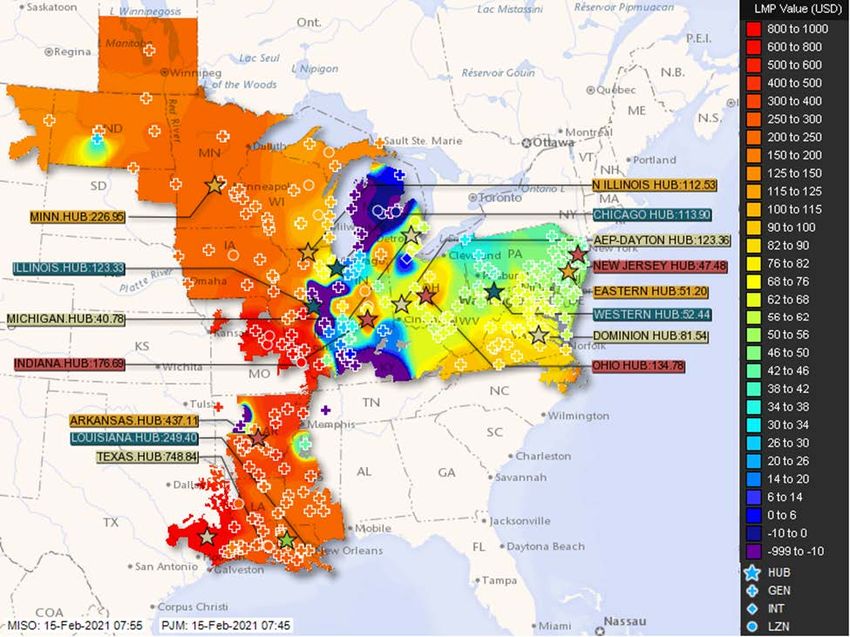
though costs vary considerably based on the length of the line and other factors. 5 In the case
of the February 2021 Texas outages, the value of power delivered to Texas could have fully
covered the cost of new transmission to the Southeast, while for other lines and severe weather
events the value could have defrayed a significant share of the cost of building transmission.

TABLE 1. Value of 1 GW of additional transmission by region for each event

                                                           Savings per GW of additional
Receiving region – delivering region                   transmission capacity (millions of $)

 WINTER STORM URI, FEBRUARY 2021

ERCOT – TVA                                                              $993

SPP South – PJM                                                          $129

SPP South – MISO IL                                                      $122

SPP South – TVA                                                          $120

SPP S – MISO S (Entergy Texas)                                           $110

MISO S-N (Entergy Texas - IL)                                            $85

MISO S (Entergy Texas) – TVA                                             $82

 TEXAS HEAT WAVE, AUGUST 2019

ERCOT – TVA                                                              $75

 NORTHEAST BOMB CYCLONE, DECEMBER 2017 – JANUARY 2018

Eastern PJM (VA) – Western PJM (Northern IL)                             $43

NYISO – PJM                                                               $41

PJM – MISO                                                               $38

NYISO – ISONE                                                            $29

 NORTHEAST POLAR VORTEX EVENT, JANUARY 2014

                                                                                                                                                      TRANSMISSION MAKES THE POWER SYSTEM RESILIENT TO EXTREME WEATHER
PJM – MISO                                                                $17

NYISO – PJM                                                               $9

NYISO – MISO                                                              $21

 MIDWEST POLAR VORTEX EVENT, JANUARY 2019

MISO – PJM                                                                $2

For each event, the savings across the multiple potential new lines are not always additive,
with the total savings tending to be somewhat lower than the sum of all lines’ savings. This is
because building the first line into a region will alleviate some of the congestion, reducing the
value of additional lines into that region.

5 Michael Goggin, Rob Gramlich, and Michael Skelly, Transmission Projects Ready to Go: Plugging Into America’s Untapped Renewable Resources, (April
2021), available at: https://cleanenergygrid.org/wp-content/uploads/2019/04/Transmission-Projects-Ready-to-Go-Final.pdf.

                                                                                                                                                                                 4
Across these events, transmission congestion tends to recur at certain notable points on the
grid, confirming the need for expanded transmission in those areas. Expanding transmission
between ERCOT and the Southeast, from SPP and MISO to power systems to the east like PJM
and the Southeast, between western and eastern PJM, and among eastern PJM, New York, and
New England appears to be particularly valuable for protecting against the impact of severe
weather.
These events demonstrate that all generation sources are vulnerable to severe weather, making
increased transmission to broaden the pool of available resources one of the best options for
increasing resilience. ERCOT6 and SPP7 data for the February 2021 event show that coal, gas,
diesel, wind, solar, nuclear, and hydropower plants were all taken offline by the record cold
and ice; however, gas generators accounted for the majority of outages, with the cold causing
generator equipment failures as well as fuel interruptions due to overwhelmed pipeline capacity
and frozen gas wells.
Despite the large savings identified above, transmission’s value for making the grid more
TRANSMISSION MAKES THE POWER SYSTEM RESILIENT TO EXTREME WEATHER
resilient against severe weather and other unexpected threats is not typically accounted for
in transmission planning and cost allocation analyses. Grid operator transmission planning
processes typically assume normal electricity supply and demand patterns, and in most cases
do not account for the value of transmission for increasing resilience. Transmission’s hedging
or insurance value from protecting consumers against the economic and reliability impacts of
these rare events is also not typically accounted for.
As a result, pro-transmission policies need to be enacted to account for the resilience benefits
of transmission. Just as President Eisenhower created the interstate highway system to protect
national security and facilitate interregional trade, there is a clear national interest in ensuring
that the backbone of the 21st century economy — the power grid — is strong and secure.
6 ERCOT, “Hourly Resource Outage Capacity,” (2021), available at: http://mis.ercot.com/misapp/GetReports.
do?reportTypeId=13103&reportTitle=Hourly%20Resource%20Outage%20Capacity&showHTMLView=&mimicKey.
7 SPP, “Capacity of Generation on Outage,” (2021), available at: https://marketplace.spp.org/pages/capacity-of-generation-on-outage#%2F2021%2F02.
5Federal legislation and action by the Federal Energy Regulatory Commission (FERC) can enable
the needed investment. A tax credit for building high-voltage transmission lines is now under
consideration in Congress. FERC can require greater regional and interregional coordination
in how transmission is planned and paid for, and could require minimum levels of interregional
transmission to ensure grid reliability. Congress could also pass legislation directing FERC to
make those changes.
A stronger grid will be valuable every day, not just during extreme weather events. Many of
the new transmission lines that would have been highly valuable during these severe weather
events are the same ones needed to deliver the Midwest’s low-cost wind resources to electricity
demand centers to the east. Power can flow in both directions on transmission, so both ends of
the line benefit. Most of the time these lines will export wind generation from the Midwest, but
during an emergency power can flow back into the Midwest.
Many recent studies show that interregional transmission lines like those discussed in this
paper become increasingly essential as wind and solar penetrations increase in different parts
of the country. Just as these lines aggregate diverse sources of electricity supply and demand
to balance out localized disruptions during extreme weather, they provide a similar value by
canceling out local fluctuations in wind or solar output. 8
There have also been other extreme temperature and severe weather events in other regions
over the last decade in which stronger transmission ties would have been similarly valuable.9
However, those events occurred in regions without centralized power markets or in regions that
were not adjacent to those with centralized power markets, making it more difficult to quantify
the value of transmission due to the lack of transparent market price information. It is likely
that these regions could have seen benefits from transmission expansion that are comparable
to those quantified in this report.10 The following section discusses in more detail the value
additional transmission could have provided during the five recent severe weather events.
TRANSMISSION MAKES THE POWER SYSTEM RESILIENT TO EXTREME WEATHER
8 For example, see Patrick Brown and Audun Botterud, “The Value of Interregional Coordination and Transmission in Decarbonizing the US
Electricity System,” (January 20, 2021), Joule, Volume 5, Issue 1, at 115-134, available at: https://www.sciencedirect.com/science/article/abs/pii/
S2542435120305572?dgcid=author; Eric Larson et al., Net-Zero America: Potential Pathways, Infrastructure, and Impacts, (December 15, 2020), available
at: https://environmenthalfcentury.princeton.edu/sites/g/files/toruqf331/files/2020-12/Princeton_NZA_Interim_Report_15_Dec_2020_FINAL.pdf;
Aaron Bloom et al., The Value of Increased HVDC Capacity Between Eastern and Western U.S. Grids: The Interconnections Seam Study, (October 2020),
available at: https://www.nrel.gov/docs/fy21osti/76850.pdf; NREL, Renewable Electricity Futures Study,” (2012), available at: https://www.nrel.gov/docs/
fy13osti/52409-ES.pdf; Christopher Clack, Michael Goggin, Aditya Choukulkar, Brianna Cote, and Sarah McKee, Consumer, Employment, and Environmental
Benefits of Electricity Transmission Expansion in the Eastern U.S., (October 2020), available at: https://cleanenergygrid.org/wp-content/uploads/2020/10/
Consumer-Employment-and-Environmental-Benefits-of-Transmission-Expansion-in-the-Eastern-U.S..pdf.
9 For example, many parts of the Western U.S. have experienced record heat or cold, or natural gas supply interruptions like the Aliso Canyon leak and
British Columbia pipeline explosion, that resulted in power outages or extreme price spikes. See, e.g. outages and price spikes in the Southwest following
extreme cold and gas supply interruptions, FERC and NERC Staff, Outages and Curtailments During the Southwest Cold Weather Event of February 1-5,
2011: Causes and Recommendations, (August 2011), available at: https://www.ferc.gov/sites/default/files/2020-04/08-16-11-report.pdf. Similarly, many
utilities in the Southeast have been challenged by unusual cold snaps or extreme heat and drought. See, e.g. FERC and NERC Staff, The South Central
United States Cold Weather Bulk Electric System Event of January 17, 2018, (July 2019), available at: https://www.nerc.com/pa/rrm/ea/Documents/South_
Central_Cold_Weather_Event_FERC-NERC-Report_20190718.pdf.
10 For example, in August 2020 California experienced power outages and high prices when a high level of generator outages coincided with record-
breaking heat across many parts of the Western U.S. While this event was highly unusual in that the extreme heat affected much of the West at the same
time, additional transmission capacity to other regions still could have helped alleviate the outages and price spikes. The California grid operator has
calculated that congestion on transmission ties with other regions, mostly the Pacific Northwest, added around $45 million in consumer costs, while
transmission congestion within California imposed an additional $37 million in costs.
6RESULTS: VALUE OF TRANSMISSION DURING
RECENT SEVERE WEATHER EVENTS
These events demonstrate that all generation sources are vulnerable to severe weather, making
increased transmission to broaden the pool of available resources one of the best options for
increasing resilience. Almost all severe weather events are at their most extreme in a relatively
narrow geographic area, so transmission allows surplus electricity supplies to be delivered from
neighboring regions that are not experiencing extreme electricity demand or loss of generating
supply.
Winter Storm Uri in February 2021
The value of transmission for resilience can be seen in the drastically different outcomes of
MISO and SPP relative to ERCOT during the February 2021 cold snap event. SPP and MISO were
able to weather the storm with much less severe power outages thanks to stronger transmission
ties to neighboring regions that allowed them to import more than 15 times as much power as
ERCOT.
While SPP and MISO also experienced extreme cold, they were able to avoid major power
shortfalls by importing electricity from regions experiencing milder temperatures, mostly to
the east. As shown in the bottom half of the Department of Energy chart below, at maximum
MISO was importing nearly 9,000 megawatts (MW) from PJM, several thousand MW from the
Tennessee Valley Authority (TVA), and around an additional 1,000 MW each from Southern
Company, Louisville Gas and Electric, and Canada.11 Total MISO imports were consistently over
13,000 MW during the most challenging period from midday February 15 to midday February 16.
TRANSMISSION MAKES THE POWER SYSTEM RESILIENT TO EXTREME WEATHER
11 This chart can be made at https://www.eia.gov/electricity/gridmonitor/expanded-view/electric_overview/US48/US48/InterchangeWithNeighbor-5.
710,000 PowerSouth
Ontario
PJM
5,000
SPP
MEGA WATT HOURS
AECI
0 LOUISVILLE
Southern Company
TVA
-5,000 GridLiance
Manitoba
S outhwestern Power Administration
-10,000
15 Feb 2021 16 Feb 2021 17 Feb 2021 18 Feb 2021 19 Feb 2021 20 Feb 2021
FIGURE 1. Midcontinent Independent System Operator, Inc. (MISO) electricity
interchange with neighboring balancing authorities 2/15/2021-2/19/2021, Eastern Time
In turn, MISO was exporting to power systems to its west, delivering over 5,000 MW to SPP and
nearly 2,500 MW to the Associated Electric Cooperative Incorporated, as shown in the top part
of the chart. Thus around half the power MISO was importing was effectively flowing through
MISO to reach power systems farther to the west.
In contrast to the 13,000 MW MISO was importing during the peak of last month’s event, ERCOT
was only able to import about 800 MW of power throughout the event, as shown below. ERCOT
was initially able to import nearly 400 MW from Mexico, though those imports were cut early
on February 15 when Mexico also experienced generator outages due to a loss of gas supply.
Imports from SPP were also briefly cut at various points as SPP experienced its own shortages,
particularly on February 16.
TRANSMISSION MAKES THE POWER SYSTEM RESILIENT TO EXTREME WEATHER
0 Mexico
SPP
-250
MEGA WATT HOURS
-500
FIGURE 2. Electric Reliability
Council of Texas, Inc. (ERCOT)
-750 electricity interchange with
neighboring balancing
authorities 2/15/2021-
-1,000 2/19/2021, Eastern Time
15 Feb 2021 16 Feb 2021 17 Feb 2021 18 Feb 2021 19 Feb 2021 20 Feb 2021
8MISO and SPP also could have benefited from stronger transmission ties to neighboring regions,
as well as stronger ties between northern and southern MISO. Power prices in SPP and southern
MISO spiked during the event, reaching or exceeding the $1,000/MWh price cap in those
markets as prices for natural gas spiked.12 The need for more transmission capacity was also
reflected in the strong west-to-east price gradient across MISO and PJM shown below, with
prices in the hundreds of dollars per MWh in MISO versus around $50/MWh in eastern PJM on
the morning of February 15.
FIGURE 3. Snapshot
of power prices
T on the morning of
February 15, 2021
TRANSMISSION MAKES THE POWER SYSTEM RESILIENT TO EXTREME WEATHER
Transmission congestion costs at the seams between PJM, MISO, and SPP routinely approached
$2,000/MWh throughout the event, reflecting the need for more transmission.14 In many cases
those costs flow to consumers who are forced to buy more expensive power because there was
insufficient transmission capacity to deliver lower-cost imports. As is often the case, a large
amount of transmission congestion at the MISO-PJM seam in Illinois and Indiana prevented
more power from reaching SPP and MISO. Grid-enhancing technologies that allow more power
to be transferred across transmission lines likely would have reduced the outages and price
spikes in MISO and SPP.15 Long-standing operational issues at the seams between the markets
may have also contributed to the congestion and caused the localized pockets of very low
12 SPP, “Order 831 Verification Frequently Asked Questions,” (April 1, 2021), available at: https://www.spp.org/documents/64402/spp%20mmu%20
order%20831%20verifcation%20faq%20v4.pdf.
13 Screenshot taken February 15, 2021, from Joint and Common Market Contour Map, available at https://www.miso-pjm.com/markets/contour-map
14 MISO, “SRW Hourly Market-to-Market Settlements,” (2021), available at: https://docs.misoenergy.org/marketreports/M2M_Settlement_srw_2021.csv.
15 T. Bruce Tsuchida, Stephanie Ross, and Adam Bigelow, Unlocking the Queue With Grid-Enhancing Technologies,” (February 1, 2021), available at:
https://watt-transmission.org/wp-content/uploads/2021/02/Brattle_ _Unlocking-the-Queue-with-Grid-Enhancing-Technologies_ _Final-Report_Public-
Version.pdf90.pdf.
9prices along the seam shown in the map above.16
Throughout the event, transmission constraints within MISO were also limiting the transfer of
power from areas with more abundant power to areas with higher prices. The quantity and price
impact of binding transmission constraints within MISO were at least an order of magnitude
higher than a typical winter day.17 Price differences between northern MISO and southern MISO
were also extreme throughout the event, routinely hitting $500/MWh.18
The following chart shows our analysis of the extreme price differences among these
neighboring grid areas during Winter Storm Uri, illustrating the value of expanding transmission
ties among these regions. Power prices in PJM, TVA, and MISO Illinois remained relatively low
throughout the event, while prices in ERCOT were consistently high. Interestingly, power prices
in SPP South and MISO South were minimally or even negatively correlated throughout much of
the event, indicating that increased transmission capacity could have significantly benefited
both regions. About two-thirds of our calculated $110 million in savings per GW of increased
transmission between those regions would have accrued to SPP ($72 million), while one-third
would have accrued to MISO ($38 million). As discussed below, it is common for transmission to
benefit both ends of the transmission line over the course of many severe weather events, as
the area of the most severe weather often migrates over time.
$9,000 ERCOT
SPP South
$8,000
MISO South Entergy
$7,000 MISO Illinois
TVA
$6,000
PJM
$5,000
COST
$4,000
$3,000
TRANSMISSION MAKES THE POWER SYSTEM RESILIENT TO EXTREME WEATHER
$2,000
FIGURE 4. Power prices
$1,000 by region during
$0 Winter Storm Uri
1
5
9
3
17
21
25
29
33
37
41
45
49
53
57
61
65
69
73
77
81
85
89
93
97
101
105
109
113
117
121
125
129
133
137
141
145
149
153
157
161
165
169
173
177
181
185
189
193
197
201
205
209
213
217
HOUR OF EVENT, FEBRUARY 12-20 2021
16 David Patton and Mike Wander, “Identification of Seams Issues for OMS/SPP RSC,” (March 19, 2021), available at: https://www.spp.org/
documents/59674/oms_rsc_seamsissuesmemo.pdf.
17 MISO, “Real-Time Binding Constraints,” (2021), available at: https://www.misoenergy.org/markets-and-operations/real-time--market-
data/market-reports/#nt=%2FMarketReportType%3AReal-Time%2FMarketReportName%3AReal-Time%20Binding%20Constraints%20
(xls)&t=10&p=0&s=MarketReportPublished&sd=desc.
18 MISO, “Real-Time Binding Sub-Regional Power Balance Constraints,” (2021), available at: https://www.misoenergy.org/markets-and-operations/real-
time--market-data/market-reports/#nt=%2FMarketReportType%3AReal-Time%2FMarketReportName%3AReal-Time%20Binding%20Sub-Regional%20
Power%20Balance%20Constraints%20(csv)&t=10&p=0&s=MarketReportPublished&sd=desc.
10Additional Transmission Could Have Alleviated Price Spikes and Kept the Heat on During Uri
More transmission capacity from ERCOT, MISO, and SPP to power systems to the east, such
as PJM and TVA, and between northern MISO and southern MISO, and could have greatly
alleviated these price spikes. Using the methodology described in the Appendix, our analysis
finds large consumer savings for each potential 1 GW addition of transmission capacity, with
savings approaching $1 billion for 1 GW of additional ties between ERCOT and the Southeast,
and over $100 million for most of the other lines.
TABLE 2. Savings per additional GW of transmission, February 12-20, 2021
Savings per GW of additional
Receiving region – delivering region transmission capacity (millions of $)
ERCOT – TVA $993
SPP South – PJM $129
SPP South – MISO IL $122
SPP South – TVA $120
SPP S – MISO S (Entergy Texas) $110
MISO S-N (Entergy Texas - IL) $85
MISO S (Entergy Texas) – TVA $82
Because ERCOT, MISO, and SPP were all forced to resort to rolling power outages during
this event, the value of transmission is not only measured in dollars. A stronger transmission
network could have kept the heat and power on for millions of homes and businesses, avoiding
devastating loss of life and property. ERCOT says that one MW powers 200 homes during times
of peak usage, so each additional 1 GW of transmission could have kept the lights on for around
200,000 Texas homes. The total electricity shortfall in ERCOT was around 10-20 GW during
TRANSMISSION MAKES THE POWER SYSTEM RESILIENT TO EXTREME WEATHER
February’s event, so multiple high-capacity transmission lines could have greatly alleviated the
pain inflicted by the outages. Because many of the gas generator failures in ERCOT were due
to interdependencies between the electric system and the gas supply system, like the use of
electricity to power pipeline compressors and wellhead equipment, it is possible that several
high-capacity transmission lines could have entirely prevented the power outages. Transmission
also helps to protect national security. During Winter Storm Uri, several military bases were
forced to close due to a loss of power, or the loss of water service when water utilities lost
power.19
Transmission projects have been proposed for many of the interregional paths identified in the
table above. Pattern Energy has proposed the 2 GW Southern Cross transmission line between
ERCOT and Southeastern power systems like TVA. FERC and Texas regulators have determined
that this line would not interfere with ERCOT’s independence from FERC regulation, so those
19 Rose L. Thayer, “Winter Weather Causes More Than a Dozen Military Bases to Close,” (February 16, 2021), available at: https://www.stripes.com/news/
us/winter-weather-causes-more-than-a-dozen-military-bases-to-close-1.662417.
11concerns should not prevent the construction of this or other transmission between ERCOT
and FERC-regulated power markets. 20 Our analysis showing nearly $1 billion in savings per GW
of transmission indicates that, had Southern Cross been in service during Winter Storm Uri, it
could have provided nearly $2 billion in value by delivering 2 GW from the Southeast to ERCOT
for the duration of the event. This value greatly exceeds the $1.4 billion estimate cost for the
transmission project in this single event, without even considering the additional billions of
dollars in benefits it would provide over the many decades of the project’s life. 21
Other proposed lines would have benefited SPP and MISO. Grain Belt Express, originally
developed by Clean Line and now owned by Invenergy, is proposed to run between SPP South
and PJM. The Clean Line Plains and Eastern line, the Oklahoma portion of which is now owned
by NextEra Energy, would have connected SPP South with the Southeast. MISO’s transmission
planning processes routinely examine stronger transmission ties between northern and
southern MISO, and studies have shown significant value for transmission between SPP, MISO,
and PJM. Unfortunately none of those lines have been built, primarily due to disagreements over
who should pay for the transmission.
Those two lines could have provided hundreds of millions of dollars in benefits during Winter
Storm Uri alone. While that is not enough to cover the full cost of those transmission lines, it
adds to the savings they provide during normal operations. Across the half century or longer
life of a typical transmission line, it is almost certain that the line will provide critical supplies
of power during at least one severe weather event — particularly with the frequency and
magnitude of severe weather increasing. Accounting for resilience benefits in transmission
planning and cost allocation would significantly increase the calculated benefit-to-cost ratio of
transmission, enabling more transmission projects to move forward.
The experience of MISO and SPP during February’s Winter Storm Uri likely would have been
even worse had they not made large internal investments in transmission over the last decade.
TRANSMISSION MAKES THE POWER SYSTEM RESILIENT TO EXTREME WEATHER
During a recent MISO Board meeting, MISO President Clair Moeller stated that the Multi-Value Project transmission lines that
his organization has built over the last decade, at a cost of around $6.5 billion,22 provided around $18 billion in benefits across
three days of Winter Storm Uri.23
20 Pattern Energy, “Pattern’s Southern Cross Transmission Project Receives Key FERC Approvals,” (December 19, 2011), available at: https://www.
prnewswire.com/news-releases/patterns-southern-cross-transmission-project-receives-key-ferc-approvals-135852828.html.
21 Southern Cross Transmission LLC, Direct Testimony of David Parquet on Behalf of Southern Cross Transmission LLC, (2017), Attachment A, 2017-UA-79,
at 7, available at: https://www.psc.state.ms.us/InSiteConnect/InSiteView.aspx?model=INSITE_CONNECT&queue=CTS_ARCHIVEQ&docid=385777.
22 MISO, “Regionally Cost Allocated Project Reporting Analysis: 2011 MVP Portfolio Analysis Report,” (January 2021), available at: https://cdn.misoenergy.
org/MVP%20Dashboard%20Q4%202020117055.pdf.
23 This calculation is different from that presented in this paper, as it is based on the cost of the more extensive power outages that would have happened
without recent transmission investments, at an assumed cost of around $20,000/MWh of unserved energy. In contrast, our analysis evaluates reductions in
power prices with potential additional transmission.
12Other severe weather events have also challenged the South Central region, though none was
as severe as Winter Storm Uri. On February 2, 2011, ERCOT experienced rolling outages when
cold weather similarly caused power plant outages and natural gas supply shortages. Millions
of Texans experienced rolling outages that morning, and power prices hit the then-price cap
of $3,000/MWh. 24 An extended heat wave in summer 2011 also challenged the power grid in
ERCOT, causing high prices but no widespread outages. During another cold snap on January
6, 2014, ERCOT prices spiked to $5,000/MWh, and prices have gone even higher during other
extreme temperature and severe weather events.
During other severe weather events, ERCOT could have delivered needed power to neighboring
regions, reversing the flows that were seen in February 2021. MISO South, SPP South, and
parts of the Southeast experienced extreme cold on January 17, 2018, causing over 14,000 MW
of unexpected generation outages and bringing utilities to the brink of implementing rolling
outages. 25 Stronger east-west transmission ties to ERCOT and power systems to the east, and
transmission to northern SPP and MISO, could have alleviated the resulting price spikes and
prevented reliability concerns.
August 2019 ERCOT heat wave
An extended heat wave in Texas led to high power prices across 12 days in August 2019. An
additional 1 GW transmission tie to the Southeast could have saved Texas consumers nearly $75
million, per our calculations using the methodology described in the Appendix. As shown below,
power prices in TVA and MISO South remained consistently low across the 12 days, while prices
in ERCOT spiked most afternoons. Additional transmission ties to those regions, or to SPP or
the Western Interconnect, could have prevented those price spikes.
$9,000 ERCOT
MISO South Entergy
$8,000
TVA
$7,000
TRANSMISSION MAKES THE POWER SYSTEM RESILIENT TO EXTREME WEATHER
$6,000
$5,000
COST
$4,000
$3,000
$2,000
FIGURE 5. Power prices
$1,000 by region during August
$0 2019 heat wave
1
7
13
19
25
31
37
43
49
55
61
67
73
79
85
91
97
103
109
115
121
127
133
139
145
151
157
163
169
175
181
187
193
199
205
211
217
223
229
235
241
247
253
259
265
271
277
283
HOUR OF EVENT, AUGUST 5-16, 2019
24 Potomac Economics, LTD., Investigation of the ERCOT Energy Emergency Alert Level 3 on February 2, 2011, (April 21, 2011), available at: http://www.
ercot.com/content/meetings/tac/keydocs/2011/0505/09._IMM_Report_Events_020211.pdf.
25 FERC and NERC Staff, The South Central United States Cold Weather Bulk Electric System Event of January 17, 2018, (July 2019), available at: https://
www.nerc.com/pa/rrm/ea/Documents/South_Central_Cold_Weather_Event_FERC-NERC-Report_20190718.pdf.
13The “Bomb Cyclone” cold snap across the Northeast in December 2017-January 2018
New England (ISO-NE), New York (NYISO), and the Mid-Atlantic region (PJM) suffered cold
weather for nearly three weeks, causing natural gas price spikes and nearly exhausting fuel oil
supplies in New England. As summarized in the table below, each of these regions could have
saved around $30-40 million for each GW of stronger transmission ties among themselves or
to other regions. More specifically, PJM could have saved around $38 million from each GW of
greater imports from MISO to its west. One GW of stronger transmission ties between eastern
and western PJM also could have provided over $40 million in net benefits during this event. 26
TABLE 3. Savings per additional GW of transmission, December 26, 2017 – January 19, 2018
Savings per GW of additional
Receiving region – delivering region transmission capacity (millions of $)
Eastern PJM (VA) – Western PJM (Northern IL) $43
NYISO – PJM $41
PJM – MISO $38
NYISO – ISO-NE $29
TRANSMISSION MAKES THE POWER SYSTEM RESILIENT TO EXTREME WEATHER
26 Eastern PJM prices are represented by the Dominion zone (Virginia), while the ComEd zone (northern Illinois) represents western PJM.
14PJM, New York, and New England routinely switched between importing and exporting as
the most severe cold migrated among the regions over the course of the three-week event,
demonstrating that transmission benefits all users across broad geographic areas. The chart
below shows how eastern PJM, New York, and New England experienced price spikes at
different times during the event. New York prices were highly volatile given the relatively small
size of its market and lack of transmission ties to neighboring regions. ComEd power prices,
in western PJM, were consistently low throughout the event, even as power prices spiked
in Virginia and other parts of eastern PJM. Largely as a result, PJM reported $900 million in
internal PJM transmission congestion costs in the first half of 2018, up from $285 million in the
first half of 2017.
$1,500 NYISO
ISO-NE
$1,300 Dominion
ComEd
$1,100
$900
COST
$700
$500
$300
FIGURE 6. Power prices by
$100
region during 2017-2018
-$100 Bomb Cyclone
1
12
23
34
45
56
67
78
89
100
111
122
133
144
155
166
177
188
199
210
221
232
243
254
265
276
287
298
309
320
331
342
353
364
375
386
397
409
419
430
441
452
463
474
485
496
507
518
529
540
551
562
573
584
595
HOUR OF EVENT, XXX
TRANSMISSION MAKES THE POWER SYSTEM RESILIENT TO EXTREME WEATHER
The January 2014 “polar vortex” event in the Northeast
The Central U.S., Northeast, and Mid-Atlantic regions suffered several days of extreme cold in
early January 2014. PJM was forced to resort to system-wide voltage reductions to avoid the
need for rolling outages. Greater transmission ties within and among these regions could have
saved consumers tens of millions of dollars and prevented reliability concerns.
TABLE 4. Savings per additional GW of transmission, January 5-10, 2014
Savings per GW of additional
Receiving region – delivering region transmission capacity (millions of $)
PJM – MISO $17
NYISO – PJM $9
NYISO – MISO $21
15As shown below, prices were generally lower in MISO throughout the event, as the most
extreme cold was located to the east in PJM and New York. Delivering power from MISO to PJM,
or even to NYISO, would have greatly reduced consumer costs, as shown in the table above.
$2,500 NYISO
MISO Illinois
PJM
$2,000
$1,500
COST
$1,000
$500
FIGURE 7. Power prices
by region during 2014
$0 Polar Vortex
1
33
65
97
129
161
193
225
257
289
321
353
385
417
449
481
513
545
577
609
641
673
705
737
769
801
833
865
897
929
961
993
1025
1057
1089
1121
1153
1185
1217
1249
1281
1313
1345
1377
1409
1441
1473
1505
1537
1569
1601
1633
1665
1697
5-MINUTE INTERVAL BETWEEN JANUARY 5-10, 2014
Like in the 2017/2018 Bomb Cyclone event, regions switched between importing and exporting
as the most extreme cold migrated from region to region. This trend was most apparent the
morning of January 7, the day when most regions experienced the most extreme cold. As
shown in the following chart that zooms in on that morning, each region moving west to east
lagged the other by an hour or two in experiencing the highest prices.
$2,000 MISO Illinois
$1,800 NYISO
PJM
TRANSMISSION MAKES THE POWER SYSTEM RESILIENT TO EXTREME WEATHER
$1,600
$1,400
$1,200
COST
$1,000
$800
$600
$400 FIGURE 8. Power prices
by region on morning of
$200
January 7, 2014, during
$0 Polar Vortex
1 3 5 7 9 11 13 15 17 19 21 23 25 27 29 31 33 35 38 39 41 43 45 47 49 51 53 55 57 59 61 63 65 67 69 71
5-MINUTE INTERVALS BETWEEN 6 AM AND NOON ON JANUARY 7, 2014
16The “polar vortex” event in the Midwest in 2019
While an additional 1 GW of transmission between MISO and PJM would have saved around
$2.4 million dollars during this short-lived cold snap, this event was more notable for illustrating
how transmission expansion benefits both interconnected regions. As the extreme cold moved
eastward from MISO to PJM on January 30-February 1, 2019, so did the high power prices, and
transmission flows switched from westward to eastward.
Early on January 30, MISO’s wind output dropped off as temperatures fell below the low
temperature limit for wind turbines, forcing them to shut down. Fortunately, wind output in
PJM was nearly twice as high as average. This higher wind output helped PJM export in excess
of 5,000 MW of power westward to the Midwest grid operator (MISO) during its time of peak
demand, a reversal of the typical eastward flow of power. This shows the value of wind’s
geographic diversity paired with a well-connected grid, creating a more resilient overall system.
Transmission also allowed MISO and PJM to take advantage of the diversity in their electricity
demand patterns, in addition to the diversity in their wind output. PJM electricity demand was
relatively low on the morning of January 30 when MISO experienced its peak demand, while
MISO demand was lower by that evening when PJM experienced its peak demand for the day.
This lagged shift in need can be seen in the chart of power prices below. Because of the lack of
correlation between PJM and MISO in both electricity supply and demand, the $2.4 million in
benefits from an additional GW of transmission are evenly split between the regions.
$600 MISO Illinois
PJM
$500
$400
COST
$300
TRANSMISSION MAKES THE POWER SYSTEM RESILIENT TO EXTREME WEATHER
$200
$100 FIGURE 9. Power prices
by region during 2019
$0 Polar Vortex
1 3 5 7 9 11 13 15 17 19 21 23 25 27 29 31 33 35 38 39 41 43 45 47 49 51 53 55 57 59 61 63 65 67 69 71
HOUR OF EVENT, JANUARY 30-FEBRUARY 1, 2019
This event also revealed other opportunities for expanding transmission to provide consumers with
greater access to low-cost energy resources like wind. For example, when MISO and PJM experi-
enced their highest electricity demand on the morning of January 31, SPP had more than 9,000
MW of wind output, keeping prices low. Similarly, electricity prices in MISO South region were
consistently low throughout January 30 and 31 because that area was not as affected by the
extreme cold. Stronger transmission ties within MISO and between MISO and SPP also could have
benefited consumers by providing them with greater access to low-cost electricity generation.
17PRO-TRANSMISSION POLICIES TO REALIZE
THESE BENEFITS
Like other forms of infrastructure including roads and sewer systems, transmission is often
described as a public good in that many of the benefits of transmission cannot be realized by
the party making the investment. However, in many parts of the country, generation developers
are required to pay for a large share of transmission upgrades. This is much like requiring
a driver entering a congested highway to pay the full cost of adding another lane. Policy
intervention is therefore needed to correct for the resulting underinvestment in transmission
and other public goods. Grid Strategies has labeled the key areas of policy reform needed to
enable greater transmission investment, the “three Ps:” planning, paying for, and permitting
transmission. Potential policies to correct for the underinvestment in transmission include:
Transmission investment tax credit
A bill has been introduced by Senator Heinrich to create a tax credit to incentivize investments
in high-voltage transmission lines. 27 The proposed tax credit is carefully targeted to incentivize
high-voltage long-distance transmission projects that are difficult to build but provide large net
benefits, but not the smaller local grid upgrades utilities are currently able to plan, pay for, and
permit.
A transmission tax credit would provide large net benefits, many times greater than its
cost. Many studies have documented the large net benefits of transmission, 28 though those
benefits are not typically fully accounted for in transmission planning and cost allocation
methodologies. 29 A transmission tax credit particularly benefits lower-income individuals, as
electricity bills make up a disproportionate share of their total spending. A federal tax credit is
TRANSMISSION MAKES THE POWER SYSTEM RESILIENT TO EXTREME WEATHER
analogous to how federal funds are used to build interstate highways — both account for how
those infrastructure investments make the country more resilient against a range of threats and
provide economic benefits across broad geographic areas.
27 A Bill to Amend the Internal Revenue Code of 1986 to Establish a Tax Credit for Installation of Regionally Significant Electric Power Transmission Lines,
S.1016, 117th Congress, (March 25, 2021), available at: https://www.congress.gov/bill/117th-congress/senate-bill/1016/.
28 For example, see SPP, The Value of Transmission, (January 2016), available at: https://www.spp.org/documents/35297/the%20value%20of%20
transmission%20report.pdf; MISO, MTEP17 MVP Triennial Review, (September 2017), available at: https://cdn.misoenergy.org/MTEP17%20MVP%20
Triennial%20Review%20Report117065.pdf; PJM, The Benefits of the PJM Transmission System,” (April 16, 2019), available at: https://pjm.com/-/media/
library/reports-notices/special-reports/2019/the-benefits-of-the-pjm-transmission-system.ashx?la=en.
29 Judy Chang, Johannes Pfeifenberger, and Michael Hagerty, The Benefits of Electric Transmission: Identifying and Analyzing the Value of Investments,
(July 2013), at v, available at: https://cleanenergygrid.org/uploads/WIRES%20Brattle%20Rpt%20Benefits%20Transmission%20July%202013.pdf; Judy
Chang, Johannes Pfeifenberger, Samuel Newell, Bruce Tsuchida, and Michael Hagerty, Recommendations for Enhancing ERCOT’s Long-Term Transmission
Planning Process, (October 2013), Appendix B, available at: http://files.brattle.com/files/6112_recommendations_for_enhancing_ercot%E2%80%99s_long-
term_transmission_planning_process.pdf.
18Anchor tenant
Legislation could be enacted to direct the federal government to directly invest in new
transmission lines as an “anchor tenant” customer, and then re-sell that contracted transmission
capacity to renewable developers and others seeking to use the transmission line. This would
help provide the certainty needed to move transmission projects to construction and overcome
what is called the “chicken-and-the-egg problem,” in which renewable developers and
transmission developers are each waiting for the other to go first due to the mismatch in the
length of time it takes each to complete construction. The Department of Energy can also use
its existing loan-making authority to provide low-cost financing to build transmission.
FERC action
The Federal Energy Regulatory Commission (FERC) has authority over how transmission is
planned and paid for. FERC can use that authority to break the transmission planning and
cost allocation logjams that are preventing large regional and interregional lines from being
built. Specific reforms include developing workable interregional transmission planning and
cost allocation methodologies, accounting for transmission’s resilience benefits in planning
and cost allocation, moving to proactive multi-value transmission planning, and moving away
from requiring interconnecting generators to pay for most transmission upgrades. Legislation
directing FERC to use these authorities could also be helpful.
FERC could also implement a reliability rule requiring a certain amount of interregional
transmission. FERC oversees the North American Electric Reliability Corporation (NERC), which
sets and enforces minimum standards for electric reliability. FERC or NERC could require
minimum levels for interregional transmission interconnections, recognizing their value for
ensuring grid reliability against a range of potential threats. NERC Standard TPL-001 already
requires regions to implement solutions, including transmission additions, if their reliability
planning studies indicate the system is not resilient against the loss of certain large transmission
lines or power plants. 30
TRANSMISSION MAKES THE POWER SYSTEM RESILIENT TO EXTREME WEATHER
FERC can also develop more workable compensation methods for grid-enhancing technologies
that allow more power to be transferred across transmission lines, as this would help to alleviate
the economic and reliability impacts of severe weather.
Streamlined permitting
While most authority for permitting transmission lines is held by states, federal agencies have
authority over lines that cross federal lands. Steps can be taken to streamline and expedite
permitting for transmission, which can currently take a decade or more.
30 NERC, Standard TPL-001-4 – Transmission System Planning Performance Requirements, (n.d.), available at: https://www.nerc.com/files/TPL-001-4.pdf.
19TECHNICAL APPENDIX
Hourly real-time market prices were obtained from each of the RTOs (MISO, 31 PJM, 32 NYISO, 33
ISO-NE, 34 and ERCOT35) for the five severe weather events. Prices for the NYISO Capital zone
were used to represent NYISO prices because of significant transmission congestion in the NYC-
area zones of NYISO. MISO’s Illinois hub was used to represent prices for MISO North, while the
Caldwell pricing node in Entergy’s Texas footprint was used to represent MISO South during the
February 2021 Winter Storm Uri event. TVA-MISO interface prices, obtained from MISO’s price
dataset, were used to represent TVA prices during the February 2021 Winter Storm Uri and
ERCOT 2019 heat wave events. Prices for the ComEd and Dominion zones were used to analyze
the prices in western and eastern PJM during the Bomb Cyclone event. Otherwise, average
LMPs across the entire RTO were used to represent prices in that RTO.
To calculate the net benefit of transmission reducing power prices by increasing supply on
the receiving end of the line during these events, it is also necessary to account for the
corresponding price increase caused by the increased demand on generators on the delivering
end of the transmission line. The price increase on the delivering end is generally much smaller
than the price decrease on the receiving end because the electricity supply curve slopes much
more steeply upward when demand is high. For example, the relationship between MISO
electricity prices and demand during the January 2014 Polar Vortex event is shown in the chart
below. Prices remain relatively low until demand exceeds 90 GW, at which point prices ramp up
dramatically as demand increases. As a result, delivering an additional GW from a region with
low demand will not dramatically raise prices there, while prices will be dramatically reduced in
the receiving region where demand is high.
TRANSMISSION MAKES THE POWER SYSTEM RESILIENT TO EXTREME WEATHER
31 MISO, “Historical Annual Real-Time LMPs,” (n.d.), available at: https://www.misoenergy.org/markets-and-operations/real-time--market-data/
market-reports/#nt=%2FMarketReportType%3AHistorical%20LMP%2FMarketReportName%3AHistorical%20Annual%20Real-Time%20LMPs%20
(zip)&t=10&p=0&s=MarketReportPublished&sd=desc.
32 PJM, “Settlements Verified Hourly LMPs,” (n.d.), available at: https://dataminer2.pjm.com/feed/rt_da_monthly_lmps.
33 NYISO, “Real-Time Market LBMP – Zonal,” (n.d.), available at: https://www.nyiso.com/custom-reports?report=rt_lbmp_zonal.
34 ISO New England, “Final Real-Time Hourly LMPs,” (n.d.), available at: https://www.iso-ne.com/isoexpress/web/reports/pricing/-/tree/lmps-rt-hourly-
final.
35 ERCOT, “Historical RTM Load Zone and Hub Prices,” (n.d.), available at: http://mis.ercot.com/misapp/GetReports.
do?reportTypeId=13061&reportTitle=Historical%20RTM%20Load%20Zone%20and%20Hub%20Prices&showHTMLView=&mimicKey.
20$8.00
$7.00
$6.00
$5.00
MISO IL PRICES
$4.00
$3.00
$2.00
FIGURE 10. Relationship
$1.00 between MISO demand
and power prices during
$0 2014 Polar Vortex
65,000 70,000 75,000 80,000 85,000 90,000 95,000 100,000 105,000 110,000
MISO ELECTRICITY DEMAND, MW
Demand data for MISO, 36 TVA, 37 and other delivering regions were combined with the price
data obtained earlier to create similar scatterplots for those delivering regions. Two linear best-
fit slopes were added to each scatterplot, one on the flat part of the slope for periods of low
demand, and one on the steep part of the slope for periods of high demand. For example, for
the chart above, when MISO demand is greater than 90 GW, the linear best-fit slope indicates
that an additional GW of demand increases prices by $15.30/MWh; however, when demand
is less than 90 GW, each GW of demand increases prices by only $0.80/MWh. Those linear
functions were then used to model the increase in prices in the delivering region, starting from
actual demand and prices and then increasing demand by 1 GW to account for exports using
the new transmission. This accounts for how increasing demand on the delivering end of the
transmission slightly reduces the benefits of transmission.
TRANSMISSION MAKES THE POWER SYSTEM RESILIENT TO EXTREME WEATHER
36 MISO, “Historical Daily Forecast and Actual Load by Local Resource Zone,” (n.d.), available at: https://www.misoenergy.org/markets-and-operations/
real-time--market-data/market-reports/#nt=%2FMarketReportType%3ASummary%2FMarketReportName%3AHistorical%20Daily%20Forecast%20and%20
Actual%20Load%20by%20Local%20Resource%20Zone%20(xls)&t=10&p=0&s=MarketReportPublished&sd=desc.
37 EIA, “Demand for Tennessee Valley Authority (TVA), Hourly – UTC Time,” (n.d.), available at: https://www.eia.gov/opendata/
qb.php?category=3390009&sdid=EBA.TVA-ALL.D.H.
21You can also read