How Europe's biggest polluters became their own regulators - tarquinia
←
→
Page content transcription
If your browser does not render page correctly, please read the page content below
How Europe’s biggest
polluters became their
own regulators
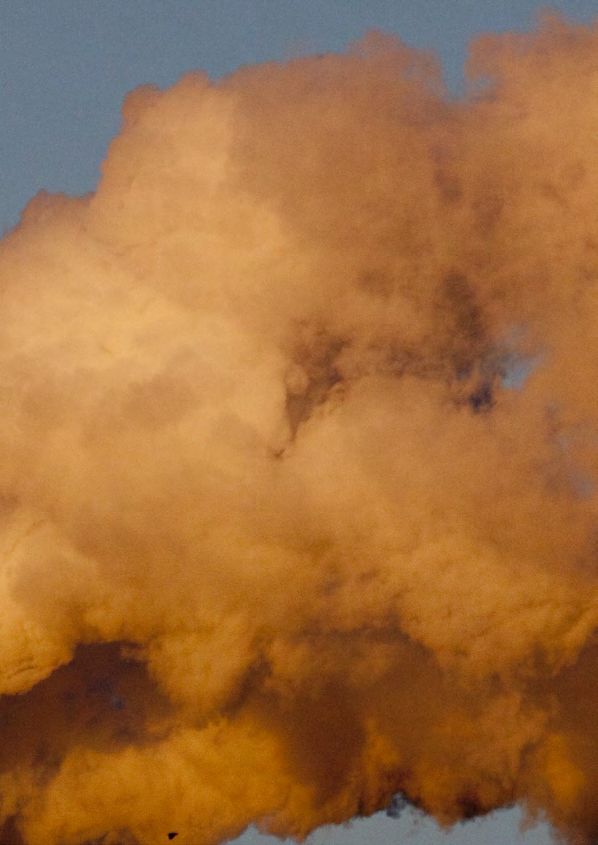
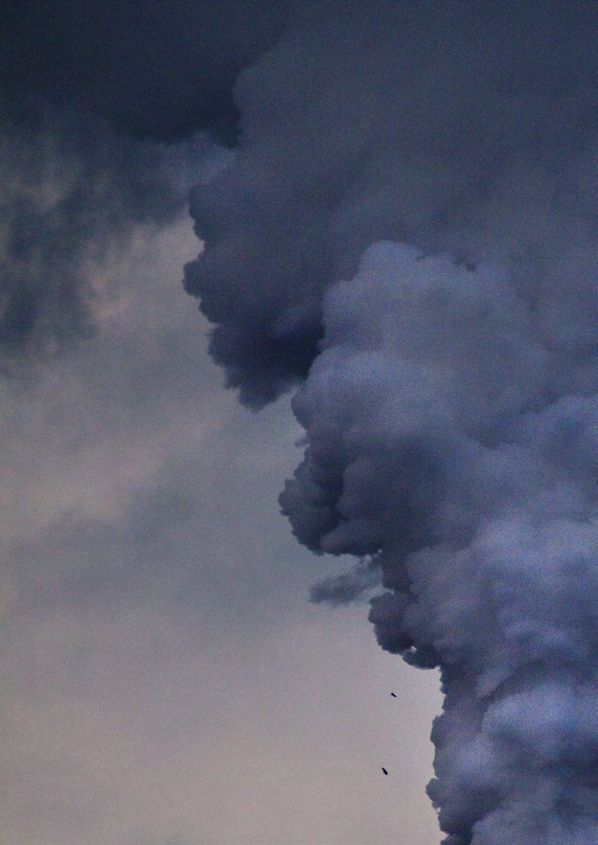
SMOKE & MIRRORS
How Europe’s biggest polluters became their own regulators

Written by:
Lauri Myllyvirta
Edited by:
Joris den Blanken, Mark Breddy
Acknowledgements:
Christian Schaible (European Environmental Bureau)

Creative Design and Graphic:
Michal Stassel / Greenpeace
Graphic on page 10-11 taken from Greenpeace report
Silent Killers, Why Europe must replace coal power with green energy
Sue Cowell / Atomo Design

Front and back cover photograph:
© Les Stone / Greenpeace

For more information contact:
pressdesk.eu@greenpeace.org
Published in March 2015 by
Greenpeace European Unit
Belliardstraat 199 Rue Belliard
1040 Brussels, Belgium

www.greenpeace.eu
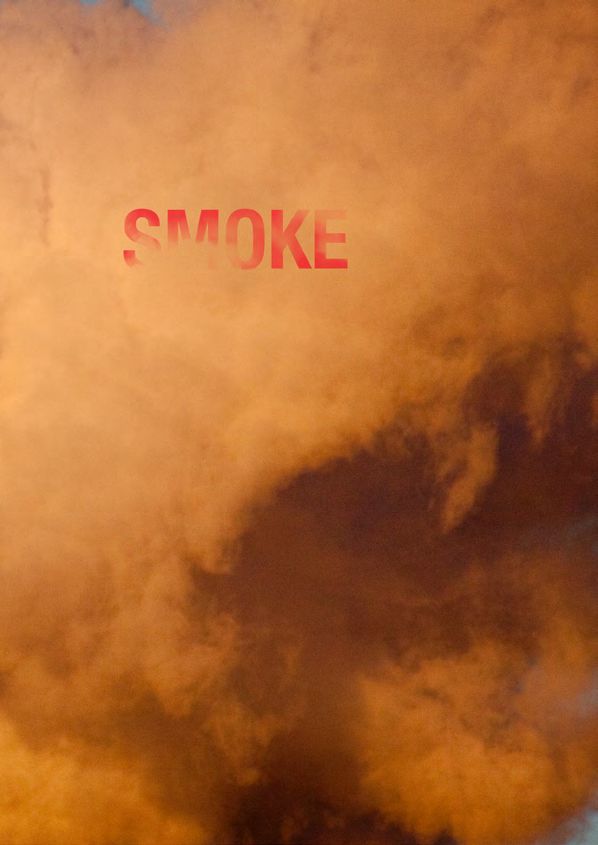
Table of contents
Introduction                                                               4
PART I. EU coal air pollution standards falling behind China, Japan
        and the United States                                              7
        Air pollution standards under the Industrial Emissions Directive    8
        Health impacts of coal plant air pollution                          9
        Countries with stricter power plant performance                    11

Part II. Exposing industry bias in the EU’s decision-making
         process on power plant pollution standards                        25
         Who decides and when?                                             26
         Industry bias in the process                                      28

Conclusions                                                                36
        Time for EU decision-makers to intervene                           36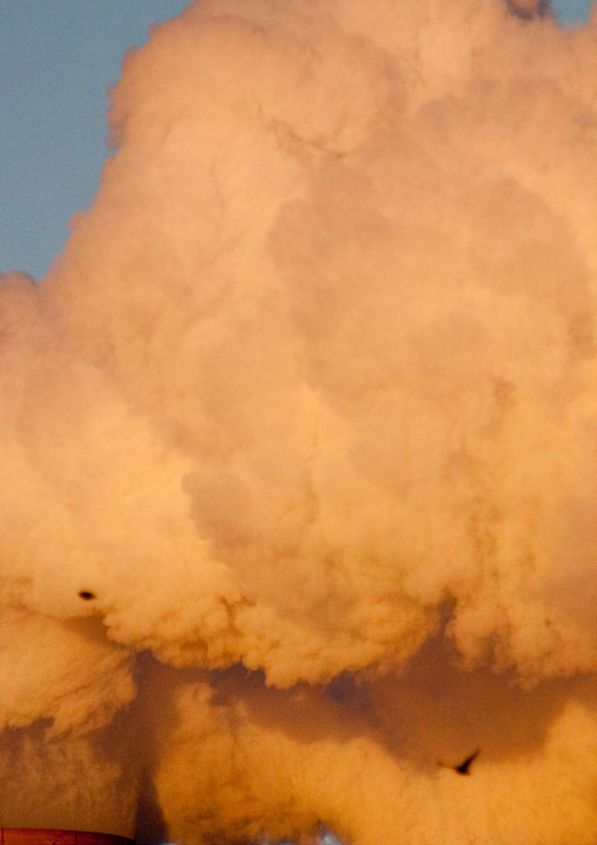
SMOKE & MIRRORS

Introduction
Coal causes irreparable damage to the environment, people’s health and communities
around the world. Coal-fired power stations are the largest source of sulphur dioxide
and mercury emissions in Europe and one of the largest industrial sources of emissions
of nitrogen oxides, arsenic, lead and cadmium. Air pollution from EU’s coal-fired power
stations caused an estimated 22,300 premature deaths in 20101, as well as exacerbating
asthma and contributing to dangerous levels of mercury found in the blood of thousands of
babies born in Europe.
In an attempt to reduce air pollution, the European Union is updating air pollution
standards for industrial installations, including for coal power plants. In March 2015, the
European Integrated Pollution Prevention and Control (IPPC) Bureau (an organisation
hosted by the European Commission’s Joint Research Centre)2 is expected to define
best available techniques (BAT), and the ranges of related emission levels that can be
achieved. Various expert bodies will feed their own definitions of best available techniques
and related emission ranges into the so-called “Seville process”. The European IPPC
Bureau will then issue a proposal that EU member states are expected to vote on by the
end of 2015. Formal adoption by the European Commission and publication in the EU
Official Journal should take place by early 2016. This process is mandated under the EU’s
Industrial Emissions Directive (IED).
EU member states will have four years to update legally binding environmental permits
for coal-plants, based on BAT and related emission ranges. The highest value of the
BREF emissions range is therefore the maximum emission level for coal plants and other
installations from 2020 onwards. This report therefore refers to the highest value in the
range as the “emission limit”.
Based on a draft of the proposal, this report demonstrates that industrial air pollution
performance standards currently considered by the European IPPC Bureau are much
weaker than the standards in force in China, Japan and the United States. The report
also shows that existing coal power plants both within and outside the European Union
already have much more demanding emission limits or better real-world emission control
performance than would be required by the draft IPPC Bureau proposal. This makes it clear
that the draft proposal would allow much more pollution than would result from the use of
the best available techniques.

Part 1 of this report – “Smoke” – compares the considered EU air
pollution standards with other countries.
Part 2 – “Mirrors” outlines the functioning of the EU decision-making
process and demonstrates the process is strongly biased towards
industry interests.

1 University of Stuttgart research, in Greenpeace (2013), Silent Killers: http://www.greenpeace.org/international/Silent-Killers/
2 For more information: http://eippcb.jrc.ec.europa.eu/about/more_information.html

                                                                               4
INTRODUCTION

© Les Stone / Greenpeace

                           5
6
PART 1

EU coal air pollution
standards falling behind
China, Japan and the
United States

© Les Stone / Greenpeace

                           7
SMOKE & MIRRORS

Air pollution standards under the
Industrial Emissions Directive
                  The Industrial Emissions Directive is an EU law aimed at reducing air pollution from various
                  industrial sources throughout the European Union. Industrial installations, including coal-
                  fired power plants must have an environmental permit based on the requirements of the
                  IED.
                  The permit includes binding emission limits (e.g. for sulphur dioxide, nitrogen oxides)
                  based on what the Best Available Techniques (BATs) can achieve. The BATs are defined in
                  so-called BAT reference documents (BREFs).
                  The preparation of the BREFs is co-ordinated by the European IPPC Bureau of the Institute
                  for Prospective Technology Studies at the EU Joint Research Centre in Seville (Spain).
                  A new proposal for the BREF for Large Combustion Plants (LCP BREF) will be issued this
                  year, defining emission limits for coal plants. This is the likely timeline for the process:

                  •   March 2015: European IPPC Bureau releases proposal with definition of BATs and air
                      pollution limits.
                  •   May 2015: Technical Working Group (a body composed of government, industry and
                      civil society experts) gives its opinion.
                  •   June 2015: The Industrial Emissions Directive Forum (another expert body with
                      member states, industry and NGO representatives) gives its opinion.
                  •   September 2015: EU member state committee chaired by the European Commission
                      (under so-called EU comitology rules) votes on the proposal by qualified majority.
                  •   January 2016: Formal adoption by the European Commission and publication of the
                      LCP BREF/BAT conclusions in the Official Journal of the EU.
                  •   January 2016 to January 2020: National implementation process (process depends on
                      national law and procedures).
                  •   January 2020: Deadline by when the new requirements need to be applied at plant
                      level.

                                                     8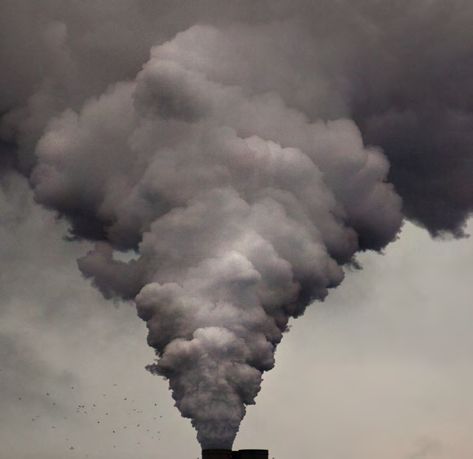
I. EU COAL AIR POLLUTION STANDARDS FALLING BEHIND CHINA, JAPAN AND THE UNITED STATES

Health impacts of coal plant air
pollution
Exposure to toxic particulate matter (PM2.5) is the largest environmental health threat in
Europe, increasing risk of death from heart disease, respiratory diseases and lung cancer,
and shortening life expectancy by 6-12 months in most European countries3. PM2.5 was
recently identified as a leading environmental cause of cancer deaths by the World Health
Organisation’s cancer agency4.
Sulphur dioxide (SO2), nitrogen oxides (NOX) and dust emissions from coal-fired power
plants all contribute to PM2.5 exposure – dust emissions directly, and SO2 and NOX through
the formation of secondary sulphate and nitrate particles through chemical reactions in
the atmosphere. These secondary particles make up a large portion of total PM2.5 mass
in Europe5. Research by Stuttgart University commissioned by Greenpeace estimates that
emissions from coal-fired power plants in the EU were responsible for 22,300 premature
deaths in 20106. Strict limits on air pollution from coal-fired power plants could significantly
reduce this toll, saving the lives of thousands of Europeans.
Another coal-induced air pollution threat comes from mercury. Coal-fired power plants
are the largest source of air emissions of toxic mercury in the EU and the largest source
of mercury fallout into Europe. 200,000 babies are born each year in the EU with mercury
levels that are known to harm their mental and neurological development7.

© Lu Guang / Greenpeace

3 EEA (2007), Loss of statistical life expectancy attributed to anthropogenic contributions to PM2.5, 2000 and 2020: http://www.eea.
europa.eu/data-and-maps/figures/loss-of-statistical-life-expectancy-attributed-to-anthropogenic-contributions-to-pm2-5-2000-and-2020
4 WHO (2013), Outdoor air pollution a leading environmental cause of cancer deaths: http://www.euro.who.int/en/health-topics/environ-
ment-and-health/urban-health/news/news/2013/10/outdoor-air-pollution-a-leading-environmental-cause-of-cancer-deaths
5 E.g. inorganic secondary particles make up half of total PM2.5 in Poland and the UK: Werner et al 2013. Differences in the Spatial Distri-
bution and Chemical Composition of PM10 Between the UK and Poland. http://link.springer.com/article/10.1007/s10666-013-9384-0
6 Research by Stuttgart University in Greenpeace (2013) Silent Killers report: http://www.greenpeace.org/international/Silent-Killers/
7 Bellanger et. al. (2013) Economic benefits of methylmercury exposure control in Europe: Monetary value of neurotoxicity prevention in
Environmental Health 2013, 12:3 http://www.ehjournal.net/content/12/1/3

                                                                                      9
SMOKE & MIRRORS          How coal-fired
                         power plants can
                         make you sick
                      Coal-fired power plants expose people to
                      toxic particles, ozone and heavy metals. The                                    MICROSCOPIC                                           OZONE
                      most serious health impacts are due to                                           PARTICLES
                      microscopic particles (PM2.5) formed from
                      emissions of sulphur and nitrogen oxides, dust
                      and soot. These particles penetrate deep into
                      the lungs and into the bloodstream, causing
                      deaths and numerous health problems.

                                                                                                         SULPHUR
                                                                                                       DIOXIDE (SO2)                                        OZONE (O3)

                                                                        NITROGEN                                      TOXIC
                                                                       OXIDES (NOX)                                  METALS

                                                                                                                                        CADMIUM
                                  SOOT AND                                                                   NICKEL
                                    DUST                                      ARSENIC

                                                               LEAD                          CHROMIUM

                                            MERCURY

                                                                                                                                   Lung cancer
                                                                                                                                   Asthma attacks
                                                                                                                                   Infections and cough
                                                                                                                                   Impaired lung function
                                                                                                                                   Impaired lung
                                                                                                                                   growth in children

                                                                                                                                  Inflammation
                                                                                                                                  Increased coagulation
 KEY                                                                                                                              Blood pressure
       Particle pollution
       Ozone
       Toxic metals

Source: Rückerl R et al (2011). Health effects of particulate air pollution: A review of epidemiological evidence. Inhalation Toxicology 23(10): 555–592;
Pope III CA & Dockery DW (2006). Health Effects of Fine Particulate Air Pollution: Lines that Connect. J Air & Waste Manage. Assoc. 56:709 –742;
US EPA: Six Common Air Pollutants. www.epa.gov/airquality/urbanair; US EPA: Integrated Risk Information System (IRIS). www.epa.gov/IRIS
                                                                                  10
I. EU COAL AIR POLLUTION STANDARDS FALLING BEHIND CHINA, JAPAN AND THE UNITED STATES
Stroke
Decreased IQ
Diseases of
central nervous
system
Heart attack
Heart rate variability
Heart disease
Lower birth weight
Impaired foetal growth
Premature birth
Impaired mental and
physical development
Decreased
sperm quality
11SMOKE & MIRRORS
Countries with stricter power plant
performance
Greenpeace has compared the emission limits for sulphur dioxide (SO2),
nitrogen oxides (NOX), particulate matter (PM), and mercury (Hg) in the
European IPPC Bureau draft proposal8 with legal requirements and
emission rates of best-performing power plants in China, Japan and the
United States. As EU emission limit values are legally required to be in
line with best available techniques, these examples should define the
bare minimum of the EU’s new limits.
Comparing the air pollution standards internationally
The draft European IPPC bureau proposal prescribes a range of emission limit
values, but in practice the higher end of the range is applied by national regulation
and regulators most of the time. Therefore our comparison looks at the highest
allowed emission limit values in the draft IPPC bureau proposal.
Different countries base their standards on different time periods, ranging from
hourly average to yearly average. This affects the actual emission levels resulting
from a standard. If a power plant has to stay below a certain limit for every hour of
the year, the operator has to leave room for hour-to-hour variation, resulting in a
much lower annual average than if the same limit has to be met on yearly average
basis.
Different countries also use different units: the U.S. generally sets limits based
emissions per unit of electricity produced, while the EU and China regulate pollutant
concentration per cubic meter of flue gas. Japan uses parts per million in flue
gas, and uses slightly different reference conditions for flue gases. All limits are
converted to the standards used in the EU to enable comparisons.
8 European IPPC Bureau: Best Available Techniques (BAT) Reference Document for the Large Combustion
Plants Industrial Emissions Directive. 2010/75/EU. Draft 1 (June 2013).
12I. EU COAL AIR POLLUTION STANDARDS FALLING BEHIND CHINA, JAPAN AND THE UNITED STATES
© Les Stone / Greenpeace
13SMOKE & MIRRORS
Sulphur dioxide (SO2)
Draft EU standard: 130 mg/Nm3 for existing plants, 75 mg/Nm3 for new plants
(annual average); 220 mg/Nm3 for existing plants, 110 mg/Nm3 for new plants
(daily average)
China9: 100 mg/Nm3 for existing plants, 35 mg/Nm3 for new plants in key
economic regions (hourly average, much more demanding than annual average);
best performing operating plants 9-25 mg/Nm3
Japan: National annual average of operating coal power plants10 is at 30-35
mg/ Nm3
United States: Best performing operating power plants11 5-15 mg/Nm3, national
standard for new units12 50-60 mg/Nm3; strictest permit condition for new plants13
22 mg/Nm3 (30-day average)
Best performing plants in the EU: 20-60 mg/Nm3 (annual average)
Coal-fired power plants are the largest source of SO2 emissions in Europe. The draft EU
standards considered by the European IPPC Bureau would allow significantly higher
pollution levels than outside the EU.
On hourly average basis (as used in China), the EU’s considered limit is 200 mg/Nm3
for existing plants. China has recently required power plants totalling a capacity of
approximately 700 GW – several times the entire coal energy capacity in Europe – to meet a
limit of 100 mg/Nm3 14. China will also require all new power plants in key economic regions
to meet a limit of 35 mg/Nm3.
There are several existing coal-fired power plants in Europe with SO2 emission levels less
than half of those required by the proposed standard15.
9 Ministry of Environment 2011: Emission standard of air pollutants for thermal power plants (GB 13223-2011).
10 Calculated from
http://www.fepc.or.jp/english/library/energy_environment/__icsFiles/afieldfile/2011/02/22/kankyo_E_2010.pdf
11 Calculated from
http://www.fepc.or.jp/english/library/energy_environment/__icsFiles/afieldfile/2011/02/22/kankyo_E_2010.pdf
12 http://www.epa.gov/airquality/powerplanttoxics/actions.html
13 Permits for AES Puerto Rico and Dominion VCHEC.
14 The limit was brought down to 100 mg/Nm3 for plants originally designed for emissions of 400-1200 mg/Nm3. Ministry of Environment
2003: Emission standard of air pollutants for thermal power plants. GB13223 —2003.
15 Emission levels for European plants are calculated as yearly averages based on air pollutant and CO2 emissions reported to the E-PR-
TR database. Average emission concentration is obtained as annual pollutant emissions divided by the total annual flue gas volume. The
ratio of total standardized dry flue gas volume to CO2 emissions is effectively constant, enabling this calculation to be carried out; the ratio is
calculated as 3563 Nm3/tCO2 from EEA technical report 4/2008. Values reported are averages for 2010-2012.
14I. EU COAL AIR POLLUTION STANDARDS FALLING BEHIND CHINA, JAPAN AND THE UNITED STATES
mg/Nm3
399.6
140
120
100
80
60
40 Greenpeace demand
35
20
0
Italy
Torrevaldaliga Nord
Nordjyllandsværket
Amagerværket
Netherlands
Hemweg
Netherlands
Buggenum
Germany
SWM Nord
Germany
limit
EU current
average*
Denmark
Denmark
KNG Rostock
EU Proposed
*excluding Bulgaria and Romania
Figure 1: Examples of EU power plants with SO2 emissions far below the proposed standard
Source: Greenpeace analysis (2015). Emission levels for the plants are calculated as yearly averages based on air pollutant and CO2
emissions reported to the E-PRTR database16.
15SMOKE & MIRRORS
327.9
mg/Nm3
180
160
140
120
100
80
60 Greenpeace demand
50
40
20
0
Italy
Torrevaldaliga Nord
Nordjyllandsværket
Amagerværket
Netherlands
Hemweg
Netherlands
Buggenum
Germany
Schwarze Pumpe
limit
EU current
average
Denmark
Denmark
EU Proposed
Figure 2: Examples of EU power plants with NOX emissions far below proposed standard.
Source: Greenpeace analysis (2015). Emission levels for the plants are calculated as yearly averages based on air pollutant and CO2
emissions reported to the E-PRTR database16.
16I. EU COAL AIR POLLUTION STANDARDS FALLING BEHIND CHINA, JAPAN AND THE UNITED STATES
Nitrogen oxides (NOX)
Draft EU standard: 180 mg/Nm3 for large16 existing plants, 100 mg/Nm3 for
new plants (annual average)
China: 100 mg/Nm3 for existing plants, 50 mg/Nm3 for new plants in key
economic regions (hourly); best performing operating plants 30-50 mg/Nm3
(annual average)
Japan: National annual average of operating coal power plants17: 60-70 mg/Nm3;
strictest permit condition for new plant18: 40 mg/Nm3
United States: Best performing operating power plants19 45-70 mg/Nm3
Best performing plants in the EU: 50-80 mg/Nm3 (annual average)
The NOx limits considered by the European IPPC Bureau would allow many plants to avoid
the installation of Selective Catalytic Reduction (SCR), the most effective way to control
NOX emissions. An important added benefit of installing SCR on coal-fired plants is a
reduction in mercury emissions.
China is approaching an 80% penetration of NOX control devices, predominantly SCR,
and prescribes a 100 mg/Nm3 emission limit. These devices were installed in power
plants totalling a capacity of 130GW in 2013 alone – more than the EU’s entire coal energy
capacity20. New power plants in China’s key economic regions, with 30% of its current
coal-fired generation capacity, are required to meet a limit of 50 mg/Nm3, which is lower
than even the lower end of the 65-100 mg/Nm3 range proposed for new power plants by
the European IPPC Bureau.21
A significant number of existing coal-fired power plants operating within and beyond
EU borders operates with much lower emissions than the emission limit considered in
the European IPPC Bureau draft proposal. This makes it difficult to argue that the draft
proposal is based on correct definitions of best available technology.
There are also several existing coal-fired power plants in Europe with NOx emission levels
less than half of those required by the proposed standard (see graph below).
The application of SCR is crucial to achieving low NOX emissions. Documents obtained
by Greenpeace UK under access to information laws show that lax emission standards
are already leading to a failure to require coal-fired power plants with large NOX emissions
to install control equipment. Coal-power plant operator E.ON filed complaints with the
UK regulator saying that other operators were gaining an unfair advantage by dropping
investments against air pollution that E.ON had already undertaken at its UK plant.
16 Rated at 100 megawatts thermal or above (typically approximately 35 megawatts electric); plants between 50 and 100 megawatts
have an even more lenient proposed limit.
17 Calculated from http://www.fepc.or.jp/english/library/energy_environment/__icsFiles/afieldfile/2011/02/22/kankyo_E_2010.
pdf
18 http://www.masterresource.org/2010/11/clean-coal-plant-today/
19 Williams J., (2014). America’s best coal plants, in: Power Engineering https://www.advancedenergyforlife.com/sites/default/files/
America%27s%20Best%20Coal%20Plants%20Power%20Engineering%20072114_0.pdf
20 Chinese Ministry of Environmental Protection (2014), Annual Work Report on Reducing Emissions.
21 Chinese Ministry of Environmental Protection (2011), Emission standard of air pollutants for thermal power plants. GB13223-2011: http://
www.zhb.gov.cn/gkml/hbb/bgg/201109/W020110923323714233980.pdf A partial summary is available at http://switchboard.nrdc.org/
blogs/bfinamore/NRDC%20Unofficial%20English%20Summary.docx.
17SMOKE & MIRRORS
Particulate matter (PM)
Proposed limit: 20 mg/Nm3 for large existing plants, 10 mg/Nm3 for new (daily
average basis)
Japan, best performing plants22: 4-5 mg/Nm3
China, performance achieved through retrofit23: 5 mg/Nm3
The proposed draft emission limits appear designed to enable power plants to forego the
installation of the Best Available Technology for PM control: fabric filters (baghouses) with
high removal efficiency. Baghouses are routinely required in, amongst others, Japan and
the United States.
Baghouses also have a higher mercury removal efficiency than the more commonly used
electrostatic particulate control devices.
Moreover, there are several existing coal-fired power plants operating in Europe with
emission levels more than 75% below the proposed standard, exposing the claim that the
proposal represents best available technology as false.
mg/Nm3
15
10
5
Greenpeace demand
3
0
Torrevaldaliga
Nord
Italy
Netherlands
Hemweg
United Kingdom
Ratcliffe-on-Soar
Germany
Schwarze Pumpe
Germany
Lippendorf
limit
EU current
average
EU proposed
Figure 3: Examples of EU power plants with PM emissions far below proposed standard.
Source: Greenpeace analysis (2015). Emission levels for the plants are calculated as yearly averages based on air pollutant and CO2
emissions reported to the E-PRTR database16.
22 Hitachinaka, Hirono and Shin Isogo power plants. http://www.neaspec.org/sites/default/files/S2_17pm_Matsuda(TEPCO).pdf;
http://www.aecen.org/sites/default/files/isogo_brochure.pdf
23 Guohua Sanhe 1 unit http://energy.people.com.cn/n/2014/0818/c71661-25481657.html
18I. EU COAL AIR POLLUTION STANDARDS FALLING BEHIND CHINA, JAPAN AND THE UNITED STATES
Mercury (Hg)
Draft EU standard for lignite and sub-bituminous coal: 10 μg/Nm3 for
existing plants, 5 μg/Nm3 for new plants (annual average)
Draft EU standard for bituminous coal: 6 μg/Nm3 for existing plants, 2 μg/Nm3
for new plants (annual average)
U.S. hard coal: approximately 1.5 μg/Nm3 for existing plants firing hard coal and
4.8 ug/Nm3 for existing plants firing lignite24. 0.5 μg/Nm3 for new hard coal power
plants25 (30 or 90-day average); best performing lignite plants26 with mercury
capture: 0.9-1.2 μg/Nm3
Canada: 1 μg/Nm3 for new plants firing bituminous coal
Coal-fired power plants are the largest source of mercury emissions into the air in Europe.
The mercury limits considered for the EU by the IPPC are so lenient that an estimated 85%
of coal-fired power plants in the EU meet them already, including many of the power plants
with the highest yearly emissions. Many more will meet the limits as a result of retrofitting
to limit SO2 and NOx emissions. As a result, the estimated reduction in mercury emissions
is approximately 20%. Around 13 tonnes of mercury will continue to be emitted from coal
power plants each year.
The U.S. Environmental Protection Agency (EPA) recently set new mercury limits of
approximately 1.5 μg/Nm3 for hard coal and and 4.8 μg/Nm3 for lignite for operating power
plants, and 0.5 μg/Nm3 for new hard coal power plants.27
Canada has also required much more stringent action, issuing regulation28 in 2006 that
mandated a 52-58% reduction in mercury emissions from coal plants by 2010, compared to
2003-2004 level, and requiring new power plants firing bituminous coal to meet a mercury
emission limit of approximately 1 μg/Nm3.
The European Environmental Bureau has also compiled data identifying twenty coal-
fired power plants with mercury emission rates less than half of those required by the
considered standard, despite not having mercury control requirements.
24 Existing coal-fired power plants in the U.S. can choose between different compliance strategies that regulate different pollutants. The
default option is to comply with emission limits for particulate matter, hydrogen chloride and mercury, with the alternative being to comply
with limits on SO2 and a suite of 11 toxic metals, not including mercury. The mercury limits refer to the default compliance strategy, and are
clearly levels that the U.S. EPA considers achievable in old power plants.
25 Environment Protection Agency 2013: 40 CFR Parts 60 and 63 [EPA–HQ–OAR–2009–0234; EPA–HQ–OAR–2011–0044; FRL–9789–
5] RIN 2060–AR62. Reconsideration of Certain New Source Issues: National Emission Standards for Hazardous Air Pollutants From Coal-
and Oil-Fired Electric Utility Steam Generating Units… http://www.gpo.gov/fdsys/pkg/FR-2013-04-24/pdf/2013-07859.pdf
26 Measurement data from Oak Grove 1 coal-fired unit obtained by Sierra Club: Luminant Power Jan 4, 2013: Mercury CEMS RATA Test
Report Submittal; PowerMag Mar 1, 2014: The Role of Activated Carbon in a Comprehensive MATS Strategy. http://www.powermag.
com/the-role-of-activated-carbon-in-a-comprehensive-mats-strategy/?pagenum=3
27 Environmental Protection Agency: 40 CFR Part 63. National Emission Standards for Hazardous Air Pollutants: Coal- and Oil-Fired
Electric Steam Generating Units. Direct final rule. [EPA–HQ–OAR–2009–0234; FRL–9919–21–OAR]. RIN 2060–AS39. Conversions based on
factors in EEA 2008: Air pollution from electricity-generating large combustion plants. Technical report No 4/2008.
28 Canadian Council of Ministers of the Environment 2006: Canada-wide standards for Mercury Emissions from coal-fired power
generation plants http://www.ccme.ca/files/Resources/air/mercury/hg_epg_cws_w_annex.pdf Conversion as above.
19SMOKE & MIRRORS
μg/m3
5
4
3
2
Greenpeace demand
1
0
Brindisi BR III
Brindisi BR II (BR4)
Ibbenbueren
Federico II
Fusina
Torrevaldaliga Nord
Fiume Santo
Detmarovice
Voerde Block A
Nordjyllandsværket U3
Staudinger 5
Staudinger 5
Wilhelmshaven
Proposed minimum
standard
EU current
average
Gersteinwerk WERNE
Figure 4: Examples of hard coal power plants in the EU with mercury emissions far below the
proposed limits.*
Source: European Environmental Bureau data compilation (2014).
* An Italian power plant was removed from the graph on 6 March 2015 due to concerns about reliability of reported data
Moreover, the considered limit would not require well-established techniques to limit
mercury emissions, such as activated carbon injection, that can reduce emissions further
at low costs. Activated carbon systems are in use in numerous coal-fired power plants in
the U.S.29, and manufacturers of these systems are guaranteeing mercury capture rates of
at least 90%30, as compared to a typical capture rate of around 50% for a power plant with
particulate matter controls and an SO2 scrubber, but no dedicated mercury controls.
Importantly, the European IPPC Bureau draft does not require continuous monitoring of
mercury emissions from mid-size power plants (I. EU COAL AIR POLLUTION STANDARDS FALLING BEHIND CHINA, JAPAN AND THE UNITED STATES
μg/m3
8
6
4
2
0
Proposed
Czech Republic
Tusimice
Germany
Germany
Neurath, Block E
Czech Republic
minimum
standard
Neurath, Block A
Teplarna Tabor
Figure 5: Examples of lignite power plants in the EU with mercury emissions far below the
proposed limits.*
Source: European Environmental Bureau data compilation (2014).
* An Italian power plant was removed from the graph on 6 March 2015 due to concerns about reliability of reported data
Setting an almost meaningless mercury limit and labelling it as “Best Available” emission
controls is all the more irresponsible in the context of the global mercury standards that will
be defined under the Minamata Convention on Mercury31 in 2015. The Minamata Conven-
tion standards will apply to other large mercury emitters that have signed the Convention.
Lax EU mercury limits could set a dangerous precedent with global implications.
31 The Minamata Convention on Mercury is a global treaty to protect human health and the environment from the adverse effects of
mercury.
21SMOKE & MIRRORS
Best performance examples in China
Looking beyond Europe’s borders we also find a large number of power plants that perform
better than the emission limits considered in the draft IPPC Bureau proposal.
Greenpeace collected emission measurements from thirteen Chinese coal-fired generating
units at four different power stations32. These units originally had much higher emission
levels, but have recently installed or upgraded emission control devices. They are
representative of the hundreds of power plants that have been retrofitted in China in recent
years. The EU’s proposed new SO2 and NOx limits are 2-5 times as high as emission levels
already achieved in China.
(mg/Nm3)
160
120
80
40
0
China: current limits EU: Proposed limits, China: new plants EU: Proposed
for existing plants large existing plants in key economic limits,
regions new plants
NOX
SO2
Figure 6: Comparing SO2 and NOX regulation in the EU and China.
Sources: Proposed draft EU Best Available Technologies document, China’s currently applicable national emission standards (GB13223-
2011).
The widespread deployment in China of NOX control technologies such as SCR has
resulted in a significant number of Chinese plants with NOX emissions lower than the
considered EU emission limit.
32 The data was collected from 1 July 2014, when China’s new emission standards came into force, until 15 December 2014. Sources for
the data are http://nmgepb.gov.cn:8088/enterprisemonitor/, http://app.zjepb.gov.cn:8089/nbjcsj/, http://202.136.217.188:8800/.
22I. EU COAL AIR POLLUTION STANDARDS FALLING BEHIND CHINA, JAPAN AND THE UNITED STATES
mg/Nm3
120
100
80
60
40
20
0
Shangdu 6
Guodian Beilun 1
Guodian Beilun 2
Guodian Beilun 6
Guodian Beilun 7
Waigaoqiao 5
Waigaoqiao 6
Waigaoqiao 7
Waigaoqiao 8
limit
EU proposed
Figure 7: Average SO2 emission levels of a number of power plants in China.
Source: Key industries’ emission monitoring data platforms of the provincial Environmental Bureaus33. Data was compiled for the period from
1 July 2014 (China’s new emission standards in to force) to 15 December 2014.
mg/Nm3
160
140
120
100
80
60
40
20
0
Shangdu 1
Shangdu 2
Shangdu 3
Shangdu 4
Shangdu 6
Guodian Beilun 1
Guodian Beilun 2
Guodian Beilun 6
Guodian Beilun 7
Waigaoqiao 5
Waigaoqiao 6
Waigaoqiao 7
Waigaoqiao 8
EU proposed limit
Figure 8: Average NOX emission levels of a number of power plants in China.
Source: : Key industries emission monitoring data platforms of the provincial Environmental Bureaus33. Data was compiled for the period
from 1 July 2014 (China’s new emission standards in to force) to 15 December 2014.
23SMOKE & MIRRORS
24PART 2 Exposing industry bias in the EU’s decision- making process on power plant pollution standards © Les Stone / Greenpeace
SMOKE & MIRRORS

Who decides and when?
                  The Industrial Emissions Directive (IED) is an EU law aimed at reducing air pollution from
                  various industrial sources throughout the European Union. Industrial installations, including
                  coal-fired power plants must have an environmental permit based on the requirements of
                  the IED.
                  The permit includes binding emission limits (e.g. for sulphur dioxide, nitrogen oxides)
                  based on what the Best Available Techniques (BATs) can achieve. The BATs are defined in
                  so-called BAT reference documents (BREFs).
                  A new proposal for the BREF for Large Combustion Plants (LCP BREF) will be issued this
                  year, defining emission limits for coal plants and other large industrial installations.
                  Below you find a description of the main decision-making bodies in the so called “Seville
                  process” that leads to the adoption of the new LCP BREF, and an indicative timeline.

                  European IPPC Bureau
                  The preparation of the LCP BREF is co-ordinated by the European IPPC Bureau of the
                  Institute for Prospective Technology Studies at the EU Joint Research Centre in Seville
                  (Spain).
                  The European IPPC Bureau is located under the Sustainable Production and Consumption
                  Unit, one of the seven scientific institutes of the European Commission’s Joint Research
                  Centre (JRC).

                  Technical Working Group
                  The Technical Working Group is one of the most crucial bodies in the process. Proposals
                  rejected by the Technical Working Group are unlikely to come back in the final European
                  Commission decision.
                  The LCP BREF is elaborated by the Technical Working Group, which is chaired by the
                  European IPPC Bureau. The finalised BREFs are adopted “under consensus” by the
                  Technical Working Group members. If in the end the Technical Working Group does
                  not reach consensus on an issue, the dissenting view is reported as “split views”. The
                  Technical Working Group has 352 members, including representatives from EU member
                  states, industries and NGOs.

                  Industrial Emissions Directive Forum
                  Under the Industrial Emissions Directive, the European Commission must regularly convene
                  a forum composed of representatives of Member States, industry and non-governmental
                  organisations and make publicly available the opinion of the forum.
                  The Forum includes representatives from EU member states, industries and NGOs.

                  Member state committee
                  Before the European Commission puts forward the new best available technology
                  definitions, and the related emission limits, the Commission asks a Committee of member
                  state representatives to vote on the proposal (a so called vote on “implementing acts”). The
                  vote takes place by qualified majority.

                                                    26
Indicative Seville process timeline
• March 2015: European IPPC Bureau releases updated proposal with definition of
BATs and associated emission limits.
• June 2015: Final Technical Working Group (a body composed of government,
industry and civil society experts) gives its opinion.
• July / September 2015: The Industrial Emissions Directive Forum (another expert
body with member states, industry and NGO representatives) gives its opinion.
• End 2015: EU member state committee chaired by the European Commission
(under so-called EU comitology rules) votes on the proposal by qualified majority.
• January 2016: Formal adoption by the European Commission and publication
of the LCP BREF/BAT conclusions in the Official Journal of the EU. That date is
the start date for the permit review trigger, which foresees a maximum 4 years
transition period for existing power plants.
• January 2016 to January 2020: National implementation process (process
depends on national law and procedures).
• January 2020: Deadline by when the new requirements need to be applied at plant
level. The deadline for compliance depends on the publication date of the BAT
conclusions in the Official Journal.
Photo © Les Stone / GreenpeaceSMOKE & MIRRORS
Industry bias in the process
A closer look at official member state delegations in the most important body, the Technical
Working Group, chaired by the European IPPC Bureau, reveals that a large number of EU
member states have appointed “experts” who are employed by the companies that are
being regulated, or interest groups representing those companies.
Greenpeace found that a total of at least 46 representatives in government delegations are
in fact industry lobbyists, on top of the 137 formal industry representatives participating.
The most striking example is the Greek delegation. The seven-member delegation is
entirely made up of representatives of Public Power Corporation, the operator of some of
the dirtiest lignite power plants anywhere in the EU, and Hellenic Petroleum.
Poland’s six-person delegation includes three representatives of coal power plant
operators (including PGE and EDF Polska).
The Croatian member state delegation is composed of six people: two from coal power
plant operator HEP, four from the Croatian Chamber of Commerce.
The Czech Republic delegation is dominated by representatives from the ministry of
industry and trade and also includes representatives from power company CEZ, which
has been fiercely lobbying against tighter emission limits under the Industrial Emissions
Directive.
The Estonian delegation also comprises a representative from Eesti Energia AS, operator
of very polluting oil shale power plants.
Slovakia’s six-person Member State delegation includes four employees of power plant
operators from CM European Power Slovakia, ENEL and Slovenské energetické strojárne.
The Spanish twelve-person delegation includes eight industry representatives, including
coal power plant operators Endesa and Iberdrola, as well as the electricity producers’
association UNESA.
The United Kingdom nine-person member state delegation has five representatives of
large polluters, including coal power plant operators RWE, EDF and E.ON and the Stanlow
oil refinery.
Portugal nominated an employee of coal power plant operator EDP Energia as one of three
industry representatives in their seven-strong delegation.
28II. Exposing industry bias in the EU’s decision-making process on power plant pollution standards
Country Polluters represented in delegation
Czech Republic CEZ Group (2 people)
Estonia Eesti Energia
Finland Finnish Energy Industries
Greece Hellenic Petroleum
Greece Public Power Corporation (DEI) (6 people)
Hungary Hungarian Power Companies Ltd. (MVM Zrt) (2 people)
Italy Assoelectrica.it (Italian Energy industry)
Malta Enemalta Corporation (3 people)
Poland Polish Energy Partners (Mondigroup)
Poland PGE Gornictwo i Energetyka Konwencjonalna S.A
Poland EDF Polska
Portugal Turbogas
Portugal Tejo Energia SA
Portugal EDP Energia SA
Slovakia Slovenské energetické strojárne
Slovakia Slovenské elektrárne, a.s., subsidiary of ENEL
Slovakia CM European Power Slovakia (2 people)
Spain Gas Natural SDG S.A (2 people)
Spain Elcogas
Spain Endesa (2 people)
Spain IBERDROLA
Spain HCEnergia.com
Spain UNESA
UK E.ON New Build&Tech (2 people)
UK RWE Power
UK EDF Energy
UK Stanlow refinery
29SMOKE & MIRRORS
Overview of the representation of polluting industry in the technical
working group
Belgium
Photo © Les Stone / Greenpeace 1/14
Croatia
6/6
The Czech Republic
2/10
Estonia
1/4
Finland
1/8
Greece
7/7
Hungary
1/5
Italy
1/6
Malta
3/7
Poland
3/6
Portugal
3/7
Industry
137/137
Slovakia
4/6
Spain
8/12
United Kingdom
5/9
Total number of representatives
Number of industry-paid representatives in the delegation
This chart illustrates the penetration of the Technical Working Group by employees of polluting industries.
In addition to a very large share of places in the working group being directly allotted to industry, many
member states delegated their official representation to their biggest national polluters. Red segments
indicate the share of members in each delegation who are employees of polluting industries.
30II. Exposing industry bias in the EU’s decision-making process on power plant pollution standards
Number of industry-paid
Country/Organization Total number of representatives
representatives in the delegation
AUSTRIA 6
BELGIUM 14 1
BULGARIA 5
CROATIA 6 6
CYPRUS 6
THE CZECH REPUBLIC 10 2
DENMARK 4
ESTONIA 4 1
FINLAND 8 1
FRANCE 5
GERMANY 9
GREECE 7 7
HUNGARY 5 1
IRELAND 3
ITA LY 6 1
LATVIA 2
LITHUANIA 1
LUXEMBURG 1
MA LTA 7 3
THE NETHERLANDS 7
POLAND 6 3
PORTUGAL 7 3
ROMANIA 5
SLOVAKIA 6 4
SLOVENIA 3
SPAIN 12 8
SWEDEN 8
UNITED KINGDOM 9 5
Industry 137 137
Environmental NGO 8
European Commission 25
Non-Member Countries 10
Total 352 183
31SMOKE & MIRRORS
© Lu Guang / Greenpeace
Copy-paste
Even several of the genuinely independent EU country representatives have been known
to regularly advocate the positions of polluting companies and interest groups, often using
statements directly copied from industry representatives.
In a particularly blatant case, delegates from Spain’s ministry of environment and Ireland’s
Environmental Protection Agency argued for weaker emission limits using a statement
that was identical to a comment tabled by power company lobby group Eurelectric33. A
representative of Bavarian Environment Agency in Germany’s delegation demanded weaker
SO2 emission limits for lignite plants, with a written comment identical to ones posted by
several industry representatives. A representative of the UK Environment Agency used
a written comment identical to ones made by Eurelectric and RWE to argue that certain
energy efficiency techniques were too expensive.
Which delegations weaken standards?34
Analysing the written comments filed by member state delegations gives a good picture of
which delegations are the driving force behind weak standards. Seven delegations – those
of Poland, the Czech Republic, Greece, Germany, France, the UK and Spain – are responsi-
ble for the vast majority of comments seeking to further weaken the limits. Several of these
countries – particularly Poland, the Czech Republic, Germany and Greece – are among the
largest sources of coal-fired power plant pollution in Europe, causing significant health
impacts and costs on their citizens and on the citizens of neighbouring countries.
While these countries are actively seeking to protect their license to pollute, very few
countries made efforts to strengthen the standards. Sweden, the Netherlands and Austria
were the only countries to consistently seek to protect public health.
SO2 and NOX emissions
The Polish delegation has opposed any strengthening of emission standards on the
grounds that meeting lower limits is too expensive (regardless of the fact that China, with
much lower income per capita, is requiring substantially stricter standards).
The German representatives have opposed stronger SO2 and NOX limits for lignite power
stations. The delegations of France, Poland, Czech Republic and Greece have opposed
strengthened SO2 limits across the board, while that of Italy has opposed the limits for
mid-sized and large power plants. The delegates from Czech Republic, Poland, Greece,
Bulgaria, Spain and Estonia have pushed for even weaker SO2 limits for power plants
burning exceptionally dirty coal, which could have a very significant impact on total
SO2 emissions in Europe. The Spanish representatives have also tried to further weaken
proposed NOX limits.
The delegations of the UK, Spain and the Czech Republic want to introduce a weaker
minimum limit for NOX, while that of Italy wants to weaken the maximum end of the
limit range proposed in the draft “best available technology” document. The Greek
33 A representative of the Spanish Ministry of Environment, a representative of Ireland EPA and a representative of Eurelectric all argued for
weaker emission limits using the exact same passage, word-for-word and letter-for-letter.
34 This section is based on Greenpeace analysis of written comments submitted by representatives of EU Member States to the first draft
of the BREF (published in July 2013)
32II. Exposing industry bias in the EU’s decision-making process on power plant pollution standards
representation has tried to weaken the NOX limits for lignite, to introduce exemptions for
installing NOX controls, and to oppose the application of even the weak considered SO2
and NOX standards for lignite power stations. The delegation of the Czech Republic wants
to introduce exemptions to the values for all pollutants for plants that have already made
investments to comply with earlier emission requirements. The French delegation wants
to weaken NOX emission limits for new coal-fired power plants and has questioned the
proposed SO2 limits for new plants.
Mercury emissions
The delegations of Spain and Poland pushed for the general removal of mercury limits. The
delegations of the Czech Republic and Portugal want to weaken even very weak mercury
limits. That of Greece wants to further weaken mercury limits for operating and new lignite
plants. France wants to weaken the stricter end of the limit range.
The Czech Republic, Spain, UK, France, Poland and Greece delegates have opposed
continuous monitoring of mercury emissions. Italy has called for additional assessments on
the measurement of mercury emissions, with the clear intention of weakening or eliminating
requirements for continuous monitoring.
The UK and Spain have opposed mercury controls, while Poland has opposed them on the
grounds that they are not economically viable.
Energy efficiency
The delegations of Germany, Poland and Greece have opposed energy efficiency
improvements in lignite power plants, while those of Spain, Poland, the Czech Republic
and the UK have opposed these measures for all coal power plants. Energy efficiency
would reduce both CO2 and air pollution emissions.
The Polish representatives have argued in favour of a power plant thermal efficiency
of 60% higher CO2 and air pollution emissions than most efficient plants today. Greece
already allows 40% higher emissions than most efficient plants and also opposed strong
measures.
Austria was one of very few countries to appeal for stronger NOX limits. Sweden and
Austria have proposed more stringent limits for mercury, while the Netherlands asked
for stronger efficiency targets. Austria and France also supported standards for better
enforcement, while France and the Netherlands backed emission limits for toxic metals
beyond mercury, as well as for dioxins and furans.
33SMOKE & MIRRORS
Overview of some of the EU member state delegation positions
Additional
SO2 exemptions
SO2 NOx Particulate Mercury Mercury Energy limits for
for high sulfur
limit limit limit limits monitoring Efficiency heavy metals
coal and lignite
and dioxins
Sweden
The
Netherlands
Austria
Poland
Germany Lignite Lignite
Greece Lignite Lignite
New
France
plants
The Czech
Republic
Spain
United
Kingdom
Italy
Finland
Portugal
Weaken/oppose
Question/undermine
Strengthen
34II. Exposing industry bias in the EU’s decision-making process on power plant pollution standards
35Conclusions © Les Stone / Greenpeace
CONCLUSIONS

Time for EU decision-
makers to intervene
Greenpeace is deeply concerned that the health of European citizens and best available air
pollution control technologies are not being properly taken into account in EU decisions to
set emission limits for coal plants.
We call on EU environment ministers, members of national parliaments and the European
Parliament to intervene in the Seville process and beyond, and to take the following
actions:
•   Ensure timely adoption: publication of best available technique definitions and
    emission limits for large combustion plants should take place by January 2016 at the
    very latest.
•   Make standards robust: the implementation of the BREF by member states should
    provide a level playing field for power plant operators in the European Union by setting
    equally robust standards for all power plants; standards should be binding for all
    member states and not allow derogations.
•   The BREF and related emission limit values should be based on the truly best
    international performers:

                                 Existing plants            New plants

Sulphur dioxide (SO2)
You can also read