Levels indicator 5.2: Increased risk of extreme weather events - User manual: Introductory briefing, instructions and guidance Publication ...
←
→
Page content transcription
If your browser does not render page correctly, please read the page content below
Level(s) indicator 5.2:
Increased risk of
extreme weather
events
                  User manual: Introductory
                  briefing, instructions and
                  guidance
                  (Publication version 1.1)

                  Nicholas Dodd, Shane Donatello,
                  Mauro Cordella (JRC, Unit B.5)

                   January 2021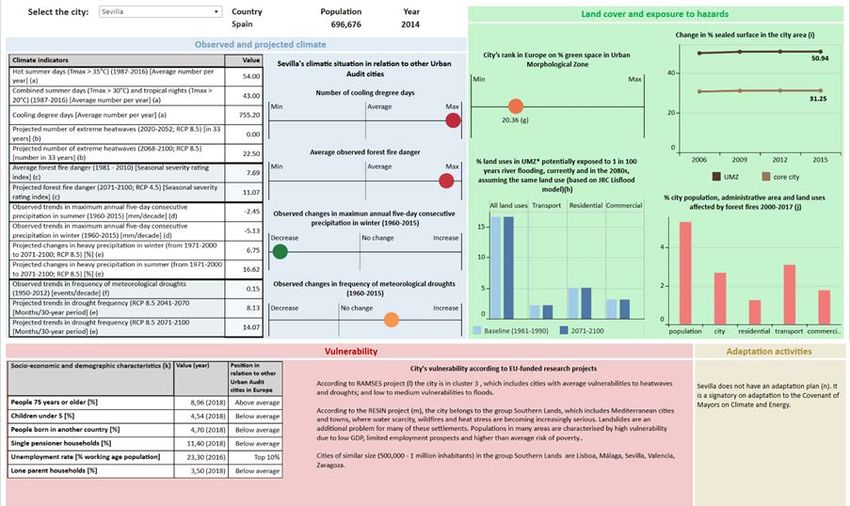
European Commission
Joint Research Centre
Directorate B, Growth and Innovation
Unit 5, Circular Economy and Industrial Leadership

Contact information
Shane Donatello
Address: Edificio Expo. c/ Inca Garcilaso, 3. E-41092 Seville (Spain)
E-mail: jrc-b5-levels@ec.europa.eu

https://ec.europa.eu/jrc
https://susproc.jrc.ec.europa.eu/product-bureau/product-groups/412/home

Legal Notice
This publication is a Technical Report by the Joint Research Centre, the European Commission’s in-
house science service. It aims to provide evidence-based scientific support to the European policy-
making process. The scientific output expressed does not imply a policy position of the European
Commission. Neither the European Commission nor any person acting on behalf of the Commission
is responsible for the use which might be made of this publication.

How to cite: Dodd N., Donatello S. & Cordella M., 2021. Level(s) indicator 5.2: Increased risk of
extreme weather events user manual: introductory briefing, instructions and guidance (Publication
version 1.1)

Title
Level(s) indicator 5.2: Increased risk of extreme weather events user manual: introductory briefing,
instructions and guidance (Publication version 1.1).

Abstract

Developed as a common EU framework of core indicators for assessing the sustainability of office
and residential buildings, Level(s) can be applied from the very earliest stages of conceptual design
through to the projected end of life of the building. As well as environmental performance, which is
the main focus, it also enables other important related performance aspects to be assessed using
indicators and tools for health and comfort, life cycle cost and potential future risks to performance.

Level(s) aims to provide a common language of sustainability for buildings. This common language
should enable actions to be taken at building level that can make a clear contribution to broader
European environmental policy objectives. It is structured as follows:

    1.   Macro-objectives: An overarching set of 6 macro-objectives for the Level(s) framework that
         contribute to EU and Member State policy objectives in areas such as energy, material use,
         waste management, water and indoor air quality.

    2.   Core Indicators: A set of 16 common indicators, together with a simplified Life Cycle
         Assessment (LCA) methodology, that can be used to measure the performance of buildings
         and their contribution to each macro-objective.

In addition, the Level(s) framework aims to promote life cycle thinking. It guides users from an initial
focus on individual aspects of building performance towards a more holistic perspective, with the aim
of wider European use of Life Cycle Assessment (LCA) and Life Cycle Cost Assessment (LCCA)
methods.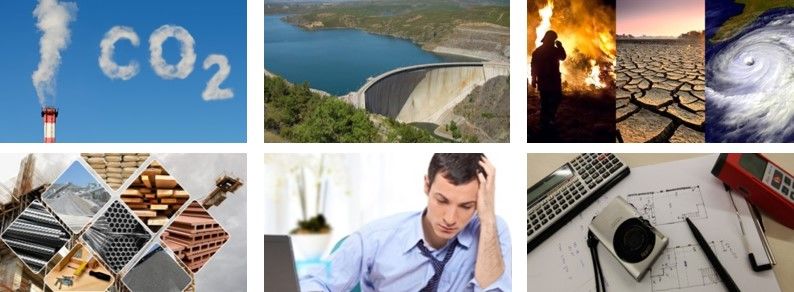
Contents
Contents .................................................................................................................................... 3
Level(s) documentation structure ............................................................................................. 4
How this indicator user manual works ...................................................................................... 5
Technical terms and definitions used........................................................................................ 6
Introductory briefing ................................................................................................................. 7
Instructions on how to use the indicators at each level ......................................................... 11
   Instructions for Level 1 ........................................................................................................ 11
Guidance and further information for using the indicator ..................................................... 13
   For using level 1 ................................................................................................................... 13
       L1.2. Step 1 & L1.4 Checklist concept 1: Preparing the ground for adaptation. ............. 13
       L1.4. Checklist concept 2: Assessing potential risks and vulnerabilities to extreme
       weather events in the region and building plot. ............................................................. 14
       L1.4. Checklist concept 3: Identifying possible adaptation actions................................. 17
       L1.4. Checklist concept 4: Assessing the costs and benefits of adaptation actions ........ 18

                                                                      3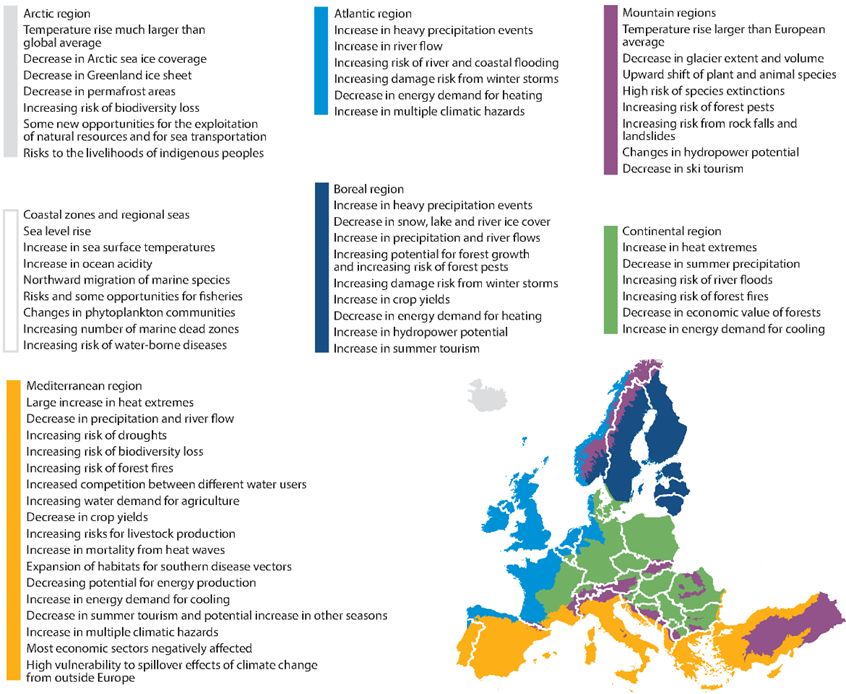
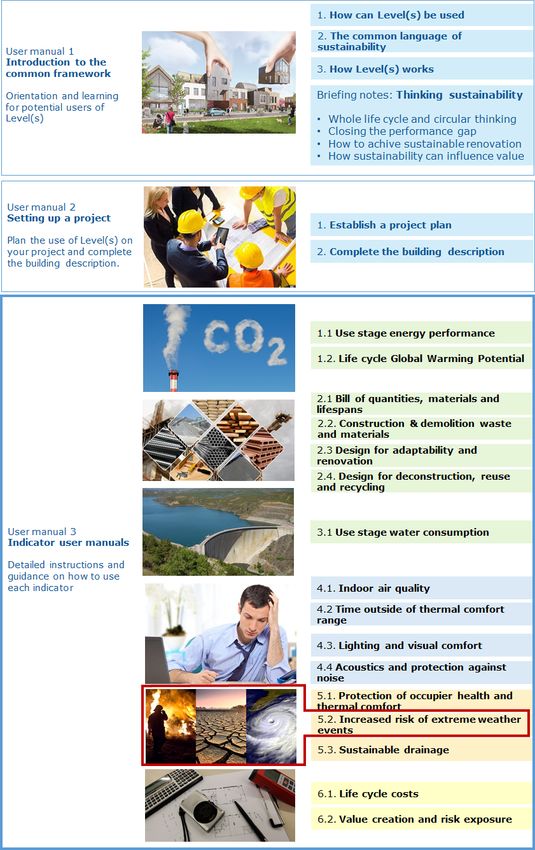
Level(s) documentation structure

                             Figure 1. The Level(s) document structure

                                                4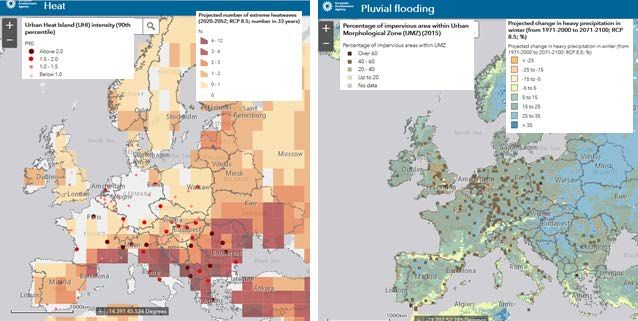
How this indicator user manual works
Level(s) is a framework of core indicators of sustainability that can be applied to building projects in order to
report on and improve their performance. The supporting documentation has been designed to be accessible
to all the actors that may be involved in this process.
If you are new to the assessment of building sustainability, we recommend reading the first part of the Level(s)
user manual. This will provide you with an introduction to the basic concepts behind Level(s) and how you can
apply it to a building project.
If you haven’t yet set up your building project to use Level(s), including completing the project plan and the
building description, then we recommend reading the second part of the Level(s) user manual.
This indicator user manual forms part of the third part of the Level(s) user manual where you will find
instructions on how to use the indicators themselves. It is designed to help you apply your chosen indicator to
a building project. It will help you to do this in the following way:
• Introductory briefing: This section provides an overview of the indicator, including:
why you may wish to measure performance with it,
what it measures,
at which stages in a project it can be used,
the unit of measurement, and
the relevant calculation method and reference standards.
• Instructions on how to use the indicators at each level: This section provides:
step by step instructions for each level,
what is needed to make an assessment,
a design concept checklist (at Level 1), and
the reporting formats.
The instructions often refer to the guidance and further information section, which can be found after
the instructions.
• Guidance and further information for using the indicator: This section provides more background
information and guidance to support you in following specific steps in the instructions, including the
design concepts introduced at Level 1 and the practical steps to calculate or measure performance at
Levels 2 and 3. They are all cross-referenced to specific instruction steps at either level 1, 2 or 3.
This indicator user manual is structured so that once you are familiar with using the indicator and you know how
to work with it, you may no longer need to refer to the guidance and background information, but only work
directly with the instructions at the level of your choice.
5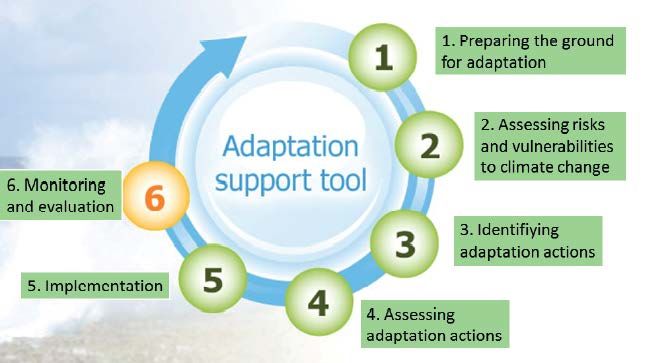
Technical terms and definitions used
       Term                                               Definition
                  The flooding of areas by water from a sea, an ocean or another large body of open
                  water. These types of flood are most commonly linked to storm surges. Storm surges
  Coastal
                  are caused when high winds from hurricanes and other storms push water onshore. The
  flooding
                  risk of coastal flooding is highest when a storm surge coincides with high tide and/or
                  with river flooding (at the delta).
                  Broadly speaking, drought means a temporary shortfall in precipitation over an extended
                  period of time compared to the needs of vegetation cover. Droughts can be classified in
                  different ways depending on the impacts considered, e.g. meteorological droughts,
  Drought         hydrological droughts, agricultural droughts or socioeconomic droughts. Droughts are to
                  be distinguished from aridity, a permanent climatic feature, and from water scarcity, a
                  situation where the water demands (for society, economy and nature) are greater than
                  available water resources (rivers, reservoirs, groundwater…).
                  According to Working Group II on the IPCC Fifth Assessment Report (AR5), an extreme
                  weather event is an event that is rare at a particular place and time of year. Definitions
                  of rare vary, but an extreme weather event would normally be as rare as or rarer than
                  the 10th or 90th percentile of a probability density function estimated from
  Extreme
                  observations. By definition, the characteristics of what is called extreme weather may
  weather event
                  vary from place to place in an absolute sense. When a pattern of extreme weather
                  persists for some time, such as a season, it may be classed as an extreme climate event,
                  especially if it yields an average or total that is itself extreme (e.g. drought or heavy
                  rainfall over a season).
  Fluvial         Flooding caused by a river. It occurs when excessive rainfall and/or snow melt in the
  flooding        catchment area exceeds the river capacity.
  Green
                  Measures to improve the resilience or adaptation capacity of a building that are based
  adaptation
                  on nature-based approaches (e.g. construction of stormwater retention ponds).
  measures
  Grey            Measures to improve the resilience or adaptation capacity of a building that are based
  adaptation      on technological and engineering solutions (e.g. rough and irregular surfaces around tall
  measures        buildings to reduce crosswind oscillations).

  Hailstorm       Thunderstorms that produce hail (i.e. balls or irregular lumps of ice ≥ 5 mm in diameter).

                  Flooding caused by an extreme rainfall event or sudden release of water from other
  Pluvial
                  sources that is independent of an overflowing water body (e.g. a river). It occurs when
  flooding
                  the drainage system is unable to convey water away from the site quickly enough.
  Severe          An intense meteorological event, which normally occurs in summer, which are typified
  convective      by high winds, hail, torrential rain and lightning. Commonly referred to as
  storm           thunderstorms, they may also cause tornados to form.
                  Measures to improve the resilience or adaptation capacity of a building that are based
  Soft
                  on policy, legal, social, management or financial measures that in turn alter human
  adaptability
                  behaviour (e.g. tele-working possibilities when office is inaccessible due to a snow
  measures
                  storm).
  Urban Heat      An urban area which is significant warmer than surrounding rural areas. Multiple factors
  Island (UHI)    can contribute to the UHI effect.

                                                     6
Introductory briefing
      Note for users: This indicator only has instructions and guidance for using the indicator at Level 1 at this
     moment. For those who wish to work at Level 2 and 3, it provides some initial information about possible
             units of calculation and measurement, as well as reference standards that could be used.

Why measure performance with this indicator?
There is a common aspect between indicators 5.2 and 5.3 since both of them concern the relationship between
building/plot area design and flood events/risk. The key differences are:
       •     Indicator 5.2 is about how to make the building more resilient and resistant to extreme weather events
             when they occur (including the three main types of flooding: fluvial, pluvial and coastal).
       •     Indicator 5.3 is about how to use the building design and plot area to reduce the chances of pluvial
             flood events in the local area and fluvial flood events downstream from occurring in the first place.
This indicator focuses on the resilience of building structures and envelopes to extreme weather events. The
main categories of extreme weather events are: pluvial flooding, fluvial flooding, windstorms, coastal flooding,
droughts, heatwaves, hail and snow. There are no practical measures that can be taken to reduce the risk of
extreme weather events occurring. However, measures can be taken to design buildings in such a way that,
when an extreme weather event does occur, the damage caused to the building structure and its occupants is
minimised or avoided altogether.
Over centuries, weather patterns have played a contributing role to the evolution of building forms, structures
and materials and have helped influence the choice of developed locations. Extreme weather events are a part
of the natural climate and their very definition is related to what is rare in a given regional context. For example,
a given snowfall event is not so extreme in northern regions at high altitudes compared southern regions at sea
level. A given rainfall intensity would not be so extreme in a coastal climate with nearby mountains than a
continental climate with no surrounding mountains.
Although Europe does not lead in weather extremes in the global context (consider tornado alley in the central
United States and the Asian monsoon regions for example), the exposed value of building assets is high. There
are two main reasons for the higher exposure of European buildings to extreme weather:
       1.    Climate change. Rising sea and land temperatures are changing precipitation patterns and causing an
             increase in climate-related extremes in many parts of Europe (e.g. heat waves, heavy precipitation and
             droughts) 1.
       2.    Development of sites with high exposure hazards. As real estate value has soared in most of Europe,
             so has the value of land in areas surrounding urban and sub-urban developments. This has led to “urban
             sprawl” on many sites that were previously undeveloped, especially on exposed riverside and seaside
             areas.
Climate extremes are especially relevant in coastal areas, where risks increase due to a combination of gradually
increasing mean sea levels, storm surges, wind damage and erosion. Extreme heatwaves, like the 2003 event
that caused an estimated 70 000 premature deaths in Europe (Kron et al., 2019) 2, also create drought conditions
and an increased risk of wildfires. Although wildfires rarely affect urban environments, the fact that burnt areas
in Finland, Sweden, Estonia, Lithuania, Germany, the UK and Ireland have increased by 60 times during the
period 2008 – 2017 3, indicates an increased risk of wildfires to certain developed areas. Large parts of Europe

1
    EEA, 2016. Climate change, impacts and vulnerability in Europe. An indicator-based report. ISSN 1977-8449.
2
  Kron W., Low P., Kundzewicz ZW., 2019. Changes in risk of extreme weather events in Europe. Environmental Science & Policy, 100,
p.74-83.
3
    JRC, 2018. Forest fires in Europe, Middle East and North Africa.

                                                                       7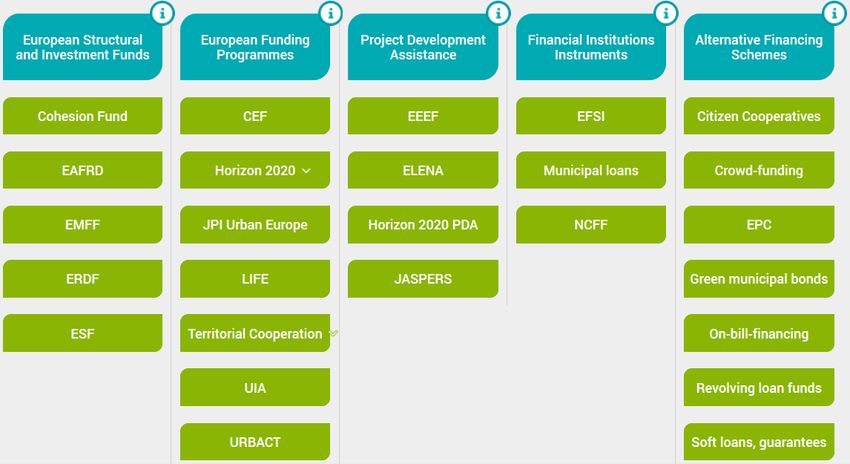
have experienced historic droughts in the last 3 years 4. In addition to more obvious drought-related problems,
if a drought is followed by heavy rains can reduce soil stability and lead to landslides.
From an insurance perspective, weather-related loss events have significantly increased worldwide in both
number and value of losses during the period of 1980 to 2014. Hoeppe (2016) 5 stated that the increase in losses
is linked with extreme weather events and increasing values of exposed assets (including buildings). In a scenario
where global warming is 3°C or more above pre-industrial temperature levels, the PESETA IV report by the JRC
estimates that droughts would happen twice as often in most of southern and western Europe. Arguably, the
most significant change will be with extreme sea level events, where 1 in 100 year occurrences (according to
current records), are expected to happen every year by 2100 in most coastal locations under all IPCC scenarios 6.
The damage caused by extreme weather events is a heavy burden on building owners, occupants and the
insurance sector. Standard building designs that have worked satisfactorily for decades may be subject to higher
insurance premiums due to uncertainty about their ability to withstand more extreme weather events in the
future. The incorporation of suitable protective measures against extreme weather events should be a highly
justifiable action to argue for insurance premiums to be lowered or at least not be increased.
What does it measure?
A procedure is set out for how to approach the increased risk of extreme weather events in the conceptual
design of the building (Level 1). When the new Eurocodes are published, they will form the basis for more
quantitative assessments at Level 2 and Level 3. Until then, no Level 2 or Level 3 approach is defined for this
indicator.
At what stage of a project?
The stages at which an assessment can be made reflect the three ‘levels’. Only Level 1 is currently available, but
a possible approach for Levels 2 and 3 is also outlined for future reference:
Level Activities related to the use of indicator 5.2
information is provided to prompt discussion and decision making for the project
1. Conceptual design (following
about aspects that will directly or indirectly influence the resilience of the
design principles)
building to extreme weather events.
2. Detailed design and
Prior to commencement of works on site and during the detailed design stage, the
construction (based on
design criteria, actions, design situations and relevant limit states from applicable
calculations, simulations and
Eurocodes shall be defined.
drawings)
The actual building structure and envelope that is constructed shall be compared
3. In-use performance (based on
to the design structure and envelope. Any differences should be explained if they
commissioning, testing and
affect (positively or negatively) the resilience of the building to relevant actions on
metering)
the building structure and envelope.
Unit of measurement
The main design situations relating to actions of extreme weather events on buildings are considered as per the
table below.
Table 1. Links between climatic actions and the application of Level(s)
4
See info note INFO(2020) 29 and recent reports by the European Drought Observatory, available at:
https://edo.jrc.ec.europa.eu/edov2/php/index.php?id=1051
5
Hoeppe P., 2016. Trends in weather related disasters – Consequences for insurers and society. Weather and Climate Extremes, 11, p.70-
79.
6
IPCC, 2019: Summary for Policymakers. In: IPCC Special Report on the Ocean and Cryosphere in a Changing Climate [H.-O. Pörtner, D.C.
Roberts, V. Masson-Delmotte, P. Zhai, M. Tignor, E. Poloczanska, K. Mintenbeck, A. Alegría, M. Nicolai, A. Okem, J. Petzold, B. Rama, N.M.
Weyer (eds.)]. In press.
8Levels 2 & 3 – Detailed design and In-
Climatic actions Level 1 – Conceptual design
Use stages (Placeholder)
Layout on plot area, physical barriers on site Once the building structure and envelope is
Fire exposure (from
perimeter, ground cover material (e.g. vegetation well defined, the following are considered:
wildfires linked to
or hard paving), choice of materials for building
drought conditions)
envelope and structure.
• Design values of actions;
Pitch of roof, ease access for sweeping, • Design values of material or product
Snow loads
roughness of roofing material. properties;
Choice of building form and surface roughness of • Design values of geometrical data;
Wind actions
building envelope. • Design resistance
Building envelope design, cladding materials and • Ultimate or serviceability limit states
Thermal actions
fastenings. Temperature differentials on inner (EQU, STR, GEO, FAT) 7
(daily and seasonal)
and outer surfaces of building envelope.
The building structure should be able to
Building position on plot area if land is of different
withstand actions with defined probability
Flooding elevations. Potential elevation of ground floor
(e.g. 0,02, which would mean a return period
slab. Installation of flood barriers.
of 50 years).
System boundary
In terms of physical boundaries, improving the resilience of building structures and envelopes to extreme
weather events may extend beyond the building envelope itself. Some examples of this could be retaining walls
or soil stabilisation to reduce the risk of landslides and flood barriers.
In terms of boundaries for life cycle impacts within the EN 15978 framework (illustrated in Figure 4 of user
manual 1), additional environmental impacts can be expected in the A1-A5 stages (product manufacture,
transport and installation) when additional material quantities or higher performance materials are required.
This could be due to needing more resistant specifications of the same material (e.g. thicker structural columns)
or new improved performance (e.g. low thermal conductivity walling systems). However, benefits due to longer
estimated service lives and better performance of building elements should be reflected by lower impacts in the
EN 15978 life cycle stages B3 and B4 stages during the building use stage.
Scope
Although the indicator is focused primarily on the building envelope and structure, design measures that reduce
the risk of damage caused by extreme weather events may extend to features beyond the building envelope
itself. For example, flood or erosion barriers erected at the site boundary that are part of a larger flood
protection infrastructure. These features may be designed to solely protect the building in question or to protect
the neighbouring areas and buildings as well.
Calculation method and reference standards
The Level 1 procedure is generally aligned with the Climate-Adapt initiative of the European Environment
Agency 8, but is tailored for application at the level of an individual building project.
For Levels 2 and 3, it is foreseen that the assessment will be linked to the principles and application rules set out
in EN 1991-1-2 (fire safety), EN 1991-1-3 (snow loads), EN 1991-1-4 (wind loads) and EN 1991-1-5 (thermal
actions). Specifically during the construction stage (i.e. before the building is completed), EN 1991-1-6 can be
applied for transient design situations.
7
These are initial suggestions to be considered in more detail once the new Eurocodes are available. The most obvious climate related
actions are fire exposure, wind loads, (non-fire) thermal actions, snow loads and water (groundwater table and surface flooding). The limit
states refer to: EQU (loss of static equilibrium of the structure or any part of it considered as a rigid body; STR (internal failure or excessive
deformation of the structure or structural members, including footings, piles, basement walls etc., where the strength of construction
materials of the structure governs); GEO (failure or excessive deformation of the ground where the strengths of soil or rock are significant
in providing resistance); FAT (fatigue failure of the structure or structural members.
8
See: https://climate-adapt.eea.europa.eu/knowledge/tools/adaptation-support-tool
9Figure 2. The adaptation policy cycle (EEA, 2018) 9
Steps 1-4 in the image above generally apply to Level 1 (conceptual design), step 5 to Level 2 (detailed design
and construction) and step 6 to Level 3 (monitoring of as-built and in-use performance). However, users are
reminded again that this current version of the user manual only extends to Level 1 (i.e. steps 1-4 in the diagram
above).
9
EEA, 2018. National climate change vulnerability and risk assessments in Europe. EEA Report 1/2018.
10Instructions on how to use the indicators at each level
Instructions for Level 1
L1.1. The purpose of Level 1
The focus of Level 1 is to make the user aware of steps to take during the conceptual design stage (and
even earlier) to ensure that the awareness of extreme weather events at the building location is
maximised. This awareness can then be the platform for considering how to optimise the design of the
building and any surrounding plot area for adaptation to extreme weather events.
L1.2. Step-by step instructions
These instructions should be read in conjunction with the accompanying Level 1 technical guidance and
supporting information (see page 13).
1. Prepare the ground for adaptation. Put together a team for focussing on adaptation to
extreme weather events. Establish dialogue with planning authorities, in particular those in
charge of risk assessment planning (e.g. flood risk management, drought management,
national planning for adaptation to climate change) and check if there is any regional, national
or European body that can provide support for adaptation efforts.
2. Consult the checklist under L1.4 of adaptability features for extreme weather events and read
the supporting information in the Level 1 technical guidance.
3. Within the design team, review and identify how adaptation actions for increasing resistance
to relevant extreme weather events can be incorporated into the building.
4. Report on the adaptation actions that were assessed, reporting why they will be implemented
or not.
L1.3. Who should be involved and when?
For the conceptual design (Level 1), the main actors would be the concept architect, the prospective
building owner or investor, planning authorities and a risk assessment expert. Consultation with
individuals with an extensive knowledge of the local and regional weather patterns and climate change
projections is particularly beneficial. The risk assessment expert might also be representing insurers or
be independent.
L1.4. Checklist of relevant design concepts
The following relevant design concepts have been identified from best practice and literature reviewed
by the Joint Research Centre.
Level 1 design concept Brief description
Consult the following website, where any available national adaptation policies,
1. Preparing the ground for strategies and plans should be available:
adaptation and resistance https://climate-adapt.eea.europa.eu/countries-regions/countries
to extreme weather events. Moreover, consider contracting specialists with skills and experience in the
design and modelling of climate adaptation.
Consider historical extreme weather events in the area and consult any available
risk maps, e.g. the national flood risk hazard map and the FRMP (Flood Risk
Management Plan), the relevant drought management plan (if one available)
2. Assess the main risks of and or RBMPs (River Basin Management Plans)
and vulnerabilities to
For the specific site, consider factors such as exposure to high wind speeds,
extreme weather events at
excessive solar gain and urban heat island effects, proximity of mountainous
the building location (both
regions, proximity of steeply sloped land masses and proximity to the sea or
now and in the future).
watercourses (both in vertical and horizontal axes).
Consult public reports, weather databases, climate change projections and
experts if necessary. Insurance analysts may be especially helpful.
11Level 1 design concept Brief description
Depending on the main risks identified in 2., check for relevant literature and
case studies for climate adaptation for buildings. For example see the Climate-
3. Identify possible ADAPT database:
adaptation actions.
https://climate-adapt.eea.europa.eu/knowledge/tools/case-studies-climate-
adapt ).
Cost considerations should include the potential increased complexity of the
construction works, increased capital costs and increased maintenance costs
(especially relevant for certain nature-based solutions).
4. Assess the costs and
benefits of adaptation Benefits to consider could include potentially lower insurance premiums and a
actions. reduced risk/cost of damage in the event of extreme weather events. In cases
where the adaptation measures embrace nature-based solutions and
aesthetically pleasing forms, benefits for biodiversity and occupant well-being
may also be relevant.
L1.5. Reporting format
Risk of extreme Addressed? How has it been incorporated into the building project?
weather event (yes/no) (provide a brief description)
design concept
1. Preparing the
National adaptation plan has been consulted, but there are no
ground for adaptation
actions defined so far for the construction sector. A consultant has
and resistance to Yes
reviewed several plans from other EU countries that do consider
extreme weather
the construction sector.
events.
2. Assess the main risks
of and vulnerabilities
The building is to be 30 storeys tall and located on the banks of an
to extreme weather
Yes estuary and is therefore subject to potentially high and variable
events at the building
wind loads, river flooding and storm surges.
location (both now and
in the future).
Adaptability options include placing all crucial electrical plant and
equipment above ground instead of in the basement and in
introducing irregularly patterned floor plates to minimise crosswind
3. Identify potential oscillation.
Yes
adaptation actions.
For the building plot area (and as part of a larger project), a stepped
wetland area will be constructed along the estuary banks to protect
from gradual erosion and to help re-establish native biodiversity.
3. Assess the costs and It is too early to compare approximate costs but the floor plate
benefits of adaptation No design will be customised as part of the unique architectural
actions. features of the building.
12Guidance and further information for using the indicator
For using level 1
In this section of the manual, additional background guidance and explanations are provided for key
concepts introduced in Level 1, namely:
• L1.2. Step 1: & L1.4. Checklist concept 1: Preparing the ground for adaptation.
• L1.4. Checklist concept 2: Assessing potential risks and vulnerabilities to extreme weather
events in the region and specific building plot.
• L1.4. Checklist concept 3: Identifying possible adaptation actions.
• L1.4. Checklist concept 4: Assessing the costs and benefits of adaptation actions.
L1.2. Step 1 & L1.4 Checklist concept 1: Preparing the ground for adaptation.
The 2013 “EU strategy on adaptation to climate change” 10 set out a plan for making Europe more
climate resilient. A total of eight actions were mentioned across three overall objectives:
1. Promoting action by Member States
2. Better informed decision making
3. Climate-proofing EU action – promoting adaptation in key vulnerable sectors
A new EU climate change adaptation strategy will be adopted (expected by mid-2021) and this will bring
updates to the relevant objectives and actions and possibly new objectives and actions as well.
The Climate ADAPT website aims to be a “one-stop shop” for all measures relating to adaptation for
climate change and users should start here: https://climate-adapt.eea.europa.eu/about
Within the website, it is possible to consult plans and strategies available at:
• Transnational level: https://climate-adapt.eea.europa.eu/countries-regions/transnational-
regions
• National level: https://climate-adapt.eea.europa.eu/countries-regions/countries
• City/town level: https://climate-adapt.eea.europa.eu/eu-adaptation-policy/sector-
policies/urban
The Covenant of Mayors for Climate and Energy Europe provides a wealth of information relevant at
the city/town level, including:
• A searchable database with thousands of entries for action plans, progress reports and good
practices that can be filtered by country, action type and sector.
• Links to relevant webinars on different aspects of climate change adaptation.
• An interactive funding guide (see screenshot overview below).
10
EC, 2013. An EU Strategy on adaptation to climate change, COM (2013) 216 final. Brussels: European Union. Available from
http://eur-lex.europa.eu/legal-content/EN/TXT/PDF/?uri=CELEX:52013DC0216&from=EN
13Figure 3. Overview of different financing mechanisms for climate change adaptation (Source:
https://www.eumayors.eu/support/funding.html )
Between the Climate ADAPT and the Covenant for Mayors websites, users should be able to find any
relevant contacts and supporting bodies that can assist with the consideration and implementation of
climate adaptation measures in their building design.
L1.4. Checklist concept 2: Assessing potential risks and vulnerabilities to extreme weather events in
the region and building plot.
Note: Although not yet finalised as of December 2020, users should check if the ISO 14091 standard
on climate risk and vulnerability assessment is available. The ISO standard would form the basis for
assessing vulnerability to climate change. Likewise, users are recommended to check if the EU
guidelines for climate proofing of infrastructure have been published when they read this user
manual.
For an overall European picture of the potential changes in weather events, users are recommended to
refer to the comprehensive 2016 report by the European Environment Agency 11. A simple overview of
the main impacts that are foreseen across Europe is provided below.
11
EEA, 2016. Climate change, impacts and vulnerability in Europe 2016. An indicator-based report. ISSN 1977 8449.
14Figure 4. Observed and projected climate change impacts for the main biogeographical regions in Europe (Source:
EEA, 2016).
As a common second point of reference, users are encouraged to consult the “Urban Adaptation Map
Viewer” 12 produced by the European Environment Agency. The viewer provides Europe wide maps
about the vulnerabilities to:
• heat
• river (fluvial) flooding
• coastal flooding
• pluvial flooding
• drought and wildfires
• other metrics not strictly related to Level(s) indicator 5.2 (i.e. water scarcity, vector borne
diseases and social vulnerability).
Some examples of the maps are provided below.
12
See: https://climate-adapt.eea.europa.eu/knowledge/tools/urban-adaptation
15Figure 5. Examples of urban adaptation maps (Source: https://climate-
adapt.eea.europa.eu/knowledge/tools/urban-adaptation)
The maps above only present some examples of the layers that can be placed on the maps.
On the left hand side, the dots plotted are related to the Urban Heat Island intensities of specific cities.
The coloured squares are linked to projected extreme heatwaves over broader areas in the next 30
years. Although more frequent in southern Europe, it is clear that extreme heatwaves are expected to
occur across most of Europe.
On the right hand side, the coloured areas represent projected changes in rainfall intensities between
the periods of 1971-2000 and 2071-2100. Most of Europe is expecting a 5-15% increase in heavy
precipitation events in winter. Since pluvial flooding is greatly exacerbated by the extent of impervious
land area, it is useful to overlay this data for specific cities (shown as coloured points).
Another interesting aspect of the urban adaptation maps is that by clicking on the “city factsheets” tab,
it is possible to see the metrics for a particular city within the range of data for all the other recorded
cities.
Figure 6. Screenshot for Sevilla in the city factsheets tab of the Urban Adaptation Map viewer.
16Quick conclusions from the information above would be that extreme weather events to take into
account at the level of the city of Sevilla and surrounding areas would be heatwaves, droughts and
forest fires.
At the level of the individual building plot, some very basic suggestions for identifying relevant risks
would be as follows:
• High speed winds: check how exposed the site is, consider potential positive shielding by
nearby hills, mountains, forests and the surrounding built environment. Also consider how tall
the proposed building will be and possible increased wind speeds at ground level caused by
channeling of wind that impacts directly with flat built surfaces on large and tall buildings in
the surrounding area.
• Pluvial flood risk: consider the surrounding topography of the site and broader area. Where
does storm water drain to? Are there a lot of imperviously paved areas upstream and in the
surrounding area? Are stormwater drains combined with mains sewers? Where does
stormwater drain to and where are the overflows situated? Have there been any recent fluvial
flood events and, if so, how was the specific site affected?
• Fluvial and coastal flood risk: how close is the building plot to natural watercourses, both in
horizontal and vertical distances. Have there been any recent flood events and, if so, how was
the specific site affected?
• Wildfires: this consideration would only rarely be applicable for buildings in cities in terms of
direct fire risk. However, broader impacts associated with poor air quality can indeed extend
over long distances and reach cities. In fire exposed settings, it would be worth considering
the susceptibility of the surrounding area to droughts, the extent of vegetation and any recent
events. In cities, the main focus would likely be on intake air filter performance.
Further tools for climate risk assessments are currently being developed under various initiatives and
the users are invited to regularly check portals such as Climate Adapt or Copernicus Climate Change
Services and national websites to identify and use the most suitable and state-of-the-art services for
their purposes.
L1.4. Checklist concept 3: Identifying possible adaptation actions.
Users of Level(s) are recommended to consult the literature for examples of relevant best practice. The
Climate ADAPT website 13 presents a number of relevant case studies and is a useful starting point for a
broader literature search.
Some examples of actions relating to a selection of weather events are listed below 14.
For flood events (coastal, fluvial or pluvial):
• Locate/relocate boilers and other utilities in the building above expected flood levels.
• Plan for potential furniture relocation to areas above expected flood level.
• Flood proofing of floor and wall areas. This could be either “dry-proofing” or “wet-proofing”
type approaches. 15
• In a similar vein, walls can either be reinforced to withstand the buoyancy force of floodwater
or have deliberate openings to allow the ingress of floodwater into basements and garages to
prevent buoyancy forces from building up in the first place.
13
See: https://climate-adapt.eea.europa.eu/knowledge/tools/case-studies-climate-adapt
14
Taken from the Commission report: “Insurance of weather and climate-related disaster risk: Inventory and analysis of
mechanisms to support damage prevention in the EU. ISBN: 978-92-79-73173-0
15
Wet-flood proofing: these measures attempt to minimise the damage inside a property once floodwater has entered.
Measures in this category are likely to have a low-to-medium effect, as they don’t prevent water from entering the building but
aim to minimise the damage and to prevent the collapse of the building as a result of hydrostatic pressure.
Dry-flood proofing: these measures attempt to prevent water from entering the building. Measures in this category are likely to
have a medium effect because they aim to prevent water from entering the property. The efficiency of measures in this
category is limited by the extent to which the flood depth exceeds the height of dry proofing.
17• Backflow valves on drainage infrastructure to prevent backflow of sewerage and stormwater
into site or building.
• Shielding for doors, gates and windows to prevent water ingress.
• Elevated ground floors by either raising the ground level or having the floor slab on stilts.
• Building floodwalls around the site.
For severe convection storms (high wind loads):
• Mitigation measures on the building structure to reduce vulnerability to high winds.
• Bracing of gable-end roofs.
• Installation of roof tie-down clips and roof-to-wall clips.
• The use of concrete roof slabs.
• Shutters for windows.
L1.4. Checklist concept 4: Assessing the costs and benefits of adaptation actions
An example list of costs and benefits that could be identified at the conceptual design stage for the
green roofs to improve resilience of the building to heatwaves is summarised in the table below.
Table 2. Example of costs and benefits of an adaptation action
Adaptation action Costs Benefits
Weight of roof may require a more Evaporative cooling effect provided by roof –
robust supporting structure lower cooling energy costs for indoor air.
Green roof for Green space needs maintenance Potential for amenity areas and biodiversity
reduced risk of Water consumption increased and
excessive heat gain Potential for greywater reuse
need to pump water to roof.
during heatwaves.
Roof can also provide a better barrier to
Need to include expertise in green
radiative heat loss from inside the building
roof engineering in the design team.
during cold weather.
Another possible benefit of adaptability actions in a building project is lower insurance premiums.
Users of Level(s) that intend to report under Level 1 of indicator 5.2 are encouraged to generate a
market signal by asking insurance providers about risk-based products. Input from insurance providers
is also welcomed to help shape future versions of Level(s) indicator 5.2.
18You can also read