Urban Road Crashes and Weather Conditions: Untangling the Effects - MDPI
←
→
Page content transcription
If your browser does not render page correctly, please read the page content below
sustainability

Article
Urban Road Crashes and Weather Conditions:
Untangling the Effects
António Lobo 1, * , Sara Ferreira 1 , Isabel Iglesias 2 and António Couto 1
 1    Faculty of Engineering of the University of Porto, Research Centre for Territory, Transports and
      Environment, 4200-465 Porto, Portugal; sara@fe.up.pt (S.F.); fcouto@fe.up.pt (A.C.)
 2    Interdisciplinary Centre of Marine and Environmental Research of the University of Porto,
      4450-208 Matosinhos, Portugal; iiglesias@ciimar.up.pt
 *    Correspondence: lobo@fe.up.pt

 Received: 14 May 2019; Accepted: 4 June 2019; Published: 6 June 2019

 Abstract: Most previous studies show that inclement weather increases the risk of road users being
 involved in a traffic crash. However, some authors have demonstrated a little or even an opposite
 effect, observed both on crash frequency and severity. In urban roads, where a greater number of
 conflict points and heavier traffic represent a higher exposure to risk, the potential increase of crash
 risk caused by adverse weather deserves a special attention. This study investigates the impact of
 meteorological conditions on the frequency of road crashes in urban environment, using the city
 of Porto, Portugal as a case study. The weather effects were analyzed for different types of crashes:
 single-vehicle, multi-vehicle, property-damage-only, and injury crashes. The methodology is based
 on negative binomial and Poisson models with random parameters, considering the influence of daily
 precipitation and mean temperature, as well as the lagged effects of the precipitation accumulated
 during the previous month. The results show that rainy days are more prone to the occurrence of
 road crashes, although the past precipitation may attenuate such effect. Temperatures below 10 ◦ C are
 associated with higher crash frequencies, complying with the impacts of precipitation in the context
 of the Portuguese climate characteristics.

 Keywords: vehicle crashes; property-damage-only crashes; injury crashes; urban environment;
 weather; lagged effects

1. Introduction
     In the last decades, many developed countries have experienced a consistent decrease in the
number of road crashes and victims. However, there is still a great deal of room for improvement
in the developing countries, where the rapid increase of urban population and car ownership puts
an additional pressure on road safety targets [1]. The goals are quite ambitious: the World Health
Organization defines the objective of halving road deaths and injuries worldwide by 2020; the European
Commission goes even further with its “Vision Zero” strategy, adding to the previous objective the
elimination of road fatalities caused by human error by 2050 [2]. In this sense, public authorities and
researchers have been focused for many years on the study of incident/accident causation as a means
to prevent road crashes. The development of automated driving is currently regarded as a centerpiece
of the plans to reduce road crashes and injuries. Therefore, the quest for knowledge on the factors
affecting road safety will continue at least until a full automation of road transport is implemented,
providing crucial inputs to the development of technology and safety regulations.
     The impact of meteorological conditions on road safety is no exception to this collective effort,
having been the object of numerous studies in the past [3]. Different approaches have been used to

Sustainability 2019, 11, 3176; doi:10.3390/su11113176                          www.mdpi.com/journal/sustainability
Sustainability 2019, 11, 3176 2 of 13
highlight the contribution of weather conditions to road crashes with respect to the geographic region,
type of road, type of crash, crash severity, and time scale.
Fixing the time scale is particularly relevant to the objectives of each study [4–6]. The identification
of regional patterns and cross-country comparisons are typically performed on a monthly or yearly
time basis. When the evaluation of pre-crash conditions under adverse weather is the objective, the
time scale is reduced, at least, to a daily basis. In turn, the spatial scope of each study has been
reported as a major factor affecting the relation between weather and road safety. Contradictory
effects of meteorological variables on crash frequency and severity have been reported in the existing
literature [3,4,7], stressing the need for further research, especially in regions where the relation between
weather conditions and road crashes was not previously assessed.
This research consists in the first effort to analyze the weather effects on road crash frequency in
Portugal, using the city of Porto as a case study. Porto is located in the Northern Region of Portugal
and has the particularity of belonging to one of the sunniest countries and, at the same time, one of
the wettest regions in Europe [8]. To accomplish this objective, four negative binomial and Poisson
models were developed to investigate the impact of meteorological conditions on four crash types:
single-vehicle, multi-vehicle, property-damage-only, and injury crashes. The meteorological variables
were selected to characterize the weather conditions on the crash day and the accumulated precipitation
during the previous 30 days. Binary variables representing the road category and weekend days were
used to account for spatial and temporal variations of exposure, overcoming the lack of traffic data.
Because the objective is to evaluate the global impact of rainfall on urban road crashes, this research
does not deal with the potential endogeneity between precipitation and exposure. The impact of
rainfall intrinsically aggregates the impacts of risk and exposure [9], which should not be dissociated
from each other for the purpose of crash frequency analysis.
Therefore, this paper contributes to the knowledge on the relation between meteorological
conditions and road safety by focusing on an unstudied area and by evaluating current and lagged
weather effects on the frequency of four different types of crash. The methods and results presented in
this study may be used to improve daily alerts on traffic safety, particularly by incorporating the effects
of current and past weather conditions at the city scale.
The remainder of this paper is structured as follows. Section 2 provides a literature overview on
previous studies focusing on the relation between weather and crash frequency. The data description
in Section 3 presents the meteorological and crash datasets used in this research. Section 4 details
the random parameters negative binomial and Poisson models. Then, the paper proceeds with the
model estimation in Section 5, and the discussion of the obtained results in Section 6, using different
assessment scenarios. The study’s main conclusions are summarized in Section 7. Finally, Section 8
presents the main limitations of the present analysis and applied methods, providing guidance for
future research.
2. Literature Review
Meteorological conditions are widely referenced as a major factor affecting transport operations.
In general, the performance of all transport modes decreases under adverse weather, as the systems
become more exposed to the risk of congestion, delays, and crashes. Some literature has focused
on the impact of adverse and extreme weather on diverse transport modes in the context of climate
change [10,11]. However, the weather effects on road transport have received a special attention, given
that this mode accounts for the highest share of fatalities, injuries, and property damages.
Precipitation has consistently been identified as the most relevant meteorological condition
affecting road crashes, with simultaneous effects on the visibility, vision, and tire-road friction.
Consequently, it is the most important weather parameter in road safety studies [3,12]. Different
variables have been used to investigate the effects of precipitation with respect to its type (rain or snow)
and time scale.Sustainability 2019, 11, 3176 3 of 13
Most studies in this field have shown that the occurrence of precipitation increases the total crash
frequency; good literature reviews are provided by Theofilatos and Yannis [3] and by Xu et al. [13].
Low-level data aggregation studies consider crash and precipitation variables on a daily or shorter
time scale. The precipitation accumulated during a short period is considered representative of the
pre-crash situations observed during the same period, allowing inferring about the role that adverse
weather conditions, such as reduced visibility and slippery road, play on the increase of crash frequency.
Eisenberg [4], Brijs et al. [5], Keay and Simmonds [14], and Black et al. [15] are among the numerous
authors that found a strong positive correlation between daily precipitation and crash frequency. These
studies were developed in distinct geographic contexts, such as The Netherlands [5], Australia [14],
and the US [4,15]. In turn, Malin et al. [16] and Norros et al. [17] are among the few studies using an
hourly time scale and categorical precipitation variables. Malin et al. [16] analyzed the entire main
road network in Finland, including motorways, multi-lane roads, and two-lane roads. The results
showed that the relative accident risk is higher for snowfall in relation to sleet or rain. For the same
type of precipitation, the crash risk increases with the precipitation intensity. The authors also found
that motorways are the road type with the highest crash risk under rainfall or snowfall, contrasting
with the lowest risk observed under good weather conditions. Norros et al. [17] used data from
Helsinki’s Ring-road I to conclude that heavy rain increases crash risk by 190%, while moderate to
heavy snow may increases risk from 470 to 740%. The study by Jaroszweski and McNamara [12]
used a three-hour time scale and obtained contradictory results from four models developed for two
UK cities. In Manchester, the models showed a consistent positive correlation between rainfall and
crash frequency. In London, one model returned a positive correlation, while the other showed a
slightly negative correlation. The results were attributed to the differences between both cities’ urban
morphology and travel behavior, as well as to the use of different meteorological data sources.
In some low-level data aggregation studies, additional precipitation variables related to larger
time periods are included to represent lagged effects, i.e., the impacts of past precipitation on the crash
frequency observed on a daily or shorter period. Eisenberg [4] and Keay and Simmonds [14] analyzed
different periods since the last precipitation and concluded that the crash risk in the first day of rainfall
increases with the duration of the preceding dry spell. The researchers attributed this effect to the
build-up of oil and grime accumulated on the pavement and to the readjustment of driving behavior
to wet conditions. Similarly, Levine et al. [18] found that the crash risk in Hawaii is higher in the first
day of rainfall. Brijs et al. [5] did not find evidence of lagged effects of precipitation.
Studies considering highly aggregated data are usually developed to highlight the seasonal
variation of road crashes, with some authors also performing a cross-region comparison [4,19,20].
This approach tends to confirm the positive correlations between monthly- and yearly-accumulated
precipitation and total crash frequency. Exceptions to this general trend are the studies by Bergel-Hayat
et al. [6] and by Yannis and Karlaftis [21], which found a decrease of crashes under rainfall in the region
of Athens, Greece. The authors speculated that, being rainfall an unusual event in Athens, drivers may
become overly cautious and drive slower to compensate for the rain effects.
The impact of precipitation on crash severity is not so clear. While some authors noted that
severe crashes increase under wet conditions [22–24], others found a contradictory or doubtful effect.
Black et al. [15] obtained an increased risk of injury under rainfall, but the fatality risk did not change
significantly in relation to good weather. Eisenberg [4] and Fridstrøm et al. [19] denoted that rainfall
and snowfall may produce either positive or negative effects on fatal and injury crash frequency,
depending on the quantity of accumulated precipitation and the region under analysis. Martensen
et al. [9] found an increase in the number of victims in 4-wheeled vehicles under rainfall, but a decrease
in two-wheeled vehicles. The authors attributed these results to a plausible decrease in the number
of trips on 2-wheeled vehicles under rainfall, accompanied by an increase in the number of car trips.
Antoniou et al. [25] suggested that the reduction in the number of injury crashes observed in Athens
during the winter might be explained by the reduction of mobility under adverse weather.Sustainability 2019, 11, 3176 4 of 13
In addition to precipitation, other meteorological conditions have been analyzed in the literature,
such as the air temperature, sunlight, and wind speed. Overall, these parameters represent a much
smaller and/or doubtful influence on road crashes than rainfall or snowfall. The air temperature has
shown a predominantly negative correlation with crash frequency [5,17,24,26], although some studies
had found an opposite effect [6,21]. Daily temperatures corresponding to extreme deviations from the
seasonal standards were associated to higher crash frequencies by Brijs et al. [5] and by Malyshkina
et al. [27]. Norros
Sustainability 2019, 11, xetFOR
al. PEER
[17], REVIEW
and Fridstrøm et al. [19] found a negative correlation between daylight 4 of 14
duration and road crashes, but Brijs et al. [5] points toward an opposite effect. The latter study also
demonstrates
effect. The latterthat study
sun dazzle
also during the winter
demonstrates thatmay
sunbedazzle
a factorduring
of increased risk, and
the winter maythat
be wind speed
a factor of
is only significant
increased risk, andfor heavy
that windstorms
speedand/or
is onlyheavy vehicles.
significant for heavy storms and/or heavy vehicles.
In the end, two major insights can be be extracted
extracted from
from the
the literature.
literature. First, the weather variables
that are
are not
notrelated
relatedwith withprecipitation
precipitationhave
have a highly inconsistent
a highly inconsistenteffect on road
effect crashes,
on road suggesting
crashes, that
suggesting
they may modify crash conditions, but are not a root cause of crash occurrence
that they may modify crash conditions, but are not a root cause of crash occurrence [26]. Second,[26]. Second, regional
climatology and driving
regional climatology andbehavior play an important
driving behavior role on the
play an important type
role on and magnitude
the type of the weather
and magnitude of the
effects
weather [6,21], highlighting
effects the need the
[6,21], highlighting for new
needresearch
for new in non-studied
research areas.
in non-studied areas.
3. Meteorological and
3. Meteorological and Crash
Crash Data
Data
Portugal
Portugal is located in
is located in the
the West
West coast
coast of
of the Iberian Peninsula
the Iberian Peninsula and
and is characterized by
is characterized by aa temperate
temperate
climate
climate with a dry season and a hot summer [28]. Strong differences arise between north-south and
with a dry season and a hot summer [28]. Strong differences arise between north-south and
coastal-inland
coastal-inland Portugal
Portugal[29],
[29],showing
showingan animportant
importantinter-annual
inter-annualvariability
variabilityinin
temperature,
temperature, butbut
also in
also
precipitation, which ranges from about 400 to over 2200 mm/year [30,31]. Porto is located
in precipitation, which ranges from about 400 to over 2200 mm/year [30,31]. Porto is located at one of at one of
the
the wettest
wettest regions
regions in
in continental
continental Europe
Europe [8]. The city’s
[8]. The city’s characterization
characterization in
in terms
terms of
of precipitation
precipitation and
and
temperature
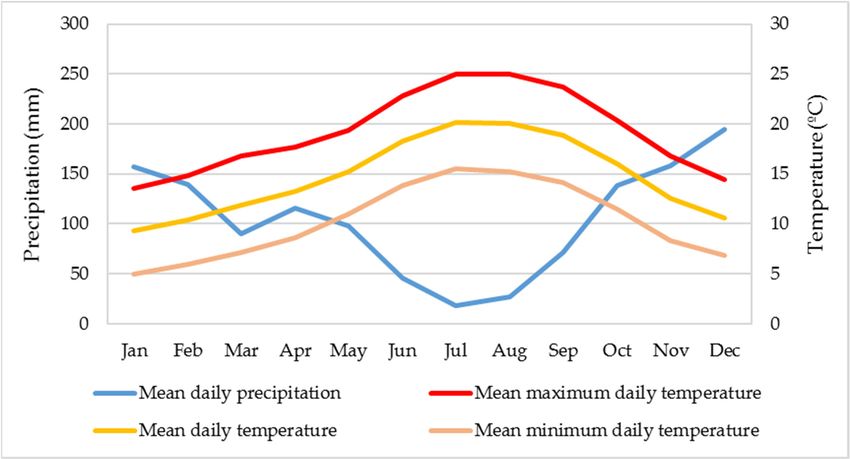
temperature isis presented
presented in
in Figure
Figure 1.
1.
Figure 1. Monthly
Monthly precipitation and temperature in Porto for the period 1971–2000 [32].
In this study, precipitation
precipitation and temperature data were obtained for the period under analysis, analysis,
ranging from January 2001 to October 2005. The daily precipitation
January 2001 to October 2005. The daily precipitation (D), corresponding to the
precipitation height (in mm) accumulated during each calendar day, was retrieved from the
meteorological station
stationofofthe
theGeophysics
Geophysics Institute
Institute of the
of the University
University of Porto,
of Porto, located
located at Serra
at Serra do
do Pilar,
Pilar, nearcity
near the the center.
city center.
The The monthly
monthly precipitation
precipitation represents
represents thethe laggedeffects
lagged effectsofofthis
this meteorological
meteorological
phenomenon, and and was
was obtained
obtainedfor
foreach
eachday
daybybysumming
summingthe thedaily
daily precipitation
precipitation values
values observed
observed in
in the previous 30 days. However, this variable is not considered in the developed models.
the previous 30 days. However, this variable is not considered in the developed models. Instead, an Instead,
interaction term given by the multiplication between daily and monthly precipitations (DM) was
created for modelling purposes to nullify the lagged effects on days without rain.
The mean daily temperature (T) was calculated through the mean value between the minimum
and maximum observed ten-minute air temperature values, retrieved from the meteorological station
located at Porto Airport, in the city’s surroundings [32]. Since a non-linear variation of crash
frequency with air temperature has been reported in previous studies [5,27], two binary variables,Sustainability 2019, 11, 3176 5 of 13
an interaction term given by the multiplication between daily and monthly precipitations (DM) was
created for modelling purposes to nullify the lagged effects on days without rain.
The mean daily temperature (T) was calculated through the mean value between the minimum
and maximum observed ten-minute air temperature values, retrieved from the meteorological station
located at Porto Airport, in the city’s surroundings [32]. Since a non-linear variation of crash frequency
with air temperature has been reported in previous studies [5,27], two binary variables, T10 and T20,
were created for modelling purposes. T10 is set to one if T is smaller than 10 ◦ C, and to zero otherwise;
T20 is set to one if T is equal to or greater than 20 ◦ C, and to zero otherwise. In this sense, T10 and
T20 represent the effects of a lower or a higher value of T, respectively, in relation to the interval
between 10 and 20 ◦ C, considered as the category of reference. The thresholds used to define the three
temperature categories (T < 10 ◦ C, 10 ◦ C ≤ T < 20 ◦ C, and T ≥ 20 ◦ C) were defined taking into account
that the minimum and maximum values of T obtained for the period under analysis were of 3.6 and
30.4 ◦ C, respectively. In the end, four meteorological factors were used as explanatory variables in the
developed models: D, DM, T10, and T20.
Crash data was retrieved from the official Portuguese Police database. This database contains all
the crashes recorded by the police in the city of Porto between January 2001 and October 2005. A total of
25,736 single- and multi-vehicle crashes were reported during this period, excluding pedestrian-vehicle
crashes, which are not considered in this study. Available data includes the date and location of each
crash, the number of vehicles involved, and if there were victims or not. Based on this information,
the original database was disaggregated in two different ways: (i) single-vehicle crashes versus
multi-vehicle crashes, and (ii) property-damage-only crashes versus injury crashes. In the end, four
datasets representing different crash types were used for model estimations.
The crash date and location allowed deriving the number of crashes of each type observed per
day and road category. Each one of the four modelling datasets is a panel data with four observations
per day; the dependent variable represents the crash counts observed per day in each category’s
entire network. The four road categories established by Porto’s master plan were used to capture the
spatial variation of traffic, aiming to overcome the lack of traffic data. In this sense, four explanatory
binary variables were introduced in the models to set the road category and act as proxies for risk
exposure: arterial (ART), principal distributor (PD), local distributor (LD), and local access (LA); in
each observation, only the proxy variable of the corresponding road category is set to one, with the
others being set to zero. An additional binary variable for weekends (WEND), set to one on weekend
days and to zero otherwise, was introduced to capture the temporal variation of traffic volume. Other
calendar effects (e.g., day of the week, month of the year, and season) were tested using additional
binary variables. For simplicity, these effects were not included in the final models, since no relevant
variations have been detected on the coefficients of the weather variables.
Table 1 shows the crash counts for each road category by crash type during the period under
consideration. Common descriptive statistics are presented in Table 2.
Table 1. Absolute and relative frequency of crash occurrence by road category and crash type.
Single-Vehicle Multi-Vehicle Property-Damage-Only
Road Category Injury Crashes
Crashes Crashes Crashes
Arterial 461 (15.6%) 3658 (16.0%) 3574 (15.8%) 545 (17.6%)
Principal distributor 821 (27.9%) 7305 (32.1%) 7342 (32.4%) 784 (25.3%)
Local distributor 758 (25.7%) 4816 (21.1%) 4404 (19.5%) 1170 (37.7%)
Local access 907 (30.8%) 7010 (30.8%) 7314 (32.3%) 603 (19.4%)
Total 2947 22,789 22,634 3102Sustainability 2019, 11, 3176 6 of 13
Table 2. Variable description.
Variable Mean Standard Deviation Minimum Maximum
Number of crashes per day
Single-vehicle 1.7 1.5 0.0 10.0
Multi-vehicle 13.2 5.5 1.0 34.0
Property-damage-only 13.1 5.4 1.0 35.0
Injury 1.8 1.4 0.0 8.0
Precipitation (mm)
Daily 3.2 8.3 0.0 80.9
Monthly 97.5 98.3 0.0 567.2
Daily mean temperature (◦ C) 14.9 4.4 3.6 30.4
4. Methodological Approach
The number of crashes per day, as a non-negative integer, is usually modelled using count
regression techniques. Poisson and negative binomial models are commonly used to represent count
data. While the former imposes that the mean equals the variance, the latter is usually preferred when
data is overdispersed, i.e., when the variance is significantly higher than the mean. Past studies have
tested different models to deal with the overdispersion typically affecting road crash data [22,33–35].
In this study, tests for overdispersion were used to verify the hypothesis of the variance being equal to
the mean (null hypothesis) for each one of the four crash modelling datasets, as suggested by Cameron
and Trivedi [36]. The results allowed selecting the most appropriate model for each dataset.
The Poisson model specifies that each observation yi is drawn from a Poisson distribution with
parameter λi , related to a vector of explanatory variables Xi , and can be expressed as follows:
y
e−λi ·λi i
Prob(Y = yi Xi ) = . (1)
yi !
The parameter λi represents the expected number of crashes for observation i (λi = E{Y}). The
log-linear function used to link λi with Xi is given by:
λi = eβXi , (2)
where β is a vector of coefficients of the explanatory variables.
To deal with overdispersed crash data, the negative binomial model adds an error term to the
Poisson model, such as the parameter λi becomes:
λi = eβXi +εi , (3)
where εi is a gamma-distributed error term with mean equal to one and variance α. The error term
allows the variance to differ from the mean, since Var{Y} = λi + α. λi 2 . The probability density function
of the negative binomial model can be defined as:
Γ(θ + yi )
Prob(Y = yi Xi ) = ·uθ ·(1 − ui ) yi , (4)
Γ(θ)·Γ( yi + 1) i
where Γ(.) is a gamma function, θ = 1/α, α is the dispersion parameter, and ui = θ/(θ + λi ). When α is
equal to zero, θ → ∞, and the negative binomial distribution reverts to the Poisson distribution.
Since all the road category variables are included in the model, no intercept is considered. Given
the macroscopic nature of the road functional classification, these variables may incorporate an array
of unobserved heterogeneous factors that vary across observations of the same road category. To deal
with this heterogeneity, a random parameters approach was followed [37,38], such as:
βi = β + ωi , (5)Sustainability 2019, 11, 3176 7 of 13
where ωi is a normally distributed term with mean equal to zero and variance σ2 affecting the coefficients
of road category variables (ωi = 0 for the remaining variables). The parameter λi in the Poisson and
negative binomial models is respectively reformulated by the following expressions:
λi ωi = eβi Xi , (6)
λi ωi = eβi Xi +εi , (7)
Model estimations were performed through a simulated maximum likelihood method developed
by Greene [39], using econometric software Limdep 9.0.
5. Model Estimation
The overdispersion tests revealed that the null hypothesis of the variance being equal to the mean
was rejected for all models except the one for injury crashes, because the resulting values in this case
are lower than the critical value from the χ2 table for one degree of freedom (3.84). Therefore, the
models for single-vehicle, multi-vehicle, and property-damage-only crashes were estimated using a
negative binomial regression, while the model for injury crashes was estimated through a Poisson
regression. Modelling results are presented in Table 3.
Table 3. Modelling results.
Single-Vehicle Multi-Vehicle Property-Damage-Only Injury Crash
Variable Crash Model Crash Model Crash Model Model
Coefficient (σ) Coefficient (σ) Coefficient (σ) Coefficient (σ)
−1.494 * 0.750 * 0.722 * −1.221 *
ART
(0.367 *) (0.324 *) (0.309 *) (0.247 *)
1.484 * 1.478 * −0.867 *
PD −0.847 *
(0.180 *) (0.182 *) (0.290 *)
−1.056 * 1.075 * 0.971 * −0.468 *
LD
(0.516 *) (0.098 *) (0.132 *) (0.284 *)
1.457 * 1.489 * −1.133 *
LA −0.745 *
(0.054 *) (0.037 *) (0.301 *)
WEND 0.113 * −0.398 * −0.372 * −
D 0.021 * 0.010 * 0.011 * 0.012 *
DM −4.7 × 10⁻⁵ * − − −4.6 × 10⁻⁵ *
T10 0.114 ** 0.091 * 0.092 * 0.130 *
T20 − −0.088 * −0.076 * −
α 5.653 * 20.582 * 19.821 * −
Single-Vehicle Multi-Vehicle Property-Damage-Only Injury Crash
Crash Model Crash Model Crash Model Model
Number of
6,912 6,912 6,912 6,912
observations
Overdispersion test
5.344 8.615 8.699 2.304
[g(λi ) = λi ]
Overdispersion test
5.411 8.285 8.372 2.452
[g(λi ) = λi 2 ]
Log likelihood −5,858 −14,065 −13,997 −5,968
AIC 11,738 28,155 28,021 11,958
Note: σ: Standard deviation of parameter distribution; α: Dispersion parameter for negative binomial models;
* Significant at the 1% level; ** Significant at the 5% level.
The variables associated with daily precipitation and mean temperature below 10 ◦ C show positive
correlations with crash frequency, represented by coefficients that are reasonably stable across the four
models. The effect of a mean daily temperature higher than 20 ◦ C is statistically significant only for
multi-vehicle and property-damage-only crashes, with a negative correlation. The lagged effects ofSustainability 2019, 11, 3176 8 of 13
monthly precipitation are only statistically significant for single-vehicle and injury crashes, denoting a
negative impact on frequency.
As previously mentioned, the remaining variables were introduced with the sole purpose of being
a proxy for risk exposure, taking advantage of easily accessible data to overcome the lack of traffic
counts. Since the focus of this research is to analyze the influence of weather conditions, and that an
in-depth analysis of risk exposure would require the detailing of its main drivers, the results obtained
for the proxy variables are not discussed. Therefore, the following section highlights the relevance of
the analyzed meteorological effects on the frequency of each crash type.
6. Discussion of Results
Table 3 demonstrates that the impact of weather conditions on road crash frequency results from
the combination of different meteorological factors that, individually, may produce either positive or
negative impacts, especially if lagged effects are considered. To provide a better insight on these impacts,
based on the coefficients shown in Table 3, the percent variation measuring the responsiveness of crash
frequency to the variation of each meteorological factor was computed for the following scenarios:
• S1: The daily precipitation doubles, while the monthly precipitation is maintained at the sample
mean and the daily mean temperature lies between 10 and 20 ◦ C;
• S2: The daily precipitation doubles in the first day of rainfall after a dry spell greater than one
month, i.e., the monthly precipitation is null, and the daily mean temperature lies between 10 and
20 ◦ C;
• S3: The monthly precipitation doubles, while the daily precipitation is maintained at the sample
mean and the daily mean temperature lies between 10 and 20 ◦ C;
• S4: The daily mean temperature is lower than 10 ◦ C, while daily and monthly precipitations are
maintained at the sample mean;
• S5: The daily mean temperature is equal to or higher than 20 ◦ C, while daily and monthly
precipitations are maintained at the sample mean.
The results for each scenario are presented in Table 4.
Table 4. Estimated percent variations of crash counts in different scenarios.
Single-Vehicle Multi-Vehicle Property-Damage-Only
Scenario Injury Crashes
Crashes Crashes Crashes
S1 4.5% 3.3% 3.7% 1.5%
S2 7.2% 3.3% 3.7% 4.0%
S3 −2.3% − − −2.3%
S4 12.1% 9.6% 9.6% 13.9%
S5 − −8.4% −7.3% −
The occurrence of precipitation and temperature values below 10 ◦ C are the most relevant
meteorological factors affecting road crashes in Porto, increasing the number of crashes, regardless
their classification (Table 3). Considering the results of most previous studies [3,13], the interpretation
of the daily precipitation effect is straightforward; in rainy days, the deterioration of visibility and
tire-road friction leads to the occurrence of more crashes. From Table 4, it is possible to conclude that
the impact of doubling the daily precipitation is generically higher in the first day of rainfall after a
long dry spell (S2) than in a day following a month with average precipitation (S1), specifically 7.2%
versus 4.5% for single-vehicle crashes, and 4.0% versus 1.5% for injury crashes. The results obtained
for Porto are aligned with the findings obtained by Eisenberg [4], Keay and Simmonds [14] and Levine
et al. [18] across different regions of the globe. In the case of multi-vehicle and property-damage-only
crashes, the respective impacts of 3.3% and 3.7% do not vary between S1 and S2, because the frequencySustainability 2019, 11, 3176 9 of 13
of these crashes do not depend on lagged effects, in accordance with the results shown in Table 3. This
fact further highlights the relevance of visibility loss and wet pavement to the occurrence of collisions
between vehicles.
The lagged effects of precipitation are, according to Eisenberg [4] and Keay and Simmonds [14],
essentially associated with two main factors: oil and grime accumulated on the pavement and driving
behavior. When rainfall starts, the build-up of oil and grime on the road surface and a non-immediate
readjustment of driving behavior to hazardous weather conditions increase the crash risk beyond
the impacts of the reduced visibility and wet pavement associated with a rainy day. If the rainfall
period proceeds, the crash risk starts to fall at some point in time, because the pavement becomes
completely cleaned and drivers get used to counteract the inclement weather effects by adopting more
careful driving practices, such as reducing speed and paying more attention to their surroundings.
The moment at which the crash risk reverts its growing trend is very difficult to determine, because it
depends on the quantity of oil and grime accumulated during the previous dry spell, as well as on the
driving culture and behavior.
In this study, the interaction term DM was considered to represent the lagged effects of precipitation.
Given that the impacts of daily precipitation on crash frequency always have a positive sign (Table 3),
the sign of DM coefficients may be attributed to the influence of monthly precipitation. When
statistically significant, the effect of DM counteracts the increase of crash frequency attributed to the
daily precipitation. Therefore, the increase of the precipitation during the previous month seems to
capture the reversing trend of the crash risk associated with the lagged effects described above. In
fact, it is reasonable to assume that, after a rainy month, the pavement is completely cleaned from oil,
and that drivers already had enough time to readjust their behavior to compensate for the adverse
meteorological conditions. In Table 4, it is possible to observe that the expected reduction of crash
frequency in Porto caused by doubling DM, while maintaining constant the daily precipitation (S3), is of
2.3% both for single-vehicle and injury crashes. The relevance of DM for the decrease of single-vehicle
and injury crashes further supports the existence of a behavioral adaptation to adverse weather, as
these crashes are typically associated with the practice of higher speeds.
The mean daily temperature seems to have a negative correlation with crash frequency, in line
with the results obtained by Brijs et al. [5], El-Basyouny and Kwon [24] and Andreescu and Frost [26].
Specifically, the temperature ranges sitting below and above the category of reference (10 ◦ C ≤ T <
20 ◦ C) are respectively associated with an increase or a decrease of crash frequency. According to
Table 4, when the mean daily temperature decreases from the category of reference to a value below
10 ◦ C, maintaining constant the precipitation variables (S4), single-vehicle crashes increase by 12.1%,
multi-vehicle and property-damage-only crashes increase by 9.6%, and injury crashes increase by
13.9%. While these results suggest a higher crash risk for lower temperature values, it should be
noted that such effect is hardly associated with snowfall or roadway icing. These events are extremely
rare in Porto, since winter seasons are predominantly wet, and a minimum mean daily temperature
of 3.6 ◦ C has been observed during the five years considered in this study. In turn, when the mean
daily temperature climbs above 20 ◦ C (S5), only multi-vehicle and property-damage-only crashes
are affected, experiencing a decrease of 8.4% and 7.3%, respectively, in relation to the category of
reference. As multi-vehicle and property-damage-only crashes represent the great majority of crash
occurrences in Porto, higher temperatures do not seem to produce a relevant impact on more specific
crash situations, represented by single-vehicle and injury crashes. From the results of this study, and in
compliance with the findings by Andreescu and Frost [26], it is possible to infer that the temperature
may represent seasonal meteorological effects beyond rainfall that are generically associated with the
occurrence of the majority of road crashes, but acts more as a modifier of crash conditions than as a
root cause. In this sense, S4 and S5 provide an idea about the variation of crash frequency attributed to
seasonal meteorological factors beyond rainfall.Sustainability 2019, 11, 3176 10 of 13
7. Conclusions
The impacts of inclement weather on the occurrence of road crashes has been studied by researchers
for a long time, demonstrating clear evidence of a cause-effect relationship between both phenomena.
However, that relationship is affected by regional climate and driving behavior patterns, with some
authors reporting contradictory effects produced by identical meteorological factors.
This research introduces a novel perspective on the study of meteorological impacts on crash
frequency by analyzing different types of urban road crashes, focusing on the number of vehicles
involved and on the existence of victims. Additionally, this analysis is the first contribution to the
subject developed in Portugal, highlighting the regional patterns of a previously unstudied area. In
this sense, the influence of weather conditions on the crash counts registered in the city of Porto were
evaluated, dividing the police crash database, in a first stage, between single-vehicle and multi-vehicle
crashes and, in a second stage, between property-damage-only and injury crashes. Subsequently,
four negative binomial or Poisson regression models were estimated to analyze the effects of diverse
meteorological factors, including the daily precipitation and mean temperature, and the precipitation
accumulated during the previous week and month.
The results demonstrate that the daily precipitation and mean temperature below 10 ◦ C present
a positive correlation with the number of daily crashes. These results are consistent across the
four developed models. The impact of temperatures above 20 ◦ C is only statistically significant
for multi-vehicle and property-damage-only crashes, presenting a negative correlation. In turn, the
precipitation during the previous month is negatively correlated with single-vehicle and injury crashes.
These results support the following main conclusions:
• An increase of daily precipitation, associated with a loss of visibility and wet pavement, increases
the overall crash counts. The impacts are higher on the first day of rainfall;
• The impacts of daily precipitation tend to be counteracted by the lagged effects of past precipitation
observed in the long term, presumably because of the pavement cleaning from oil and grime and
the readjustment of driving behavior to adverse meteorological conditions;
• Lower temperatures are associated with an increase of crash frequency. Higher temperatures
are related with a decrease in the number of crashes, but this effect may not be significant for
less frequent crash types. The temperature reflects seasonal weather effects, but may hardly be
described as a root cause of road crashes;
• The observed meteorological impacts on crash frequency in Porto are in line with the impacts
found in other regions of the globe, confirming the general tendency to associate precipitation
and winter months with an increase of crash counts [3,13].
From a broader perspective, this work belongs to a set of studies focused on the meteorological
impacts on road safety, helping to understand one of the main issues contributing to crash occurrence.
The results of such studies provide relevant inputs to the development of advanced driver-assistance
systems, being crucial to the safety and acceptance of fully-automated vehicles. New driving technology
is required to continuously monitor driving conditions, including weather-related parameters, such
as visibility and tire-road friction, and to adequately intervene in every situation with the aim of
protecting all road users.
Finally, in the actual context of climate change, the projections presented by the Intergovernmental
Panel on Climate Change Fifth Assessment Report (AR5) depict, among others, a temperature increase,
changes in the precipitation patterns, and an increase in the number and strength of extreme weather
events related with rainfall and wind [40]. These changes, predicted all over the world, can vary
from one region to another, reinforcing the need to continuously report and link the meteorological
variables to several phenomena, of which road crashes are an example. Therefore, the examination
of the impact of meteorological conditions on road crashes is of critical importance and should be
continuously evaluated.Sustainability 2019, 11, 3176 11 of 13
8. Limitations and Future Research
Future research should address the main limitations of this study, particularly seeking for a better
specification of risk exposure and for cross-region comparisons that allow for more representative
insights. The evaluation of risk exposure may be a difficult task, especially if no traffic data is available,
as it is the case of this study. In fact, risk exposure usually depends on a wide array of factors that are
not always easy to quantify, including a complete characterization of the roadway infrastructure and
surrounding environment (e.g., geometric parameters and roadside activities), and the knowledge of
road users’ decisions about everyday mobility (e.g., variations in modal choice and special events).
Even if traffic data is available, some sort of aggregation is necessary to comply with the spatial and/or
temporal units of the crash counts. The consideration of calendar effects (e.g., month of the year, day of
the month, day of the week, and hour of the day) is also dependent on the selected time unit.
In turn, regional comparisons are strongly dependent on data availability. If comparable data is
available for different regions, then the influence of diverse geographic, meteorological, and cultural
patterns may be highlighted.
Finally, since pedestrians bear the highest burden of traffic injuries [41], it is important to investigate
the contribution of the weather effects to pedestrian-vehicle collisions. Therefore, the authors plan to
extend this research to this type of crashes in the near future.
Author Contributions: Conceptualization: A.L., S.F., I.I., and A.C.; methodology: A.L., S.F., and A.C.; formal
analysis: A.L. and A.C.; resources: S.F., I.I., and A.C.; data curation: A.L. and I.I.; writing—original draft
preparation: A.L and I.I.; writing—review and editing: A.L., S.F., I.I., and A.C.
Funding: This research was performed as part of the employment of the authors at the Faculty of Engineering of the
University of Porto (A.L., S.F. and A.C.), and at the Interdisciplinary Centre of Marine and Environmental Research
of the University of Porto (I.I.). The authors want to acknowledge the CITTA Strategic Fund UID/Multi/04427/2013
and the CIIMAR Strategic Funding UID/Multi/04423/2019 financed through national funds provided by FCT –
Foundation for Science and Technology and European Regional Development Fund (ERDF).
Acknowledgments: The authors would like to thank the Geophysics Institute of the University of Porto, the
Portuguese Institute for Sea and Atmosphere, and the National Road Safety Authority of Portugal for the
meteorological and crash data provided.
Conflicts of Interest: The authors declare no conflict of interest.
References
1. World Health Organization. Global Status Report on Road Safety 2013: Supporting a Decade of Action; World
Health Organization: Geneva, Switzerland, 2013.
2. European Commission. White Paper on Transport—Roadmap to a Single European Transport Area; Publications
Office of the European Union: Luxembourg, 2008.
3. Theofilatos, A.; Yannis, G. A review of the effect of traffic and weather characteristics on road safety. Accid.
Anal. Prev. 2014, 72, 244–256. [CrossRef] [PubMed]
4. Eisenberg, D. The mixed effects of precipitation on traffic crashes. Accid. Anal. Prev. 2004, 36, 637–647.
[CrossRef]
5. Brijs, T.; Karlis, D.; Wets, G. Studying the effect of weather conditions on daily crash counts using a discrete
time-series model. Accid. Anal. Prev. 2008, 40, 1180–1190. [CrossRef] [PubMed]
6. Bergel-Hayat, R.; Debbarh, M.; Antoniou, C.; Yannis, G. Explaining the road accident risk: Weather effects.
Accid. Anal. Prev. 2013, 60, 456–465. [CrossRef] [PubMed]
7. Edwards, J.B. The Relationship Between Road Accident Severity and Recorded Weather. J. Saf. Res. 1998, 29,
249–262. [CrossRef]
8. Miranda, P.M.A.; Coelho, F.E.S.; Tomé, A.R.; Valente, M.A.; Carvalho, A.; Pires, C.; Pires, H.O.; Pires, V.C.;
Ramalho, C. 20th Century Portuguese Climate and Climate Scenarios. In Climate Change in Portugal: Scenarios,
Impacts and Adaptation Measures; Santos, F.D., Forbes, K., Moita, R., Eds.; Gradiva: Lisbon, Portugal, 2002;
pp. 23–83.
9. Martensen, H.; Focant, N.; Diependaele, K. Let’s Talk about the Weather—Interpretation of Short Term
Changes in Road Accident Outcomes. Transp. Res. Proc. 2016, 14, 96–104. [CrossRef]Sustainability 2019, 11, 3176 12 of 13
10. Changnon, S.A. Effects of summer precipitation on urban transportation. Clim. Chang. 1996, 32, 481–494.
[CrossRef]
11. Koetse, M.J.; Rietveld, P. The impact of climate change and weather on transport: An overview of empirical
findings. Transp. Res. D Transp. Environ. 2009, 14, 205–221. [CrossRef]
12. Jaroszweski, D.; McNamara, T. The influence of rainfall on road accidents in urban areas: A weather radar
approach. Travel Behav. Soc. 2014, 1, 15–21. [CrossRef]
13. Xu, C.; Wang, W.; Liu, P. Identifying crash-prone traffic conditions under different weather on freeways.
J. Saf. Res. 2013, 46, 135–144. [CrossRef]
14. Keay, K.; Simmonds, I. Road accidents and rainfall in a large Australian city. Accid. Anal. Prev. 2006, 38,
445–454. [CrossRef] [PubMed]
15. Black, A.W.; Villarini, G.; Mote, T.L. Effects of Rainfall on Vehicle Crashes in Six U.S. States. Weather Clim.
Soc. 2017, 9, 53–70. [CrossRef]
16. Malin, F.; Norros, I.; Innamaa, S. Accident risk of road and weather conditions on different road types. Accid.
Anal. Prev. 2019, 122, 181–188. [CrossRef] [PubMed]
17. Norros, I.; Kuusela, P.; Innamaa, S.; Pilli-Sihvola, E.; Rajamäki, R. The Palm distribution of traffic conditions
and its application to accident risk assessment. Anal. Methods Accid. Res. 2016, 12, 48–65. [CrossRef]
18. Levine, N.; Kim, K.E.; Nitz, L.H. Daily fluctuations in Honolulu motor vehicle accidents. Accid. Anal. Prev.
1995, 27, 785–796. [CrossRef]
19. Fridstrøm, L.; Ifver, J.; Ingebrigtsen, S.; Kulmala, R.; Thomsen, L.K. Measuring the contribution of randomness,
exposure, weather and daylight to the variation in road accidents. Accid. Anal. Prev. 1995, 27, 1–20. [CrossRef]
20. Chang, L.Y.; Chen, W.C. Data mining of tree-based models to analyze freeway accident frequency. J. Saf. Res.
2005, 36, 365–375. [CrossRef]
21. Yannis, G.; Karlaftis, M.G. Weather Effects on Daily Traffic Accidents and Fatalities: A Time Series Count
Data Approach. In Proceedings of the Transportation Research Board 89th Annual Meeting Compendium of
Papers, Washington, DC, USA, 10–14 January 2010.
22. Caliendo, C.; Guida, M.; Parisi, A. A crash-prediction model for multilane roads. Accid. Anal. Prev. 2007, 39,
657–670. [CrossRef]
23. Jung, S.; Qin, X.; Noyce, D.A. Rainfall effect on single-vehicle crash severities using polychotomous response
models. Accid. Anal. Prev. 2010, 42, 213–224. [CrossRef]
24. El-Basyouny, K.; Kwon, D.W. Assessing Time and Weather Effects on Collision Frequency by Severity in
Edmonton Using Multivariate Safety Performance Functions. In Proceedings of the Transportation Research
Board 91st Annual Meeting Compendium of Papers, Washington, DC, USA, 22–26 January 2012.
25. Antoniou, C.; Yannis, G.; Katsohis, D. Impact of Meteorological Factors on the Number of Injury Accidents.
In Proceedings of the 13th World Conference on Transport Research, Rio de Janeiro, Brazil, 15–18 July 2013.
26. Andreescu, M.P.; Frost, D.B. Weather and traffic accidents in Montreal, Canada. Clim. Res. 1998, 9, 225–230.
[CrossRef]
27. Malyshkina, N.V.; Mannering, F.L.; Tarko, A.P. Markov switching negative binomial models: An application
to vehicle accident frequencies. Accid. Anal. Prev. 2008, 41, 217–226. [CrossRef] [PubMed]
28. State Meteorological Agency of Spain and Institute of Meteorology of Portugal. Iberian Climate Atlas—Air
Temperature and Precipitation (1971-2000); AEMET Documentation Unit: Madrid, Spain, 2011.
29. Atlas de Portugal. Available online: http://dev.igeo.pt/atlas/index1.html (accessed on 30 October 2018).
30. Trigo, R.M.; Câmara, C.C. Circulation weather types and their influence on the precipitation regime in
Portugal. Int. J. Clim. 2000, 20, 1559–1581. [CrossRef]
31. Soares, P.M.M.; Cardoso, R.M.; Miranda, P.M.A.; Medeiros, J.; Belo-Pereira, M.; Espírito-Santo, F. WRF
high resolution dynamical downscaling of ERA-Interim for Portugal. Clim. Dynam. 2012, 39, 2497–2522.
[CrossRef]
32. Portuguese Institute for Sea and Atmosphere. Available online: http://www.ipma.pt/en (accessed on 30
October 2018).
33. Lord, D.; Washington, S.P.; Ivan, J.M. Poisson, Poisson-gamma and zero-inflated regression models of motor
vehicle crashes: Balancing statistical fit and theory. Accid. Anal. Prev. 2005, 37, 35–46. [CrossRef] [PubMed]
34. Anastasopoulos, P.C.; Mannering, F.L. A note on modeling vehicle accident frequencies with random-parameters
count models. Accid. Anal. Prev. 2009, 41, 153–159. [CrossRef]Sustainability 2019, 11, 3176 13 of 13
35. Couto, A.; Ferreira, S. A note on modeling road accident frequency: A flexible elasticity model. Accid. Anal.
Prev. 2011, 43, 2104–2111. [CrossRef]
36. Cameron, A.C.; Trivedi, P.K. Regression-based tests for overdispersion in the Poisson model. J. Econom. 1990,
46, 347–364. [CrossRef]
37. Shankar, V.; Albin, R.; Milton, J.; Mannering, F. Evaluating median cross-over likelihoods with clustered
accident counts: An empirical inquiry using the random effects negative binomial model. Transp. Res. Rec.
1998, 1635, 44–48. [CrossRef]
38. Lord, D.; Mannering, F. The statistical analysis of crash-frequency data: A review and assessment of
methodological alternatives. Transp. Res. A Pol. 2010, 44, 291–305. [CrossRef]
39. Greene, W.H. Limdep Version 9.0—Econometric Modelling Guide; Econometric Software, Inc.: Plainview, NY,
USA, 2007.
40. Intergovernmental Panel on Climate Change. Climate Change 2014: Synthesis Report. Contribution of
Working Groups I, II and III to the Fifth Assessment Report of the Intergovernmental Panel on Climate Change;
Intergovernmental Panel on Climate Change: Geneva, Switzerland, 2014.
41. European Commission. Traffic Safety Basic Facts on Pedestrians 2017; European Commission Directorate
General for Transport: Brussels, Belgium, 2017.
© 2019 by the authors. Licensee MDPI, Basel, Switzerland. This article is an open access
article distributed under the terms and conditions of the Creative Commons Attribution
(CC BY) license (http://creativecommons.org/licenses/by/4.0/).You can also read