An RSSI-Based Localization, Path Planning and Computer Vision-Based Decision Making Robotic System - MDPI
←
→
Page content transcription
If your browser does not render page correctly, please read the page content below
electronics
Article
An RSSI-Based Localization, Path Planning and
Computer Vision-Based Decision Making
Robotic System
Jatin Upadhyay 1 , Abhishek Rawat 1 , Dipankar Deb 1, *, Vlad Muresan 2 and
Mihaela-Ligia Unguresan 3
 1    Department of Electrical Engineering, Institute of Infrastructure Technology Research and Management
      (IITRAM), Ahmedabad 380026, India; jatinupadhyay@iitram.ac.in (J.U.); arawat@iitram.ac.in (A.R.)
 2    Department of Automation, Technical University of Cluj-Napoca, Cluj-Napoca 400114, Romania;
      vlad.muresan@aut.utcluj.ro
 3    Department of Chemistry, Technical University of Cluj-Napoca, Cluj-Napoca 400114, Romania;
      Mihaela.Unguresan@chem.utcluj.ro
 *    Correspondence: dipankardeb@iitram.ac.in

 Received: 29 June 2020; Accepted: 13 August 2020; Published: 17 August 2020

 Abstract: A robotic navigation system operates flawlessly under an adequate GPS signal range,
 whereas indoor navigation systems use the simultaneous localization and mapping system or other
 vision-based localization systems. The sensor used in indoor navigation systems is not suitable for
 low power and small scale robotic systems. The wireless area network transmitting devices have
 fixed transmission power, and the receivers get the different values of signal strength based on
 their surrounding environments. In the proposed method, the received signal strength index (RSSI)
 values of three fixed transmitter units are measured every 1.6 m in mesh format and analyzed by
 the classifiers, and robot position can be mapped in the indoor area. After navigation, the robot
 analyzes objects and detects and recognize human faces with the help of object recognition and facial
 recognition-based classification methods respectively. This robot detects the intruder with the current
 position in an indoor environment.

 Keywords: RSSI navigation; random forest regression; object detection; facial detection

1. Introduction
      In an indoor environment, satellite GPS signals do not have adequate strength due to
multipath reflection from indoor objects [1–4]. Radio frequency identification (RFID)-based localization
technology needs an RFID tag placed over a certain area for a randomly moving agent, and identifies
the position and makes decisions [5,6]. However, if the agent misses the tag, then it is hard to
achieve accurate localization. The ultra-wideband and infrared-based localization methods have higher
accuracy than the RFID based methods [7]. Identifiable signatures, such as Wi-Fi, escalators, and high
tension transmission lines influence sensor-based indoor navigation [8]. Jovicic et al. suggested that
visible light communication through LED can be precise in tracking individuals in an indoor area [9]
and Complementary Metal Oxide Semiconductor (CMOS)-based cameras decode the information
transmitted [10]. The movement in the dynamic environment can be sensed by a change in the data
rate. As the distance increases the received power (in dB) decreases [11]. The power spectral density
(dBm/MHz) is also affected by the increment in the distance. The use of a power amplifier reduces
the reduction rate of received power with respect to distance [12]. The link quality can be measured
from different key performance evaluation parameters, such as received signal strength index (RSSI),
link quality index (LQI), signal to noise ratio (SNR), and bit error rate (BER). These parameters are

Electronics 2020, 9, 1326; doi:10.3390/electronics9081326                    www.mdpi.com/journal/electronics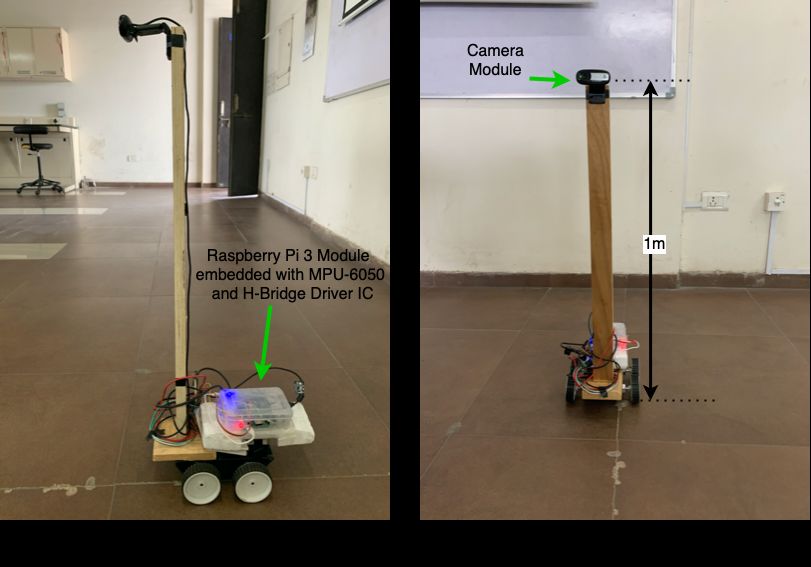
Electronics 2020, 9, 1326                                                                           2 of 15

directly provided by the transceivers and the significance of such parameters varies with hardware
placements and different vendors provide different weights to these parameters [13]. Han et al.
stated that merely RSSI signal improvement may not lead to position accuracy and suggested
media access control (MAC) addresses for higher accuracy in buildings. The RSSI based localization
method with a hybrid model of Gaussian progress regression and convolutional neural network
(CNN) method outperforms the nearest neighbors investigation method [14]. Random forest-based
forecasting converges more possible inputs than linear regression, multiple linear regression, and CNN
networks [15].
      Naghdi et al. used four transmitter nodes to scan and test the area (10.945 m × 6.401 m) for two
different test cases, that is, linear movement in two different directions: north–south and east–west,
intending to detect human obstacles and correct them with different artificial intelligence algorithms.
The result confirmed the sudden blockages of more than 87% when using a sliding window received
signal strength index (RSSI) method over-sampled inputs. Human presence reduced the RSSI values
during mapping and also at the time of localization in real-time, and this error was corrected with
the help of classification methods; accuracies of 2.3 m and 3.8 m for north–south and east–west,
respectively, were achieved [16].
      Liu et al. suggested hybrid wireless (HW) fingerprint localization wherein the ratio of RSSI
for different access points is determined, and CNN (convolutional neural network) architecture is
applicable for optimal results from inputs. Large datasets are collected with thousands of entries for
a 12.5 m × 10 m area using nine receiving points for half a month. The average positioning errors
with a hybrid wireless (HW) fingerprint are 4.1681, 4.1145, and 3.9118 m using KNN, SVM, and CNN
classification methods respectively. The accuracy of the CNN based localization method depends
upon parameters like the activation function, learning rate and threshold process. For better accuracy,
these parameters have to check for each entry in the database, which is a prolonged process. Therefore,
this method may be accurate in specific conditions but is not preferable in general [17].
      Wang et al. proposed an RSSI based mobile robotic platform based on the kernel extreme
learning machine (K-ELM) algorithm to localize the robotic system for good accuracy and low
cost of implementation. The authors collected 68,500 samples (53,500 training:15,000 testing) for
an area of 512 m2 (32 m × 16 m) with eight wireless nodes. The authors evaluated the performance
of RSSI based fingerprint localization with the help of a K-ELM-based positioning system, KNN
(k-nearest neighbors), BYS (Bayesian), classic ELM, and OS-ELM (online sequential ELM) algorithms.
Among them, the K-LEM algorithm achieved 90% accuracy at 8.125 m compared to other methods.
The K-LEM achieved a lower root-mean-square error but it took 60.847 s for testing and 0.018 s
for training. The 90% accuracy was achieved at 8.125 m in a relatively higher dimension indoor
(not justified obstacles) environment of 32 m × 16 m using the K-LEM classification method to navigate
the robot [18].
      Potorti et al. have commented on the ISO/IEC 18305:2016 standard which states that three
different kinds of ELTs (entry to be localized/tracked) are: person, robot, and object. This standard
also suggests that the test should be performed separately for each ELTS. There is no scenario defined
for the robotic system. Additionally, the number of tests required is higher for a universal system.
As per the standard, the number of points per floor is in the range of 50 to 200. The accuracy of a
robotic system should not go beyond 4 m or not larger than half the average size of the sample area of
the building [19]. In Microsoft indoor localization competition, developers made a position estimation
for 300 m2 area using a neural network or the K nearest classification-based method. The competition
concluded that the surrounding area affects the prediction model. Other sampling techniques may
improve such results [20].
      In [21], Han et al. stated that only RSSI signal improvement may not lead to position accuracy.
Han et al. proposed the media access control address also plays a vital role to achieve higher accuracy in
multi-story buildings. Based on different MAC addresses received on the different floor, they identified
the floor number and implemented a further localization method for mapping. The authors achieved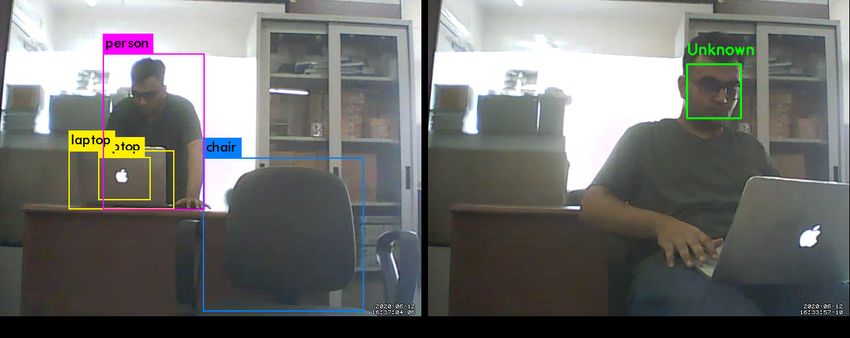
Electronics 2020, 9, 1326                                                                          3 of 15

1.8 m accuracy horizontally with the floor number where the receiver was. In the emerging field
of indoor localization techniques, ultra-wide band (UWB) is a newer technology [22]. For results
required from a large number of features and searches in a random section, the best way is to split each
node [23]. Random forest-based forecasting converges more possible inputs than linear regression,
multiple linear regression, and CNN networks [15]. The estimator calculations for random forest
classification model concerning their features provide a better estimation. If the number of estimators
is calculated, the prediction can be faster for real-time data [24]. Computer vision-based indoor
navigation uses the marker-based approach. Based on the size, shape, distance from the camera,
focusing methods, and different light conditions, the marker-based indoor navigation can be used for
indoor navigation [25]. A robotic system should be capable of navigating in an indoor environment
and have capabilities to understand the surroundings. In the visual localization and mapping method,
the system builds the three-dimensional point cloud model for position estimation and localization.
      For data storage and comparison with real-time data, one needs significant processing capabilities.
Visual localization and mapping have challenges such as the dependency on illumination conditions,
and a high processing time for a dense and complex environment. To process and analyze real-time
data, the graphic processor provides a higher processing speed. For a system with a lower processing
capability, it is hard to achieve real-time processing speed with object detection simultaneously.
The errors in depth measurements are directly related to the distance between the object and the
sensor. If the distance increases, the error also increases. Additionally, the data quality depends upon
the sensor depth resolution [26]. The simultaneous localization and mapping (SLAM)-based indoor
positioning was tested using Microsoft 3D Kinect Sensor inside the laboratory, and the results are
shown in Figure 1. This sensor framework uses a 3D depth sensor which emits infrared pulses and
measures the reflected pulse time. Cloud points in x, y and z co-ordinates are the sensor outputs.
The sensor captures the frames with cloud points at the time of mapping and compares these points in
real-time localization. Based on the cloud point matching ratio, the sensor tries to localize itself in a
real-time environment. The blue track lines represent the sensor movement trajectory with orientation
and sampling position, and the green dots are the perfect match that points to the database value
during the real-time scan. Yellow dots indicate the change in the environment after scanning, or are
signified as unmatched points. Also, the scanning time required to capture the area depends on the
sensors and the processing unit. Sudden movements can affect the mapping and localization results.

                             Figure 1. SLAM-based mapping and localization.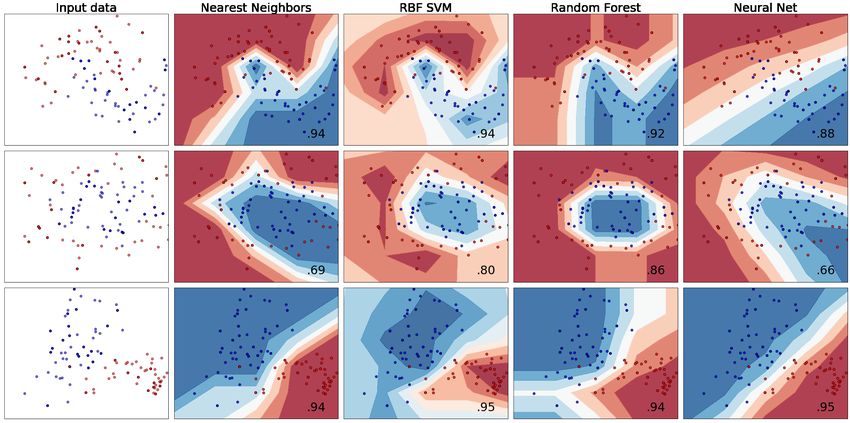
Electronics 2020, 9, 1326                                                                            4 of 15

     To scan an area of 77.51 sq.ft., the sampled database size is greater than 600 MB and this sensor
requires high processing power capability, and so we conclude that the system has an advantage in
accuracy, but is not suitable for applications which run on limited hardware specifications. Additionally,
this sensor will not reliably work in highly illuminated regions, such as window and doors where
sunlight is prominently present, thereby affecting the result. The neural network should be fast at
processing the live video stream.
     The YOLO (you look only once) model for real-time object detection process 45 frames per
second (fps), whereas fast-YOLO processes 55 fps in real-time. By reducing the frame size, real-time
detection is possible with minimal object localization error [27]. An individual facial detection and
object recognition model was deployed on a system-specific low power controlling device [28]. In this
cited article, the continuous data frames were captured by the camera unit and synthesized by the object
detection and facial recognition classification. Computer vision-based human detection is possible with
the help of a microprocessor development board, such as Raspberry Pi 3, and a passive infrared sensor [29].
The image of the person was captured by the camera module and transmitted over a mobile server for
feature extraction, facial detection, and recognition in real-time [30].
     The proposed design is implementable in hardware with a pre-existing wireless module and
should be used to navigate the person or a robotic agent in a complex environment, such as a shopping
mall or a warehouse to transport cargo. The RSSI based indoor navigation is an integral part of the
robotic system to take the necessary action in a specific region. The contributions of this paper are
as follows:

1.     Based on the observations and literature, the RSSI and wireless link quality values continuously
       varied with respect to the changes in the environment, and so a comparative analysis of different
       classification models was made for this method.
2.     The designed framework was implemented in a pre-existing environment without hardware
       modification and with limited power usage.
3.     The integrated cognition-based target selection and path planning framework was implemented.

    In Section 2, the data collection method, system flow, path planning, and facial and object
recognition methods are explained. Section 3 describes the sample distribution, classification
comparison, and prediction accuracy. Conclusions and future work are described in Section 4.

2. Methodology
     The navigation method should be reliable and accurate in a frequently changing indoor
environment. The RSSI-based print technique registers multiple sampling inputs from different wireless
local area network nodes. The scanning points collecting the signal quality and the signal strength
values based upon signal to noise ratio and data rate, are received. The drawbacks include false
localization for small sample size data. The system’s pseudo-flow graph is in Algorithm 1. In this
proposed system, 60,000 samples per position are collected at the rate of 30 ms/sample through a
Raspberry Pi module. At the time as sampling from different positions, the robot also registers the
angle and distance for the next and the previous sampling points using 3-axis magnetometer and
accelerometer. Here Ps is the respective sampling position, Pe is the estimated position, and DB is the
measured RSSI value.
     The link quality of the wireless data link may depend upon signal interference plus noise ratio
(SINR), packet delivery ratio (PDR), and bit error rate (BER). The accuracy depends on the wireless data
card manufacturer. In this study, the idle link quality Q was 70, and so the sampling values were meant
to be in the range of 35 to 60. The samples could not be accepted for the database until its link quality
was within this range. The robot/modules which collect data waited for link quality improvements.
During real-time positioning, the system again collects the data of link quality and RSSI values, which is
the input for the prediction model for the estimation of the present position. The robot/module then
moves towards the nearest sampling point, again collecting the same information, and predicts the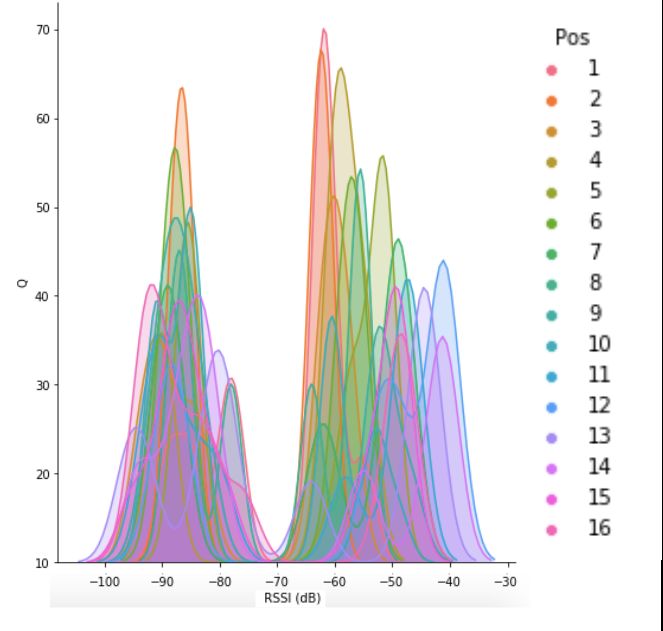
Electronics 2020, 9, 1326                                                                         5 of 15

model. If a nearby point adheres to the predicted position, the previous scanning point is considered
the correct localized point to calculate the optimum path planning. Here n is the number of sampled
positions; r = 1, 2, or 3, are the data collected from individual transmitters. θnn is the angle between
corresponding sampling points and Dnn is the corresponding distance. Pe is the estimated position
calculated from the classification model. The actual position calculation takes place after the current
position estimation, and the robot moves to the nearby positions to estimating their corresponding
positions. If the nearby position is not as per the prediction, the system again scans for new data.
     As the sample size contained more than 1,200,000 samples for 20 nodes (60,000 samples per
positions i.e., 30 ms/sample), the decision was made through the prediction and classification models
as per fitness scores. For the minimal surrounding environment, error nodes in a triangular fashion
are shown in Figure 2.

   Algorithm 1: Calculate Pn => Xmr , tm , Qmr , m = 1, 2, ..., > 60, 000.
     Data: Ps
     Result: More than 60,000 sample values per each Position
     initialization;
     while Sampling Ends do
         Ps ; if 35 < q < 65 then
              Sample Q, DB;
              wait until Q increases;
         else
              Qmr ← varies, update if Qmr > 55;
              DBmr ← RSSI(dB);
              θnn ← Angle of new sampling point;
              Dnn ← Distance between respective sampling point;
         end
     end
     Data: Applying suitable Prediction model on Real-Time Scan
     Result: Real-time Position Prediction
     initialization;
     while Q > 60; Sample DB do
         Ps ← Predict Position;
         if 45 < quality < 65 then
              Store Ps
         else
              Predict Again;
         end
         if (error = Ps - Pe ); then
              Error < 0.5 m, True Position
         else
              Sample Again
         end
     end

      The generated database was tested for k nearest neighbors (KNN), random forest (RF), the radial
bias function kernel-support vector machine (RBF SVM), and the multi-layer perceptron (MLP) neural
network (NN) classification models. The inputs were applied to these models and we calculated fit
score with RMS error. The sample data were taken in the classroom and passage area. The black
dotted points were the sample area and Tx1 , Tx2 , and Tx3 were wireless local area networks. D1 ,
D2 , and D3 were the distance between starting the sampling point from position 1 to transmitters.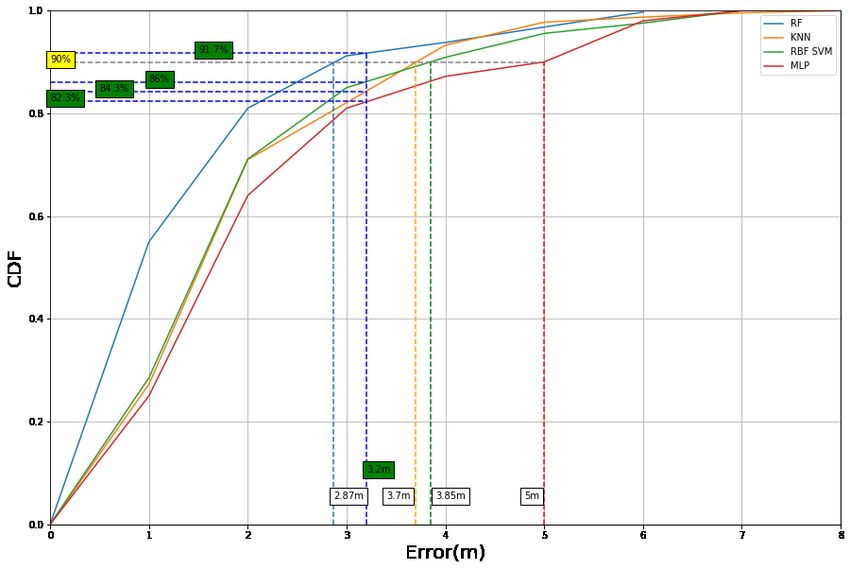
Electronics 2020, 9, 1326                                                                            6 of 15

The different position of wireless node points affects the result. A total of 20 samples are collected in
25 m2 (10 m × 2.5 m) area.

                                Figure 2. RSSI values for different positions.

     The system flow graph is in Figure 3. The robot asks for user input mapping position for the
database. For better accuracy, the mapping point should be as dense as possible, and so here the
distance between two consecutive points is 0.5 m. The system registers the link quality and the RSSI
values for all the samples and points under consideration. The database stores these values as Q
(link quality out of 70), DB (RSSI value), and Pos (position number), and also two separate CSV files
which are operated by model defining and prediction modules. The model prediction module uses
data-specific regression or classification models, such as KNN, RBF-SVM, RF, and MLP algorithms.
An optimal model is selected based on accuracy and data processing time. Here this database is tested
for different models, such as different regression models and classification models.
     The database was split into 70:30 training:testing values for prediction, and based on their
respective higher fit score, minimum root-mean-square Error (RMSE), and processing time, the model
was selected. This prediction model was applied to the real-time scan values for robot localization.
The robot scanned for new values and registered the RSSI values only for the link quality that was
between 35 and 65. If the link quality were to degrade, the prediction model error would increase,
indicating the wrong robot position in the mapped area. For each position in mapping, the database
contains magnetic orientation values.
     At the time of optimal path generation, the path from one fixed position to the target position is
decided by connecting the nearest optimal points, as shown in Figure 4. The sampling points are in
black dots and the objects in different shapes and colors. The sample node is described in (column, row)
format. If the starting point was (0,5) and the target was (3,1) the optimal path was shown in red as the
number of points connected to nearby reaching points. At the time of sampling, the reaching points
are well registered. The starting point (0,5) was connected to point (0,4), (1,0), (1,4), (2,4), and (1,5).
The connecting path from (1,0) node is a black dotted line. The estimated path from source to the
destination was calculated by the algorithm and listed in Figure 4. The path which has minimal hoping
points will be declared as the optimal path. At the time of path following, the presence of a number of
nodes means that the system has to localize correctly after reaching the specific node. To minimize
time to reach the destination, the number of hoping points should be minimum.
Electronics 2020, 9, 1326 7 of 15
Figure 3. System flow graph.
The connecting points are stored in the database with the corresponding angle and distance.
Based on the starting point and the target point, the algorithm estimates all possible paths. As shown
in Figure 4, five paths were estimated from the starting point (0,5) to the target point (3,1). The algorithm
calculates the connecting point path that reaches to the target point. The minimal distance path is
considered optimal. The estimated path “a” which is marked in red, (0, 5) → (1, 0) → (3, 1), is the
shortest path among all possible estimated paths. At the time of path following, when the robot faces
the obstacles, the algorithm calculates a new optimal path for the same destination. The robot tries to
reach the destination, and in the interim period, the system is enabled to start capturing frames from
the on-board camera unit.
Figure 4. Path planning.Electronics 2020, 9, 1326 8 of 15
The system contains the database of the authorized person images. If new authorized target
coordinates are given, the robot follows the new target points and optimizes the path for a new target.
The facial and object detection and recognition process are shown in Figure 5. The facial detection and
recognition algorithm does not use the depth sensor data; rather, it works on two-dimensional images.
Figure 5. Face and object recognition.
An individual’s images are studied to detect the facial area using the Haar cascading method.
An individual frame captured by a Pi camera is synthesized by the processing unit and converted
into the 128-bit real value numbers. A pre-training model generated based on the Microsoft Common
object in the context dataset was used for object detection of a chair, table, bicycle, etc. This individual
image detection classifier was applied to the resultant image, as in Figure 5 output phase. If the person
was valid, then the speech recognition was enabled. This system takes input in the form of a for a
new target. If the system fails to detect and recognize the face, the target point can also be input
manually through a remote server. The system library function enables the microphone and registers
the input until there is a delivery stoppage for 2 s. The given input is converted into a string to remove
unnecessary background noise and the system finds only target inputs.
The hardware setup is shown in Figure 6 with the camera setup positioned at 1 m above the
ground level and embedded with the Raspberry Pi 3 module to capture an adequate vision area.
The MPU 6050 is an integrated accelerometer with the compass embedded with the processing module
to measure angle and displacement. The robotic action signal is sent to the H-Bridge driver module
based on the decision made by the navigation algorithm processed by the embedded system.Electronics 2020, 9, 1326 9 of 15
Figure 6. Hardware setup: (A) Placement of embedded unit on the robot (B) Camera module positioned
1m above the ground level.
3. Model Selection and Data Processing
The quality and RSSI value distribution of database is shown in Figure 7.
Figure 7. Link quality vs. RSSI value distribution for individual positions.
The values are not linearly distributed but change with the link quality. Position 2 shown in
orange in the graph has a different distribution concerning the changing environment with time. It is
hard to predict the exact location in a map without taking several samples over time and prediction
or classification models. The best performing classification models were studied, and a comparative
result for sampled data is shown in Figure 8.
The input samples were randomized and applied to the classification model. The inputs were
link quality and RSSI value, and positions were the output variables. The randomized data were
segregated into 70:30 training:testing datasets. In Figure 8, the solid red dots are the training data,
and light colored dots are the testing data. The red and blue regions are the boundary conditionsElectronics 2020, 9, 1326 10 of 15
to separates points. The classifier accuracy depends on the dataset distribution (shown in the first
column); if the datasets do not overlap, then the KNN, SVM, and NN have better accuracy compared
to the RF. For RSSI-based indoor navigation system, RSSI values depend on the surrounding medium
and the measured inputs overlapping. In this case, RF classification methods outperformed the KNN,
SVM, and NN, as shown in the second row.
Figure 8. Comparative study of different classification models.
The performance analysis of different classification models is shown in Tables 1 and 2.
Mean absolute error (MAE), mean square error (MSE), and root mean square error (RMSE) were
calculated for sampled and real-time scanned datasets. The RF classification method had lower
MAEDB , MSEDB , MAERT , MSERT , and RMSERT compared to other methods. We took the samples
in a grid formation, so the error between consecutive points of the identical distance was the same.
The error value cannot justify the position angle with respect to the target point. We denote the
location of the samples as a label for the classifier, and the errors calculated in Table 1 are the position
number errors.
Table 1. Error calculation of database and real-time scanned data.
Classification Method M AE DB MSE DB RMSE DB M AE RT MSE RT RMSE RT
K Nearest Neighbors 2.549 16.130 4.016 6.696 58.344 7.638
Random Forest 2.135 13.121 3.622 4.914 33.986 5.830
MLP Neural Network 2.313 12.919 3.594 4.466 37.341 6.111
RBF SVM 2.430 14.824 3.850 5.546 39.048 6.249
Table 2. Computational performances of classification methods.
Classification Classifier Database Real-Time
Method Execution Prediction Data Prediction
K Nearest Neighbors 298 ms 11.1 s 784 ms
Random Forest 274 ms 312 ms 300 ms
MLP Neural Network 3m6s 687 ms 595 ms
RBF SVM 36.6 s 5m3s 23.0 s
The computational performance is measured based on the classification execution computation
speed, and therefore, has a significant impact in a large sampled area. The RF classifier was
computationally the fastest for sampled and real-time scanned datasets. Based on the classificationElectronics 2020, 9, 1326 11 of 15
accuracy calculated for samples, the random forest classification method is accurate and fast compared
to other classifiers, and so can be used as a prediction model.
The optimum estimators require for the random forest-based classification algorithm to be
calculated to optimize the CPU processing. The number of estimators requires one to achieve lower
out-of-bag (OOB) error,Electronics 2020, 9, 1326 12 of 15
Figure 11. Actual vs. predicted values.
The robot predicted the position using the real-time scan data and prediction model. We marked
the best-predicted position vis-a-vis the other points as an estimated position. The robot then moved
to the nearby four points, centering the predicted position in the grid. If for a certain point, a precise
prediction was available as per the assumption made by a robot, then before moving, the robot
conformed to that point as an accurate estimation. The cumulative distribution of errors (in meters)
was determined. In an average-sense, the RF classification method gets its 90% position predictions
within the 3 m range. Additionally, the RF-based method gets a maximum error of 6 m for any positions.
The RF, KNN, RBF SVM, and MLP achieved 90% accuracy at 2.87, 3.7, 3.85, and 5 m, as shown by
vertical dotted lines in Figure 12.
Figure 12. Cumulative distribution function of the position error in grid.
The median accuracies for this study were 0.030, 0.045, 0.05, and 0.062 m respectively.
The threshold point to select the classification method was 3.2 m because the error should not go
beyond half of the region of interest area. The threshold point was decided based on the mapping areaElectronics 2020, 9, 1326 13 of 15
where the distance between two consecutive points was 1.6 m and was set equal to two grid points,
or 3.2 m from prediction point. For RF, RBF SVM, KNN, and MLP respectively, the accuracies of the
individual methods at threshold points were 91.7%, 86%, 84.3%, and 82.3%. The accuracy depends on
the sampling data and the real-time link quality. The object detection and recognition module and the
facial detection and recognition module work independently. Object detection results are in Figure 13
(Part: A). The robot tries to understand the surroundings and identifies the objects and registers their
position in the database. The robot detected the objects such as a chair, laptop, and person in the
detection area; as the prediction model was unexposed to the training data for the laboratory storage
cabinet, some such objects were unrecognizable.
Figure 13. Results of: (A) object detection and recognition (B) facial detection and recognition
algorithms.
A facial detection and recognition model output helps in acquiring inputs from authorized
persons. The detected person is recognized through a respective database name, whereas the person
who has no record in a database is deemed to be an unknown person shown in Figure 13 (Part: B).
The face orientation and lighting conditions may affect the detection process, and so the robot tries to
change its orientation for appropriate adjustment to the lighting conditions. In case of detection error,
the system can get the target point through manual inputs. The robotic system receives necessary
action for a change in target or to scan the area with the help of the proposed localization method.
This system is useful for surveillance without human interaction among the set-points.
The selection of classification methods depends on many parameters, such as data collection
methods, the filtering process, and consideration of the dynamic environment. The proposed robotic
navigation system algorithm has liberty to select a suitable classification method based on the dataset.
Among the classification methods used in comparative studies, the RF-based classification gave
relatively higher accuracy in a complex environment (90% at 3.2 m) without setting the activation
function, learning rate, hidden layer neurons, and thresholding process. Additionally, the processing
time for higher samples is lower compared to the other methods. Hence, the time needed for prediction
during position hopping is less which is a critical factor for localization of robot in real-time.
4. Conclusions
The RSSI-based robotic system navigates in a diverse indoor environment with the help of
available wireless data links. The RSSI values are changes as the object appears in between wireless
node and a receiver module. In this case, the data-link quality plays a crucial role in identifying
accurate mapping position. Dense area sampling with adequate sample points in diverse conditions
improves accuracy. The accuracy of the classification models depends on the data distribution and
training: testing ratio. It is necessary to calculate the classifier accuracy before fixing any model.
For sampled dataset, the random forest classification method provides a promising result with the least
MAE, MSE, and RMS error compare to other prediction models. Path optimization algorithm choosesElectronics 2020, 9, 1326 14 of 15
the lowest hoping node path as the shortest path. In the proposed method, the RF classification method
achieved a location accuracy which was 5.7%, 7.4%, and 9.4% higher than RBF SVM, KNN, and MLP
in a 3.2 m span. The designed robotic platform can be further modified into a transport laboratory
equipment from one room to another on the same floor. The system can sense the surroundings and
make immediate decisions using the proposed computer vision. In future, it is possible to deploy this
system on aerial vehicles inside buildings for surveillance purposes.
Author Contributions: Conceptualization, A.R., D.D.; Data acquisition and processing, J.U.; Results analysis,
A.R., D.D.; Writing – original draft, J.U., D.D., A.R.; Writing – review & editing, V.M., M.-L.U. All authors have
read and agreed to the published version of the manuscript.
Funding: This research received no external funding.
Conflicts of Interest: The authors declare no conflict of interest.
References
1. Sithole, G.; Zlatanova, S. Position, Location, Place and Area: An Indoor Perspective. ISPRS Ann. Photogramm.
Remote Sens. Spat. Inf. Sci. 2016, III-4, 89–96. [CrossRef]
2. Errington, A.F.C.; Daku, B.L.F.; Prugger, A.F. Initial Position Estimation Using RFID Tags: A Least-Squares
Approach. IEEE Trans. Instrum. Meas. 2010, 59, 2863–2869. [CrossRef]
3. Tesoriero, R.; Gallud, J.; Lozano, M.; Penichet, V.R. Tracking autonomous entities using rfid technology.
IEEE Trans. Consum. Electron. 2009, 55, 650–655. [CrossRef]
4. Saab, S.S.; Nakad, Z.S. A Standalone RFID Indoor Positioning System Using Passive Tags. IEEE Trans.
Ind. Electron. 2011, 58, 1961–1970. [CrossRef]
5. Park, J.; Kim, J.; Kang, S. A Situation-Aware Indoor Localization (SAIL) System Using a LF and RF Hybrid
Approach. Sensors 2018, 18, 3864. [CrossRef] [PubMed]
6. Huang, C.H.; Lee, L.H.; Ho, C.C.; Wu, L.L.; Lai, Z.H. Real-Time RFID Indoor Positioning System Based on
Kalman-Filter Drift Removal and Heron-Bilateration Location Estimation. IEEE Trans. Instrum. Meas. 2015,
64, 728–739. [CrossRef]
7. Yang, D.; Xu, B.; Rao, K.; Sheng, W. Passive Infrared (PIR)-Based Indoor Position Tracking for Smart Homes
Using Accessibility Maps and A-Star Algorithm. Sensors 2018, 18, 332. [CrossRef]
8. Wang, H.; Sen, S.; Elgohary, A.; Farid, M.; Youssef, M.; Choudhury, R.R. No need to war-drive. In Proceedings
of the 10th International Conference on Mobile Systems, Applications, and Services, Low Wood Bay,
Lake District, UK, 25–29 June 2012. [CrossRef]
9. Jovicic, A.; Li, J.; Richardson, T. Visible light communication: opportunities, challenges and the path to
market. IEEE Commun. Mag. 2013, 51, 26–32. [CrossRef]
10. Danakis, C.; Afgani, M.; Povey, G.; Underwood, I.; Haas, H. Using a CMOS camera sensor for visible
light communication. In Proceedings of the 2012 IEEE Globecom Workshops, Anaheim, CA, USA,
3–7 December 2012. [CrossRef]
11. Prajapati, U.; Rawat, A.; Deb, D. A Novel Approach Towards a Low Cost Peripheral Security System Based
on Specific Data Rates. Wirel. Pers. Commun. 2018, 99, 1625–1637. [CrossRef]
12. Prajapati, U.; Rawat, A.; Deb, D. Integrated Peripheral Security System for Different Areas Based on Exchange
of Specific Data Rates. Wirel. Pers. Commun. 2019, 111, 1355–1366. [CrossRef]
13. Cerar, G.; Mohorcic, M.; Gale, T.; Fortuna, C. Link Quality Estimation using Machine Learning. arXiv 2018,
arXiv:1812.08856.
14. Zhang, G.; Wang, P.; Chen, H.; Zhang, L. Wireless Indoor Localization Using Convolutional Neural Network
and Gaussian Process Regression. Sensors 2019, 19, 2508. [CrossRef] [PubMed]
15. Breiman, L. Random Forests. Mach. Learn. 2001, 45, 5–32. [CrossRef]
16. Naghdi, S.; O’Keefe, K. Detecting and Correcting for Human Obstacles in BLE Trilateration Using Artificial
Intelligence. Sensors 2020, 20, 1350. [CrossRef] [PubMed]
17. Liu, Z.; Dai, B.; Wan, X.; Li, X. Hybrid Wireless Fingerprint Indoor Localization Method Based on a
Convolutional Neural Network. Sensors 2019, 19, 4597. [CrossRef] [PubMed]
18. Wang, H.; Li, J.; Cui, W.; Lu, X.; Zhang, Z.; Sheng, C.; Liu, Q. Mobile Robot Indoor Positioning System Based
on K-ELM. J. Sens. 2019, 2019, 7547648. [CrossRef]Electronics 2020, 9, 1326 15 of 15
19. Potorti, F.; Crivello, A.; Barsocchi, P.; Palumbo, F. Evaluation of Indoor Localisation Systems: Comments on
the ISO/IEC 18305 Standard. In Proceedings of the 2018 International Conference on Indoor Positioning and
Indoor Navigation (IPIN), Nantes, France, 24–27 September 2018; pp. 1–7. [CrossRef]
20. Lymberopoulos, D.; Liu, J. The Microsoft Indoor Localization Competition: Experiences and Lessons
Learned. IEEE Signal Process. Magaz. 2017, 34, 125–140. [CrossRef]
21. Han, L.; Jiang, L.; Kong, Q.; Wang, J.; Zhang, A.; Song, S. Indoor Localization within Multi-Story Buildings
Using MAC and RSSI Fingerprint Vectors. Sensors 2019, 19, 2433. [CrossRef]
22. Yang, J.; Yan, M. Implementation of UWB indoor location and distance measurement based on TOF algorithm.
MATEC Web Conf. 2018, 173, 03018. [CrossRef]
23. Amit, Y.; Geman, D. Shape Quantization and Recognition with Randomized Trees. Neural Comput. 1997,
9, 1545–1588. [CrossRef]
24. Hastie, T.; Tibshirani, R.; Friedman, J. The Elements of Statistical Learning; Springer: New York, NY, USA, 2009.
[CrossRef]
25. Delfa, G.C.L.; Catania, V.; Monteleone, S.; Paz, J.F.D.; Bajo, J. Computer Vision Based Indoor Navigation:
A Visual Markers Evaluation. In Ambient Intelligence—Software and Applications; Springer: Berlin/Heidelberg,
Germany, 2015; pp. 165–173. [CrossRef]
26. Khoshelham, K.; Elberink, S.O. Accuracy and Resolution of Kinect Depth Data for Indoor Mapping
Applications. Sensors 2012, 12, 1437–1454. [CrossRef] [PubMed]
27. Redmon, J.; Divvala, S.; Girshick, R.; Farhadi, A. You Only Look Once: Unified, Real-Time Object Detection.
In Proceedings of the2016 IEEE Conference on Computer Vision and Pattern Recognition (CVPR), Las Vegas,
NV, USA, 27–30 June 2016; pp. 779–788. [CrossRef]
28. Upadhyay, J.; Deb, D.; Rawat, A. Design of Smart Door Closer System with Image Classification over WLAN.
Wirel. Pers. Commun. 2019, 111, 1941–1953. [CrossRef]
29. Othman, N.A.; Aydin, I. A new IoT combined body detection of people by using computer vision for security
application. In Proceedings of the 2017 9th International Conference on Computational Intelligence and
Communication Networks (CICN), Girne, Cyprus, 16–17 September 2017; pp. 108–112. [CrossRef]
30. Chen, Y.; Chen, Q.; Chou, K.; Wu, R. Low-cost face recognition system based on extended local binary
pattern. In Proceedings of the 2016 International Automatic Control Conference (CACS), Taichung, Taiwan,
9–11 November 2016; pp. 13–18. [CrossRef]
c 2020 by the authors. Licensee MDPI, Basel, Switzerland. This article is an open access
article distributed under the terms and conditions of the Creative Commons Attribution
(CC BY) license (http://creativecommons.org/licenses/by/4.0/).You can also read