Desktop Study of the Overlap between Harbor Porpoise Habitat and Regions of SURTASS LFA Sonar Use
←
→
Page content transcription
If your browser does not render page correctly, please read the page content below
Desktop Study of the Overlap between Harbor Porpoise
                Habitat and Regions of SURTASS LFA Sonar Use

                                        28 February 2019

                Marine Acoustics, Inc. in support of Chief of Naval Operations,
                                U.S. Navy, Washington, D.C.

Background
Surveillance Towed Array Sensor System Low Frequency Active (SURTASS LFA) sonar transmits at the
frequencies of 100 to 500 hertz (Hz). Harbor porpoises (Phocoena phocoena) have demonstrated
behavioral reactions that indicate they may be more sensitive to underwater sound than most cetacean
species, even at low frequencies where harbor porpoises have limited hearing sensitivity (Kastelein et
al., 2010, 2017; Tougaard et al. 2015). Research is ongoing to increase the understanding of the hearing
sensitivity of harbor porpoise to lower frequencies (e.g., Kastelein’s Navy Living Marine Resources
Project #20 is focusing on behavioral responses and temporary threshold shift [TTS] at 3 kiloHertz [kHz]).
However, reactions of harbor porpoises to sources such as pile driving, which produces broadband
sounds with energy predominantly at low frequencies, have raised concerns that harbor porpoises may
experience similar sensitivities to SURTASS LFA sonar transmissions (Tougaard et al., 2015).
To increase the understanding of how harbor porpoises and beaked whale species might respond
behaviorally and physiologically when exposed to SURTASS LFA sonar transmissions, the 2012 Marine
Mammal Protection Act (MMPA) rulemaking for SURTASS LFA sonar employment (NOAA, 2012) charged
the Navy with assessing different types of monitoring and research that might address this goal. The
Navy convened a Scientific Advisory Group (SAG) of recognized scientific subject matter experts to
identify feasible monitoring and/or research options the Navy could implement to assess the potential
for effects from SURTASS LFA sonar on beaked whales or harbor porpoises. Following the submittal of
the SAG report, the Navy twice convened the Executive Oversight Group (EOG), composed of Navy and
National Marine Fisheries Service (NMFS) personnel as well as a representative of the Marine Mammal
Commission. The purpose of the EOG was to provide the Navy with: 1) an independent, objective review
of the SAG’s findings, 2) guidance and prioritization of research topics, and 3) final recommendations to
the Navy and NMFS on research efforts to ascertain effects of exposure to SURTASS LFA sonar
specifically addressing beaked whale species and harbor porpoises.
One of the first efforts the EOG recommended was to bound the problem of harbor porpoise exposure
to SURTASS LFA sonar transmissions. Since the harbor porpoise is primarily a coastal species and
SURTASS LFA sonar does not principally operate in coastal waters, a desktop study could investigate the
potential spatial overlap of harbor porpoise habitat with SURTASS LFA sonar use. The objective of this

                                                                                                         1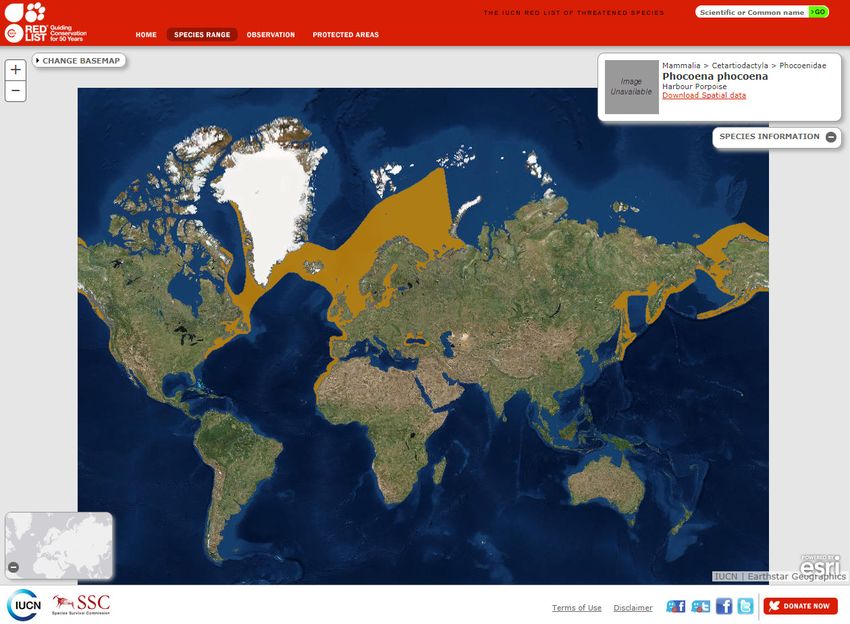
desktop study was to determine the extent to which harbor porpoises may be exposed to SURTASS LFA
sonar transmissions, primarily focusing on exposures that may elicit behavioral responses. This
information will help guide decision makers in determining research priorities that further the
understanding of the potential impacts of SURTASS LFA sonar use on marine mammals.

Introduction
The harbor porpoise is a coastal species that inhabits temperate and boreal waters of the northern
hemisphere. Females are typically larger than males, with females averaging 1.5 meters (m) (4.9 feet
[ft]) in length and weighing 75 kilograms (kg) (165 pounds [lb]). Males, on average, reach 1.45 m (4.7 ft)
in length and weigh 60 kg (132 lb) (Bjorge & Tolley, 2018). Significant predators of harbor porpoises
include killer whales (Orcinus orca) and great white sharks (Carcharodon carcharias), in addition to
documented attacks from common bottlenose dolphins (Tursiops truncatus) (Jacobson et al., 2015) and
grey seals (Halichoerus grypus) (Leopold et al., 2015).
Because of their coastal distribution, harbor porpoises may be exposed to a variety of anthropogenic
activities, including shipping, construction, chemical pollution, and fisheries bycatch. The main
anthropogenic threat to harbor porpoises is entanglement in fixed fishing gear, particularly gillnets.
Several thousand individuals die each year by drowning once they become entangled at depth and
cannot reach the surface to breathe (Read, 2013). It is not clear why harbor porpoises become
entangled since research has shown they are able to detect the nets with their echolocation signals
(Villadsgaard et al., 2007). However, the use of pingers on gillnets as acoustic deterrent devices has
proven highly effective, reducing the bycatch rate in nets with pingers by 92% compared to nets without
pingers (Palka et al., 2008).
While acoustic pingers have caused behavioral reactions that have reduced bycatch deaths, there is
ongoing concern that harbor porpoises react to underwater sound at received levels much lower than
expected given their hearing sensitivity. Kastelein et al. (2010; 2017) measured the hearing of harbor
porpoises and found the range of best hearing to be 8 to 150 kHz, with maximum sensitivity occurring at
125 kHz. Sensitivity decreased approximately 10 decibels (dB) per octave below 16 kHz, with hearing
thresholds of 94 dB at 500 Hz with a signal duration of 1700 milliseconds (ms) and 111 dB at 250 Hz with
a signal duration of 2500 ms; these were the lowest thresholds across a variety of signal durations (Table
1, Kastelein et al., 2010). Comparing these hearing data to other odontocetes, harbor porpoises have
been classified as high-frequency hearing cetaceans (NMFS, 2018). Therefore, although a decreased
sensitivity to lower frequency sounds is anticipated from these hearing data, documented behavioral
reactions of harbor porpoises to pile driving, which has peak energy at lower frequencies (
of 133-145 dB re 1 µPa @ 1 m. The authors documented decreased echolocation rates of 50% to 100%
at ranges of up to 500 m (1,640 ft) and reduced sighting rates of harbor porpoises at ranges of up to 300
m (984 ft) around the gillnets.
Acoustic harassment devices (“seal scarers”) transmit very short (approximately 2 millisecond [ms])
pulses at around 10 to 14 kHz. Brandt et al. (2013) documented reactions of harbor porpoises to seal
scarers at distances of up to 7.5 kilometers (km) (4.0 nautical miles [nmi]) and received levels of 113 dB
re 1 µPa root-mean-square (rms) (integration time of 125 ms) at 14 kHz.
Reactions to pile driving have been documented at distances beyond 21 km (11.3 nmi) where received
levels were approximately 175 dB peak, equating to estimated received levels of 130 dB re 1 µPa rms
(integrated over a signal duration of 0.2 s) (Tougaard et al., 2009). These pile-driving signals had peak
energy at 160 Hz, but significant energy also occurred up to 100 kHz, which was the upper frequency
limit of the recording equipment. In addition to having energy at higher frequencies, pile driving also
produces impulsive sounds with both a rapid onset and a short rise time to peak pressure values. LFA
sonar is not impulsive but consists of narrowband tonal signals that resemble some of the sounds
produced by certain LF whales, such as humpback and right whales. Therefore, an LFA sonar sound
presents a fundamentally different context compared to impulsive anthropogenic sound sources like
pile driving. LFA sonar signals sound like the communication sounds produced by LF whales and are not
the kind of sounds that would be expected to, or that have been observed to, evoke behavioral
responses in MF or HF animals.

Given the behavioral reactions of harbor porpoises to these different sound sources, Tougaard et al.
(2015) used harbor porpoises as a case study to suggest a new paradigm for defining acoustic exposure
criteria. The authors suggested that source level, peak frequency, pulse duration, and pulse repetition
rate were influencing factors that resulted in avoidance distances by harbor porpoises of approximately
20 km (10.8 nmi) for LF pile driving, between 1 and 7.5 km (0.54 and 4.0 nmi) for mid-frequency seal
scarers, and 200 m (656 ft) for high-frequency pingers. Tougaard et al. (2015) related these avoidance
distances to an exposure limit of 45 dB above the hearing threshold at a given frequency (also referred
to as the sensation level), which also included consideration of the temporal integration time (125 ms)
for signals of varying durations. At the frequencies of LFA sonar, this would suggest that avoidance
behaviors would occur at received levels of 139 dB rms at 500 Hz (94 dB + 45 dB) and 156 dB rms at 250
Hz (111 dB + 45 dB) (Kastelein et al., 2010).
To provide another, even more protective perspective, NMFS has defined a threshold of 120 dB rms as
the sound pressure received level for potential behavioral responses for non-impulsive (typically
continuous) sources. This threshold is used by the U.S. Navy in its Phase III Acoustic Effects Analysis
(DoN, 2017a) with a cutoff distance of 20 km (10.8 nmi) for moderate source level (less than 215 dB re 1
μPa @ 1 m), single platform training and testing events and 40 km (21.6 nmi) from all other events with
multiple platforms or sonar with source levels at or exceeding 215 dB re 1 μPa @ 1 m (SURTASS LFA
sonar would fall into the latter category). A response threshold of 120 dB rms would correspond to
sensation levels of 26 dB (120 dB – 94 dB) and 9 dB (120 dB – 111 dB) at 500 Hz and 250 Hz, respectively,
for harbor porpoises (Kastelein et al., 2010).

                                                                                                             3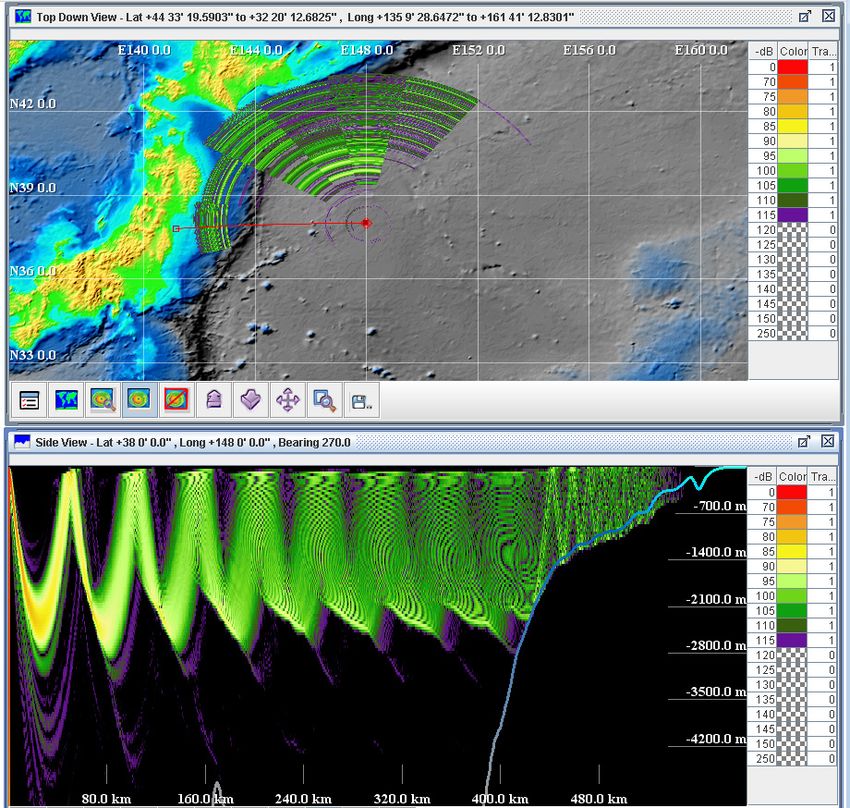
Spatial Extent of SURTASS LFA Sonar Use
Under the 2012 MMPA Final Rule for SURTASS LFA sonar employment (NOAA, 2012), the geographic
extent of potential SURTASS LFA sonar use was global. SURTASS LFA sonar could have been deployed in
the Pacific, Atlantic, and Indian oceans, and the Mediterranean Sea, except for polar regions (Figure 1).
On an annual basis, the Navy determined the regions in which the use of SURTASS LFA sonar may be
necessary and requested appropriate permitting under the MMPA and Endangered Species Act (ESA) in
accordance with the existing five-year rule and biological opinion, respectively. Over the past fifteen
years, SURTASS LFA sonar use has been authorized primarily in the western and central North Pacific
Ocean.
Prior to the expiration of the 2012 Final Rule, on August 10, 2017, in consultation with the Secretary of
Commerce and pursuant to Title 16, Section 1371(f) U.S.C., the Secretary of Defense determined that it
was necessary for national defense to exempt all military readiness activities that use SURTASS LFA
sonar from compliance with the requirements of the MMPA for two years from August 13, 2017 through
August 12, 2019, or until such time when NMFS issues the required regulations and a LOA under Title 16,
Section 1371, whichever is earlier. Under the National Defense Exemption (NDE) for SURTASS LFA sonar,
the Navy is approved to use SURTASS LFA sonar in the western and central North Pacific and eastern
Indian oceans (Figure 2). Fifteen representative model areas in the western and central North Pacific
and eastern Indian oceans were selected for analysis to represent the acoustic regimes and marine

    Arctic Ocean                                                                                      Arctic Ocean

                                                                                            Asia
                                                   Mediterranean Sea   Europe
                         North America

                                         Atlantic Ocean
                                                                                                         Pacific Ocean
                                                                        Africa
         Pacific Ocean
                                          South
                                         America                                 Indian Ocean
                                                                                                   Australia
                                                     Atlantic Ocean

          Southern Ocean

          Figure 1. Potential areas of SURTASS LFA sonar transmissions until August 2017.

                                                                                                                         4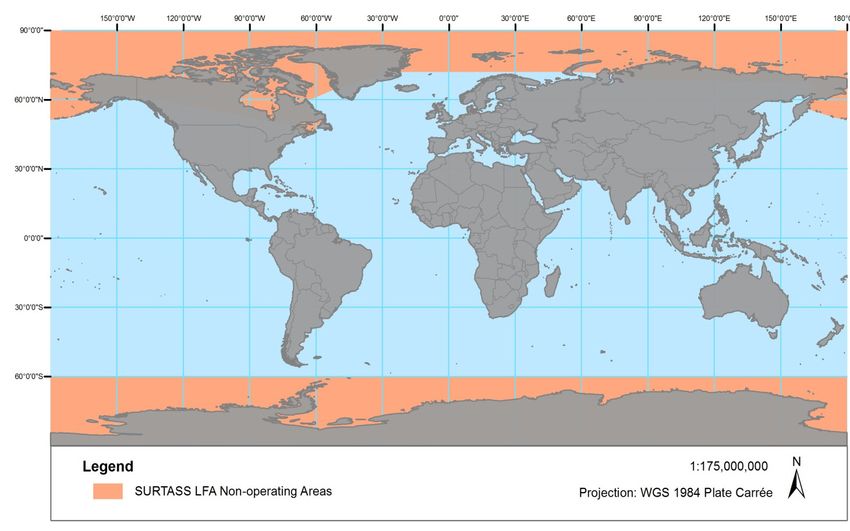
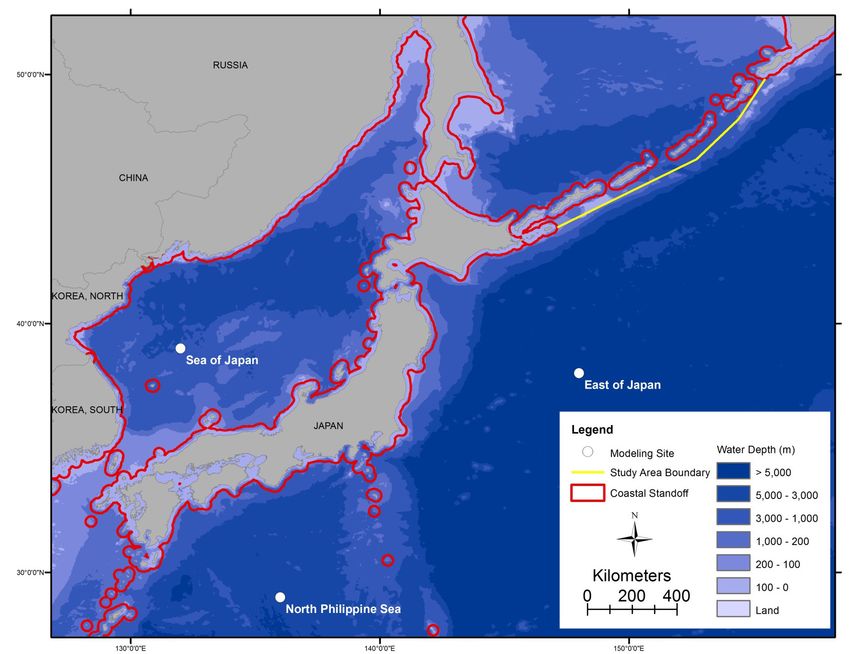
Figure 2. Current study area in the western and central North Pacific and eastern Indian
                      oceans, including representative modeling sites.

mammal species that may be encountered during LFA sonar training and testing activities. Harbor
porpoises may occur in only two of the fifteen areas in which SURTASS LFA sonar may be used, the East
of Japan and Sea of Japan regions. Harbor porpoises are not expected in the Northeast of Japan Model
Site because of the offshore nature and deep water depths of the region.
To reduce potential adverse effects of SURTASS LFA sonar transmissions on the marine environment, a
suite of mitigation measures are employed during sonar use. Those relevant to sound exposure in
harbor porpoise habitat include geographic restrictions to prevent (1) received sound pressure levels
(SPL) greater than 180 dB rms within 22 km (12 nmi ) from any emergent land, including islands, called
the coastal standoff range, and (2) received SPL greater than 145 dB rms at known recreational and
commercial dive sites. In addition, SURTASS LFA sonar training and testing activities would not be
conducted within the territorial seas of foreign nations. Given these geographic restrictions, SURTASS
LFA sonar use occurs primarily in more offshore waters, resulting in a spatial configuration that reduces
the potential exposures of harbor porpoise to LFA sonar transmissions.

                                                                                                            5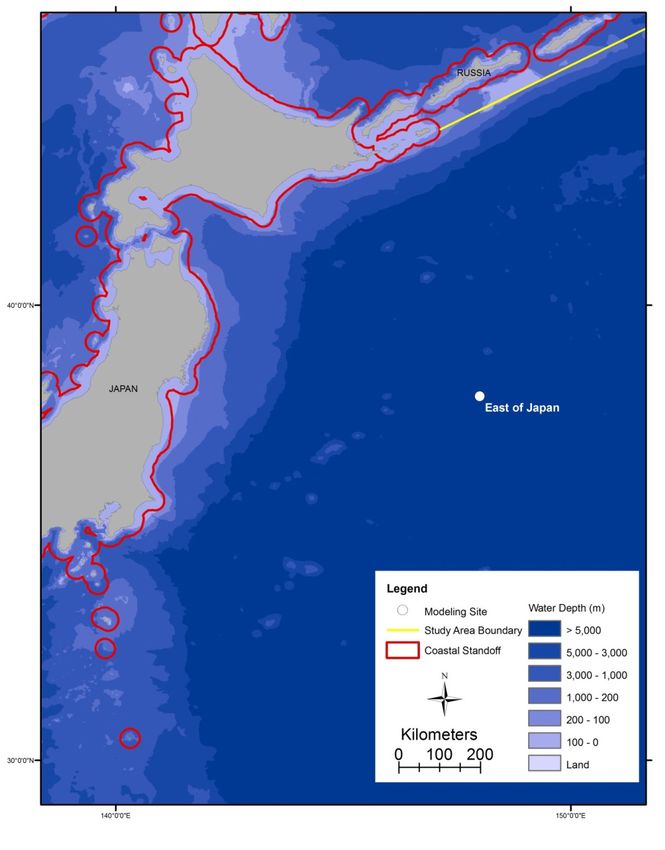
Harbor Porpoise Habitat
In general, the habitat of harbor porpoises is primarily coastal, cooler waters of the North Atlantic and
North Pacific oceans. The IUCN Red List of Threatened Species prepares envelope models of expected
species ranges that reflect documented observations of distribution (“realized niche”) as well as a
general understanding of habitat (“fundamental niche”). The IUCN has estimated that harbor porpoises
are primarily limited to continental shelf waters, though they may occasionally travel through deeper,
offshore waters, such as the Labrador Sea, the North Sea, and off the coast of Norway (Figure 3;
Hammond et al., 2017). Similar distribution patterns are seen off the U.S. east coast where habitat-
based models of density predict seasonally some individuals in the middle of the Gulf of Maine, but
higher densities are expected along the coast (Figure 4; Roberts et al., 2016).

Figure 3. Fundamental niche of harbor porpoise, as defined by the IUCN Red List, shown in tan
                              shading (Hammond et al., 2017).

                                                                                                            6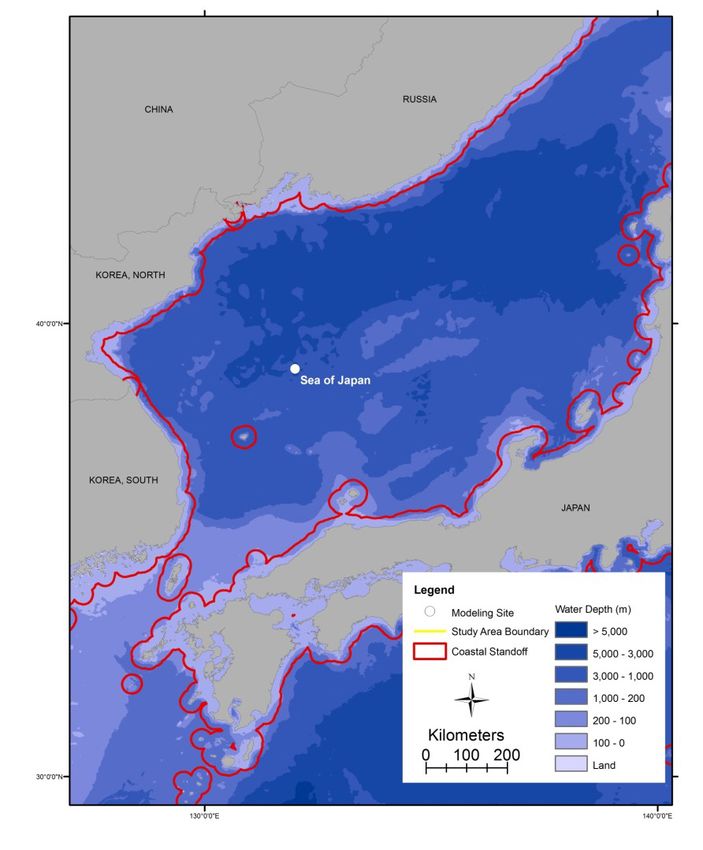
Figure 4. Density models for winter (left) and summer (right) for harbor porpoise off the U.S.
                  east coast, including location of sightings (Roberts et al., 2016).

A review of existing scientific literature on the spatial distribution of harbor porpoise sightings and
studies on the habitat preferences of harbor porpoises was conducted to determine common, salient
features associated with harbor porpoise habitat. Studies have found it difficult to identify common
features of harbor porpoise habitat because both the environments in which harbor porpoises are
observed, as well as their response to environmental features, appear to vary at different
spatiotemporal scales (Elliser et al., 2017; Isojunno et al., 2012). Elliser et al. (2017) suggest that with
metabolic rates that are two to three times higher than terrestrial mammals of similar body size, harbor
porpoises are only able to store a limited amount of energy, requiring them to feed on a fairly consistent
basis (as often as once every three days). Therefore, while their diet is typically dominated by two to
four main prey species (Isojunno et al., 2012), they feed opportunistically on a wide variety of prey. For
example, Heide-Jorgensen et al. (2011) found that harbor porpoise diet increased from 11 major prey
items in 1995 to 23 prey items in 2009. Similarly, studies in the North Sea found a significant shift in
distribution of harbor porpoises between 1994 and 2005, which they suggest was caused by a change in
the distribution and/or availability of prey (Hammond et al., 2013).
To meet their energetic requirements, harbor porpoises tend to be most closely linked to physical
forcing mechanisms that result in consistent, successful foraging opportunities. The three physical
habitat features that have most consistently been correlated with harbor porpoise distribution are (1)

                                                                                                          7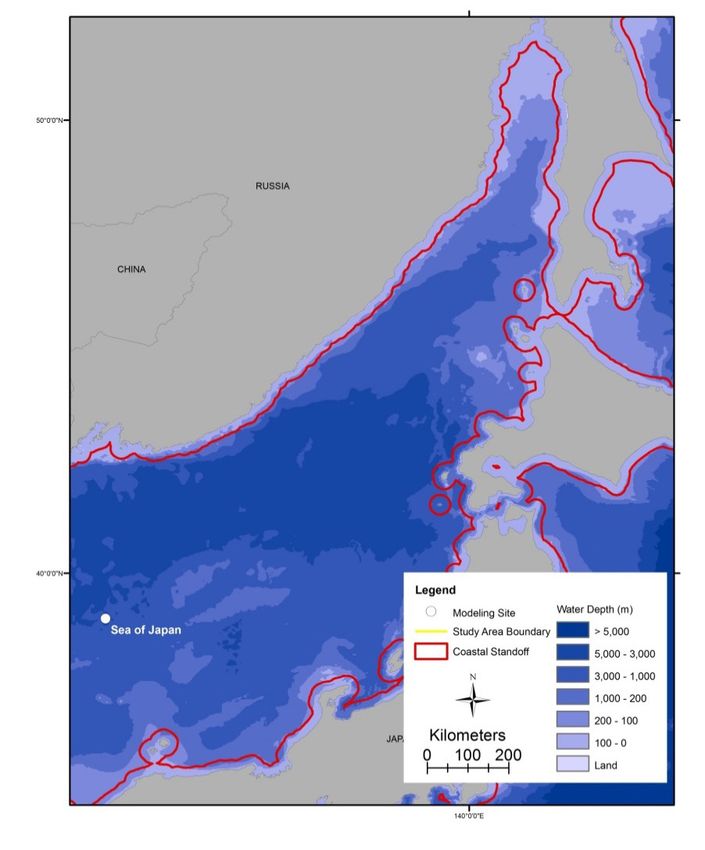
hydrographic features, (2) distance offshore, and (3) water depth. Embling et al. (2010) developed
spatial models with three years of survey data around the Inner Hebrides to predict high-use areas that
might be designated as marine protected areas for harbor porpoises. Using both static physical features
and persistent hydrographic features, Embling et al. (2010) found that maximum tidal current was the
most significant variable explaining the relative abundance of harbor porpoise across the three years,
such that high porpoise density correlated with high maximum tidal currents. Similarly, Johnston et al.
(2005) found that harbor porpoises in the Bay of Fundy concentrated their movements around islands,
headlands, or restricted channels with persistent hydrographic features that were shown to aggregate
prey.
Distance offshore has been shown to correlate with harbor porpoise distribution off the U.S. west and
east coasts and in the North Sea. A habitat-based model of harbor porpoise density off central California
found that sea surface temperature (SST) and water depth were the most commonly selected predictor
variables (Forney et al., 2015). In the North Atlantic Ocean, Read & Westgate (1997) tracked individual
harbor porpoises using satellite telemetry in the Bay of Fundy and Gulf of Maine for 2 to 212 days. The
authors found a high degree of individual variation in movement patterns, with the mean distances
offshore ranging from 6.6 to 27.3 km (3.6 to 14.7 nmi), except for one animal with a maximum range
offshore of 81.4 ± 26.1 km(44.0 ± 14.1 nmi). Read and Westgate (1997) also found that harbor porpoises
were most frequently sighted in depths of 92 to 183 m (302 to 600 ft) (55% of the time), with only 12%
of sightings at depths greater than 183 m (600 ft). Finally, Gilles et al. (2011) developed a model for the
German Bight that included distance offshore (81.4 ± 71.0 km, median 65.6 km [44.0 ± 38.3 nmi, median
35.4 nmi]) and water depth (29.3 ± 13.6 m, median 33.0 m [96.1 ± 44.6 ft, median 108.3 ft]), while
models of density in the central and southern North Sea included either distance offshore or water
depth or both, with the highest density occurring at a distance offshore of 150 km (81 nmi) and in water
depths between 20 and 40 m (66 and 131 ft) (Gilles et al., 2016).
Looking closer at studies of the water depths in which harbor porpoises have been observed, Mannocci
et al. (2017) developed habitat-based models to extrapolate U.S. east coast densities to other areas. The
authors found that a model with predicted zooplankton biomass and water depth most accurately
predicted harbor porpoise density. Off northern California, harbor porpoises were found most often in
depths between 20 and 60 m (66 and 197 ft), with few sightings at depths greater than 60 m (197 ft)
(Carretta et al., 2001). Synthesizing several harbor porpoise habitat studies, Isojunno et al. (2012) found
that water depth was the single most dominant determining factor, as harbor porpoises were rarely
found at depths less than 20 m (66 ft) or greater than 100 m (328 ft).

                                                                                                          8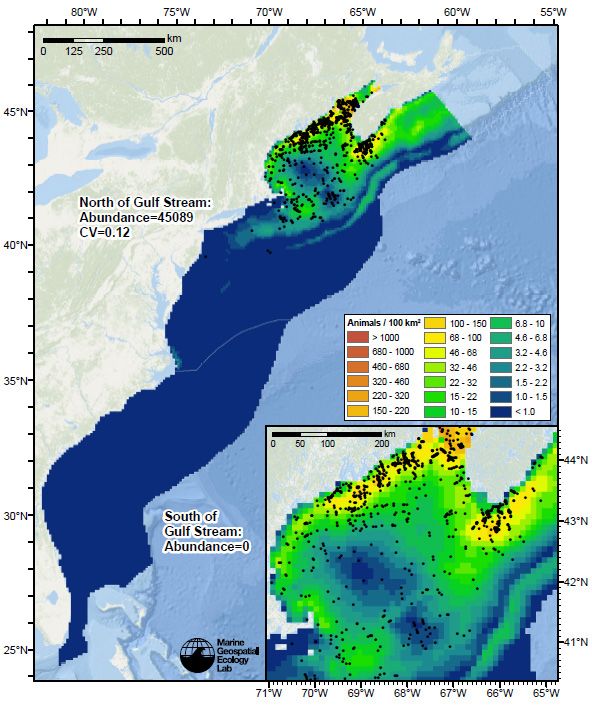
Overlap of Harbor Porpoise Habitat with SURTASS LFA Sonar Use
As stated above, several factors will influence the potential exposure of harbor porpoises to SURTASS
LFA sonar transmissions. First, the Navy implements the coastal standoff mitigation measure whenever
SURTASS LFA sonar is transmitting such that received levels will not exceed 180 dB rms within 22 km (12
nmi) of any emergent land, including islands, and SURTASS LFA sonar training and testing activities
would not be conducted within the territorial seas of foreign nations. Second, although harbor porpoise
habitat is difficult to define, animals are not typically found in water depths greater than 100 m (328 ft)
(Isojunno et al., 2012) or at distances offshore greater than 150 km (81 nmi) (Gilles et al., 2016), values
which are at the outer limits of the where harbor porpoises have been observed. Third, of the fifteen
representative modeling areas in which SURTASS LFA sonar may be used, harbor porpoises are only
expected to occur in two of those regions.
These factors have been used to focus the analysis of the potential overlap of harbor porpoise habitat
with SURTASS LFA sonar use in the western North Pacific, particularly to the two modeling areas of East
of Japan and the Sea of Japan regions (Figure 5). Finer scale views around the Sea of Japan (Figure 6) and
East of Japan (Figure 7) model sites show that the 100-m (328-ft) depth contour (the lightest blue
coloration) around Japan is closely aligned with the coastal standoff range (22 km [12 nmi ]) where
SURTASS LFA sonar is operated so that received levels are at or below 180 dB rms. Therefore, if SURTASS
LFA sonar were to be used in either of these two model sites, by implementing the coastal standoff
range mitigation measure, it is unlikely that harbor porpoises would be exposed to SURTASS LFA sonar
received levels greater than 180 dB rms.

                                                                                                          9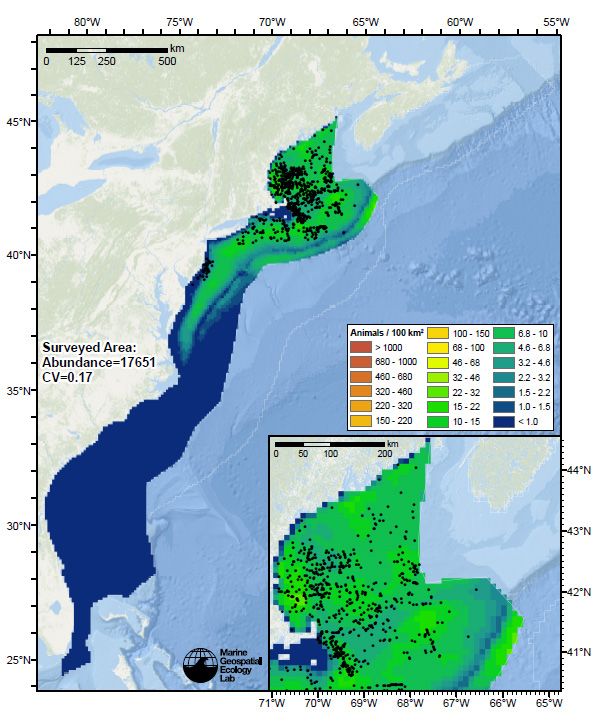
Figure 5. Coastal standoff range relative to water depth in the western North Pacific.

                                                                                         10
Figure 6. (Left) Coastal standoff range relative to water depth for the northern half of the Sea of Japan Model Site. (Right) Coastal
standoff range relative to water depth for the southern half of the Sea of Japan Model Site.
11Figure 7. Coastal standoff range relative to water depth for the East of Japan Model Site.
12Furthermore, received levels within the coastal standoff range are typically much lower than 180 dB rms
because SURTASS LFA sonar is designed for long-range submarine detection and surveillance. The
representative modeling sites in the East of Japan and Sea of Japan regions demonstrate the deeper,
more offshore environments in which SURTASS LFA sonar is typically used. LFA sonar is designed to take
advantage of convergence zone propagation conditions, which require deep water environments, as
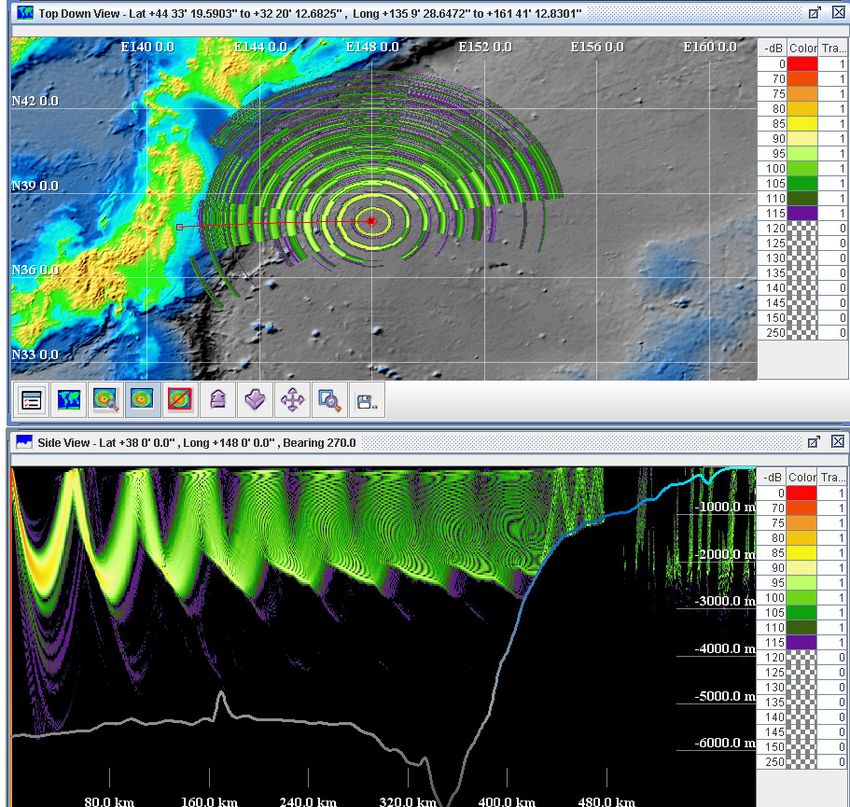
demonstrated in the following sound field figures for the East of Japan Model Site (Figures 8 and 9). The
sound field figures show received levels (RL, in dB rms), with a color bar, where red represents higher
received levels decreasing down to purple representing a RL of 120 dB rms; RLs less than 120 dB are not
plotted. In the side view figure (the bottom panel of Figures 8 and 9), the LFA sound source is located in
the upper left corner of the figure and the sound field is a vertical slice along the radial (in the direction)
of the red line in the top down view. The side view shows the distribution of sound energy throughout
the water column. LFA sonar transmissions are refracted (bent) towards the depth of the slowest sound
speed (approximately 200 m [656 ft] and 500 m [1,640 ft] at the Sea of Japan and East of Japan Model
Sites, respectively). This propagation (sound movement) results in regions called “shadow zones” where
almost no sound energy occurs, followed by “convergence zones” where the sound energy refracts back
into focal spots near the sea surface before being reflected back to deep depths. The top down view
(the top panel of Figures 8 and 9) shows the sound field at a specific water depth (a horizontal slice of
the water column at depths of 120 m [394 ft] and 10 m [33 ft], respectively), with the LFA sonar source
located at the red circle and concentric circles of sound energy corresponding to the convergence zone
propagation pattern that an animal would experience if it dove to that water depth.
Looking at the coastal standoff range (12 nmi [22 km]) within these sound field figures, little acoustic
energy is able to propagate into the nearshore environment. As the LFA sonar transmissions propagate
towards land, the sound signals interact with the seafloor, which shallows to form the continental slope
and then continental shelf. In these shallower water depths, the convergence zone structure converts to
bottom-bounce propagation in which the acoustic energy reflects off the seafloor and sea surface, with
sound signals rapidly losing energy and resulting in reduced received levels. Even if the LFA sonar source
was located closer to land than is shown in the East of Japan Model Site, the LFA sonar transmissions
would still rapidly lose energy with bounce-bounce propagation, restricting the amount of acoustic
energy that would propagate into continental shelf waters.
The western North Pacific is not a region in which harbor porpoises are expected to occur in water
depths greater than 100 m (328 ft) (Hammond et al., 2017; Figure 3). However, even if harbor porpoises
did wander into deeper water depths, it is important to consider their diving and movement behavior in
determining their potential exposure to SURTASS LFA sonar. Harbor porpoises are relatively shallow
divers, spending the majority of their time at depths of less than 40 m (131 ft). To model their exposure
to SURTASS LFA sonar transmissions, a synthesis of literature on harbor porpoise diving behavior
estimates that they spend about 35% of the time at water depths of 0 to 10 m (0 to 33 ft), about 45% of
the time at intermediate depths of 10 to 40 m (33 to 131 ft), about 15% of the time at depths of 40 to
100 m (131 to 328 ft), and about 5% of the time at depths of 100 to 230 m (328 to 754 ft) (DoN, 2018).
13RL
235
165
160
155
150
145
140
135
130
125
120
RL
235
165
160
155
150
145
140
135
130
125
120
Figure 8. Representative model output: top down view of received levels at a depth of 120 m (394 ft) (top panel) and side view along
the due west radial (bottom panel) for the East of Japan Model Site. Color bar indicates received levels greater than 120 dB rms.
14RL
235
165
160
155
150
145
140
135
130
125
120
RL
235
165
160
155
150
145
140
135
130
125
120
Figure 9. Representative model output: top down view of received levels at a depth of 10 m (33 ft) (top panel) and side view along the
due west radial (bottom panel) for the East of Japan Model Site. Color bar indicates received levels greater than 120 dB rms.
15With the center of the LFA sound source (an array of up to 18 elements) at a depth of 120 m (394 ft) and
the sound speed minimum below the source depth, the upper 40 m (131 ft) of the water column receive
reduced amounts of acoustic energy, as can be seen when comparing the top down views of Figure 8
(received levels at a water depth of 120 m [394 ft]) and Figure 9 (received levels at 10 m [33 ft]). During
convergence zone propagation, the reflection of sound energy occurs near the sea surface, but only in
water depths greater than 10 m (33 ft). It isn’t until the convergence zones begin to break down that
sound energy is able to reach the sea surface, at which point received levels are at or below
approximately 140 dB rms (green colors in Figures 8 and 9).
Similar propagation conditions are seen at the Sea of Japan Model Site (Figure 10). Convergence zone
propagation continues until the LFA sonar transmissions interact with the seafloor, which in this
instance is a seamount. Bottom-bounce propagation occurs over the seamount, bringing acoustic energy
into the shallowest depths of the water column, where reflection off the sea surface occurs. At distances
beyond the seamount, propagation returns to a convergence zone pattern, with limited energy reaching
the shallowest depths of the water column. Similar to the East of Japan Model Site, once bottom-
bounce propagation occurs in shallow waters, significant acoustic energy is lost and received levels are
at or below approximately 140 dB rms (green colors). Therefore, there is limited potential for harbor
porpoises to be exposed to LFA sonar transmissions if they are located in continental shelf waters or if
they are traveling through deeper water depths.
Summary
In conclusion, harbor porpoises have demonstrated behavioral reactions that indicate they may be more
sensitive to underwater sound than most cetacean species. To determine the extent to which harbor
porpoises may be exposed to SURTASS LFA sonar transmissions, the spatial extent of SURTASS LFA sonar
use was compared to harbor porpoise habitat. SURTASS LFA sonar use overlaps with harbor porpoise
habitat in only two of the fifteen representative modeling areas in which LFA sonar transmissions may
occur. Furthermore, SURTASS LFA sonar is designed for long-range submarine detection and surveillance
and is often used in deeper, more offshore environments where convergence zone propagation occurs.
While it is difficult to identify defining characteristics of harbor porpoise habitat, the three most
common features are persistent hydrographic features that consistently concentrate prey, distance from
shore less than 150 km (81 nmi) (typically much less in regions with deeper water depths), and water
depths of less than 100 m (328 ft). Therefore, there is little direct overlap between regions where
SURTASS LFA sonar may be used and where harbor porpoises are expected to occur.
Because SURTASS LFA sonar is designed for deeper water environments, limited acoustic energy from
LFA sonar transmissions reaches the nearshore regions in which harbor porpoises are expected,
resulting in a very low potential for harbor porpoises to be exposed to SURTASS LFA sonar transmissions.
Examining representative sound fields at SURTASS LFA sonar model sites (Figures 8, 9, and 10), the
potential for received levels greater than 140 dB rms in nearshore harbor porpoise habitats is quite low.
In addition, there is limited potential for harbor porpoises to be exposed if they travel from continental
shelf or slope waters into deeper waters because the convergence zone propagation results in limited
energy reaching the sea surface.
16RL
235
165
160
155
150
145
140
135
130
125
120
RL
235
165
160
155
150
145
140
135
130
125
120
Figure 10. Representative model output: top down view of received levels at a depth of 120 m (394 ft) (top panel) and side view along
the due east radial (bottom panel) for the Sea of Japan Model Site. Color bar indicates received levels greater than 120 dB rms.
17While received levels of 140 dB rms are above the NMFS threshold and Navy Phase II criteria of 120 dB
rms for potential behavioral responses, received levels of 140 dB rms are similar to the thresholds
defined by Tougaard et al. (2015) at which avoidance behaviors might be expected for SURTASS LFA
sonar (received levels of 139 dB rms at 500 Hz and 156 dB rms at 250 Hz). It is relevant to consider the
results from the Low Frequency Sound Scientific Research Program (LFS SRP), which exposed baleen
whales (LF hearing specialists) to SURTASS LFA sonar at received levels ranging from 120 to about 155
dB re 1 μPa (rms) (SPL). The LFS SRP provided important results on, and insights into, the types of
responses of baleen whales to LFA sonar signals and how those responses scaled relative to received
level and context. The results of the LFS SRP were used to derive the LFA risk continuum function, which
defines the potential for biologically significant behavioral responses to SURTASS LFA sonar (Figure 11).
The LFS SRP experiments detected only minor, short-term behavioral responses by baleen whales.
Short-term behavioral responses do not necessarily constitute significant changes in biologically
important behaviors. The fact that none of the LFS SRP observations revealed a significant change in a
biologically important behavior helped determine an upper bound for risk. However, the LFS SRP results
cannot be used to prove that there is zero risk at these levels. Accordingly, the risk continuum assumes
that risk is small, but not zero, at the received levels achieved during the LFS SRP. The basement value
below which risk is negligible is 120 dB SPE (single ping equivalent [SPE] is a unit defined for SURTASS
LFA sonar; the reader is referred to DoN, 2018 for more details). Fifty percent risk of a behavioral
response is defined at 165 dB SPE. The potential risk of a behavioral response at 140 dB SPE is 0.01
percent. Therefore, even if the very unlikely scenario occurred where a harbor porpoise was exposed to
SURTASS LFA sonar, harbor porpoises would most likely be exposed at received levels with a very limited
potential risk for a behavioral response.
Furthermore, as mentioned above, the context of exposure is also critical in predicting whether a
behavioral response might occur. DoN (2017a) predicted that harbor porpoises would not experience
potentially significant behavioral responses at ranges of greater than 40 km (21.6 nmi) from sonars such
as SURTASS LFA sonar. Looking at the sound field figures from the East of Japan and Sea of Japan
modeling sites (Figures 8, 9, and 10), received levels at certain depths within the water column are
greater than 140 dB rms within 40 km (21.6 nmi) of the SURTASS LFA sonar vessel. However, based on
the distance cutoff threshold, even though received levels are greater than 140 dB rms, harbor
porpoises are not expected to exhibit significant behavioral responses because of the distance of the
vessel from the animals.
Therefore, in summary, while harbor porpoises could potentially be exposed to SURTASS LFA sonar
transmissions, exposure is likely to occur at reduced received sound levels with limited potential for
behavioral responses and no potential for exposures that would induce injury. Given the very unlikely
scenario that harbor porpoises might be exposed to SURTASS LFA sonar, additional studies focusing on
harbor porpoises are not a high research priority for the Navy. As per the Navy’s Beaked Whale and
Harbor Porpoise Monitoring and Reporting Requirements Report (DoN, 2017b), this desktop study was a
first effort to determine whether research should focus on beaked whales or harbor porpoises, when
considering research priorities of just these two species groups. Within the context of that report, a next
step to further understanding the potential impacts of SURTASS LFA sonar on beaked whales would be a
study of the spatiotemporal overlap of high-frequency acoustic recording package (HARP) deployments
18in the North Pacific with LFA sonar operations (DoN, 2017b). While this desktop analysis indicated that
harbor porpoises have lower priority for investment than beaked whales, the overarching priority of all
SURTASS related research efforts remains improving our understanding of the impacts of LF sonars to
the most LF sensitive species (i.e., mysticetes).
Figure 11. Risk continuum function for SURTASS LFA sonar analysis that relates
the risk of significant change in biologically important behavior to received
levels in decibels single ping equivalent (SPE).
19Literature Cited
Bjorge, A., & Tolley, K. A. (2018). Harbor porpoise (Phocoena phocoena). In B. Wursig, J. G. M. Thewissen
& K. M. Kovacs (Eds.), Encyclopedia of Marine Mammals, Third Edition (pp. 448-451). New York:
Academic Press, Elsevier.
Brandt, M. J., Diederichs, A., Betke, K., & Nehls, G. (2011). Responses of harbour porpoises to pile driving
at the Horns Rev II offshore wind farm in the Danish North Sea. Marine Ecology Progress Series,
421, 205-216. doi: 10.3354/meps08888
Brandt, M. J., Höschle, C., Diederichs, A., Betke, K., Matuschek, R., Witte, S., & Nehls, G. (2013). Far-
reaching effects of a seal scarer on harbour porpoises, Phocoena phocoena. Aquatic
Conservation: Marine and Freshwater Ecosystems, 23(2), 222-232. doi: 10.1002/aqc.2311
Carlström, J., Berggren, P., & Tregenza, N. J. C. (2009). Spatial and temporal impact of pingers on
porpoises. Canadian Journal of Fisheries and Aquatic Sciences, 66(1), 72-82. doi: 10.1139/F08-
186
Carretta, J. V., Taylor, B. L., & Chivers, S. J. (2001). Abundance and depth distribution of harbor porpoise
(Phocoena phocoena) in northern California determined from a 1995 ship survey. Fishery
Bulletin, 99(1), 29-39.
Department of the Navy (DoN). (2017a). Criteria and thresholds for U.S. Navy acoustic and explosive
effects analysis (Phase III) (pp. 194). San Diego, CA: SSC Pacific.
DoN. (2017b). Beaked whale and harbor porpoise monitoring and research requirements: In support of
the 2012 Final Rule for SURTASS LFA sonar. Final Report. Washington, D.C.: Chief of Naval
Operations.
DoN. (2018). Draft supplemental environmental impact statement/supplemental overseas
environmental impact statement for Surveillance Towed Array Sensor System Low Frequency
Active (SURTASS LFA) Sonar (pp. 659). Washington, D.C.: Chief of Naval Operations.
Elliser, C. R., MacIver, K. H., & Green, M. (2017). Group characteristics, site fidelity, and photo-
identification of harbor porpoises, Phocoena phocoena, in Burrows Pass, Fidalgo Island,
Washington. Marine Mammal Science. doi: 10.1111/mms.12459
Embling, C. B., Gillibrand, P. A., Gordon, J., Shrimpton, J., Stevick, P. T., & Hammond, P. S. (2010). Using
habitat models to identify suitable sites for marine protected areas for harbour porpoises
(Phocoena phocoena). Biological Conservation, 143(2), 267-279. doi:
10.1016/j.biocon.2009.09.005
Forney, K. A., Becker, E. A., Foley, D. G., Barlow, J., & Oleson, E. M. (2015). Habitat-based models of
cetacean density and distribution in the central North Pacific. Endangered Species Research, 27,
1-20. doi: https://doi.org/10.3354/esr00632
Gilles, A., Adler, S., Kaschner, K., Scheidat, M., & Siebert, U. (2011). Modelling harbour porpoise seasonal
density as a function of the German Bight environment: implications for management.
Endangered Species Research, 14(2), 157-169. doi: 10.3354/esr00344
Gilles, A., Viquerat, S., Becker, E. A., Forney, K. A., Geelhoed, S. C. V., Haelters, J., . . . Aarts, G. (2016).
Seasonal habitat-based density models for a marine top predator, the harbor porpoise, in a
dynamic environment. Ecosphere, 7(6), e01367. doi: 10.1002/ecs2.1367
Hammond, P.S., Bearzi, G., Bjørge, A., Forney, K., Karczmarski, L., Kasuya, T., . . . Wilson, B. (2017).
Phocoena phocoena. The IUCN Red List of Threatened Species 2008:
e.T17027A6734992. http://dx.doi.org/10.2305/IUCN.UK.2008.RLTS.T17027A6734992.en.
Downloaded on 20 July 2017.
20Hammond, P. S., Macleod, K., Berggren, P., Borchers, D. L., Burt, L., Cañadas, A., . . . Vázquez, J. A.
(2013). Cetacean abundance and distribution in European Atlantic shelf waters to inform
conservation and management. Biological Conservation, 164(2013), 107-122. doi:
http://dx.doi.org/10.1016/j.biocon.2013.04.010
Heide-Jorgensen, M. P., Iversen, M., Nielsen, N. H., Lockyer, C., Stern, H., & Ribergaard, M. H. (2011).
Harbour porpoises respond to climate change. Ecology and evolution, 1(4), 579-585. doi:
10.1002/ece3.51
Isojunno, S., Matthiopoulos, J., & Evans, P. G. H. (2012). Harbour porpoise habitat preferences: robust
spatio-temporal inferences from opportunistic data. Marine Ecology Progress Series, 448, 155-
170. doi: 10.3354/meps09415
Jacobson, E. K., Forney, K. A., & Harvey, J. T. (2015). Acoustic evidence that harbor porpoises (Phocoena
phocoena) avoid bottlenose dolphins (Tursiops truncatus). Marine Mammal Science, 31(1), 386-
397. doi: 10.1111/mms.12154
Johnston, D. W., Westgate, A. J., & Read, A. J. (2005). Effects of fine-scale oceanographic features on the
distribution and movements of harbour porpoises Phocoena phocoena in the Bay of Fundy.
Marine Ecology Progress Series, 295, 279-293.
Kastelein, R. A., Helder-Hoek, L., & Van de Voorde, S. (2017). Hearing thresholds of a male and a female
harbor porpoise (Phocoena phocoena). Journal of the Acoustical Society of America, 142(2),
1006-1010. doi: 10.1121/1.4997907
Kastelein, R. A., Hoek, L., de Jong, C. A. F., & Wensveen, P. J. (2010). The effect of signal duration on the
underwater detection thresholds of a harbor porpoise (Phocoena phocoena) for single
frequency-modulated tonal signals between 0.25 and 160 kHz. The Journal of the Acoustical
Society of America, 128(5), 3211-3222. doi: 10.1121/1.3493435
Leopold, M. F., Begeman, L., van Bleijswijk, J. D. L., IJsseldijk, L. L., Witte, H. J., & Grone, A. (2015).
Exposing the grey seal as a major predator of harbour porpoises. Proceedings of the Royal
Society B: Biological Sciences, 282, 20142429. doi: 0.1098/rspb.2014.2429
Mannocci, L., Roberts, J. J., Miller, D. L., & Halpin, P. N. (2017). Extrapolating cetacean densities to
quantitatively assess human impacts on populations in the high seas. Conservation Biology,
31(3), 601-614. doi: 10.1111/cobi.12856
NMFS (National Marine Fisheries Service). (2018). 2018 Revision to: Technical Guidance for Assessing
the Effects of Anthropogenic Sound on Marine Mammal Hearing (Version 2.0): Underwater
thresholds for onset of permanent and temporary threshold shifts (pp. 167). Silver Spring, MD:
U.S. Department of Commerce, National Oceanic and Atmospheric Administration. NOAA
Technical Memorandum NMFS-OPR-59.
NOAA (National Oceanic and Atmospheric Administration). (2012). Taking and importing marine
mammals: taking marine mammals incidental to U.S. Navy Operations of Surveillance Towed
Array Sensor System Low Frequency Active Sonar; Final Rule. National Marine Fisheries Service,
National Oceanic and Atmospheric Administration, Commerce. Federal Register 77(161), 50290-
50322.
Palka, D. L., Rossman, M. C., VanAtten, A. S., & Orphanides, C. D. (2008). Effect of pingers on harbour
porpoise (Phocoena phocoena) bycatch in the US Northeast gillnet fishery. Journal of Cetacean
Research and Management, 10(3), 217-226.
Read, A. J. (2013). Development of conservation strategies to mitigate the bycatch of harbor porpoises
in the Gulf of Maine. Endangered Species Research, 20, 235-250. doi: 10.3354/esr00488.
Read, A. J., & Westgate, A. J. (1997). Monitoring the movements of harbour porpoises (Phocoena
phocoena) with satellite telemetry. Marine Biology, 130(2), 315-355.
21Roberts, J. J., Best, B. D., Mannocci, L., Fujioka, E., Halpin, P. N., Palka, D. L., . . . Lockhart, G. G. (2016).
Habitat-based cetacean density models for the U.S. Atlantic and Gulf of Mexico. Sci Rep, 6,
22615. doi: 10.1038/srep22615
Tougaard, J., Carstensen, J., Teilmann, J., Skov, H., & Rasmussen, P. (2009). Pile driving zone of
responsiveness extends beyond 20 km for harbor porpoises (Phocoena phocoena (L.)). Journal of
the Acoustical Society of America, 126(1), 11-14.
Tougaard, J., Wright, A. J., & Madsen, P. T. (2015). Cetacean noise criteria revisited in the light of
proposed exposure limits for harbour porpoises. Marine Pollution Bulletin, 90(1-2), 196-208. doi:
10.1016/j.marpolbul.2014.10.051
Villadsgaard, A., Wahlberg, M., & Tougaard, J. (2007). Echolocation signals of wild harbour porpoises,
Phocoena phocoena. Journal of Experimental Biology, 210, 56-64.
22You can also read