Increasing benthic vent formation: a threat to Japan's ancient lake - Nature
←
→
Page content transcription
If your browser does not render page correctly, please read the page content below
www.nature.com/scientificreports
OPEN Increasing benthic vent formation:
a threat to Japan’s ancient lake
Michio Kumagai1*, Richard D. Robarts2 & Yasuaki Aota1
An autonomous underwater vehicle (AUV) was deployed in Lake Biwa from 2000 to 2012. In December
2009, ebullition of turbid water was first found in the deepest area (> 90 m) of the North Basin.
Follow-up investigations in April and December 2010 and January 2012 confirmed the existence of
benthic vents similar to the vents observed in other deep lakes. Importantly, vent numbers per unit
travel distance in Lake Biwa dramatically increased from only two vents (0.37 vents km−1) in December
2009 to 54 vents (5.28 vents km−1) in January 2012, which could be related to recent tectonic activity
in Japan, e.g., the M9.1 Tohoku earthquake in March 2011 and slow earthquakes along the Nankai
Trough from 2006 to 2018. Continuous back-up investigations from 2014 to 2019 revealed additional
benthic vents in the same area. The sudden increase in benthic vent activity (liquid and gaseous
ebullitions) have significant potential to alter lake biogeochemistry and, ultimately, degrade Japan’s
major drinking water source and may be a harbinger of major crustal change in the near future.
Benthic vents. Lake Biwa, the oldest and largest tectonic lake in Japan, formed almost 4.2 million years ago
in an area 100 km south of its present location. Plate tectonic activity is believed to have moved the lake to the
present location about 0.4–1.5 million years ago1,2. The lake volume is 27.5 k m3, or about 34% of Japan’s surface
fresh water3. Lake Biwa is the drinking water source for > 14 million people living in the Kinki District, including
the areas of Osaka, Kobe, Kyoto, Nara and Shiga. The lake thus is a precious freshwater resource that requires
close monitoring and strict conservation3,4.
Using high-definition video and still pictures obtained with the AUV “Tantan”5, we documented interesting
phenomena occurring on the lake bottom. In August 2006 (Fig. 1a), imagery from Tantan showed aggrega-
tions of benthic invertebrates that are endemic to the lake—specifically planarians (Bdellocephala annandalei)6
and amphipods (Jesogammarus annandalei)7,8—in a narrow 0.4 m × 0.3 m area. Evidence of initial sediment
disturbance near the lake’s deepest site in the North Basin (613 k m2, maximum depth 104.1 m) was also found.
These results warranted additional surveys and analyses to better understand if the high biomass and localized
concentration of benthic organisms in such a limited area is related to food availability, and most importantly, to
get a better understanding of what is disturbing the lake sediments. Although in principle turbidity can be due
to bioturbation9, given the magnitude of the turbulence required and the small animals we observed at this site,
this seemed an unlikely explanation. This pronounced bottom ebullition was not apparent in any of the images
recorded before 2006 and was the focus of the present study.
Tantan was deployed on 27 December 2009 in an area > 90 m deep in the North Basin of Lake Biwa. Its video
cameras revealed a conspicuous vent (Fig. 1b) with vertical temperature instabilities and turbid water originating
from natural sources. Similar environments have been reported in Lake Baikal with a deep-towed c amera10, in
Lake Tanganyika by scuba-diving i nvestigation11 and Lake Taupo with a manned submersible vehicle12, where
warm water ebullition from hydrothermal vents caused the formation of bacterial colonies. In Japan, some
hydrothermal vents were observed in other lakes, such as Lake M ashu13 and Lake T owada14, and in marine areas
such as Kagoshima B ay15. However, all of these are due to volcanic activities, whereas the Lake Biwa benthic
vents are due to tectonic movement and further differ from them in their sudden appearance and increase over
the last decades.
Observations in April 2010 were similar to those in December 2009, but the results in December 2010 and
January 2012 showed a dramatic contrast: the benthic boundary layer was much less transparent due to turbid
water (1.01 ± 0.11 FTU (Formazin Turbidity Unit), N = 9 in 2006; 2.19 ± 0.42 FTU, N = 19 in 2009; 2.63 ± 0.21
FTU, N = 6 in 2010; 3.23 ± 0.33 FTU, N = 5 in 2012), and many additional vents and plumes were detected along
the observation lines (Table 1). The number of vents per unit Tantan travel distance was corroborated from two
sets of high-definition video camera images. We carefully identified vents with sediment ebullitions (Fig. 1b–d)
without any external disturbance, such as fish bioturbation. These data indicated there were no vents before
1
Ritsumeikan University, Noji‑Higashi 1‑1‑1, Kusatsu, Shiga 525‑0058, Japan. 2World Water and Climate
Foundation, 1348 Crown Isle Blvd, Courtenay, B.C V9N 0E2, Canada. *email: mkt24354@se.ritsumei.ac.jp
Scientific Reports | (2021) 11:4175 | https://doi.org/10.1038/s41598-021-83649-4 1
Vol.:(0123456789)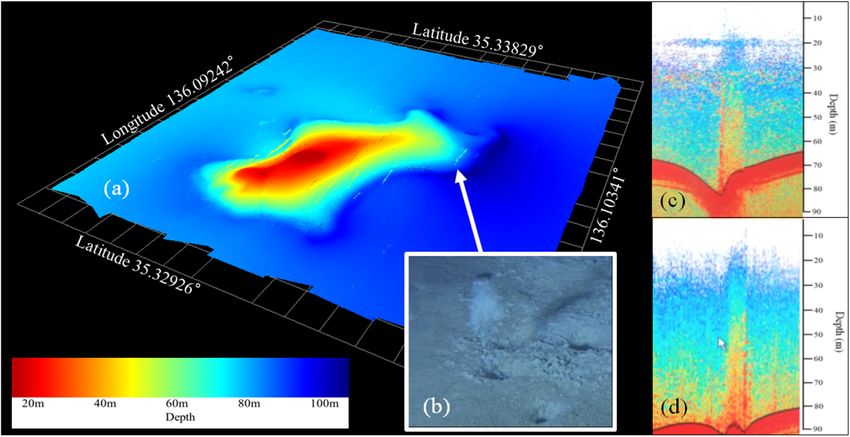
www.nature.com/scientificreports/
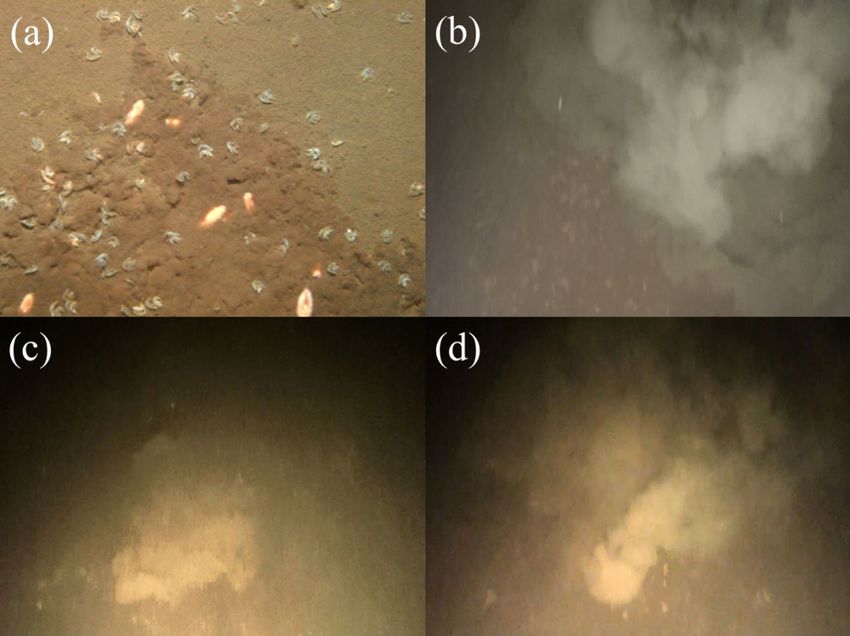
Figure 1. Photographs and images (from video film) taken by AUV “Tantan” in Lake Biwa at almost the same
position as Fig. 2b. (a) Photo of benthic planarians (Bdellocephala annandalei), amphipods (Jesogammarus
annandalei) and sediment disturbance near the deepest area on 25 August 2006. This digital camera image
covers about 0.4 m in the horizontal and 0.3 m in the vertical planes. (b) A video image of a vent with high
turbidity ebullition on 27 December 2009. The scale of this vent is nearly 2 m wide, 2 m deep and 1 m high.
(c) Similar video image of a vent with a height of 0.5 m taken on 17 December 2010. (d) Video image of a
vent detected with a height of 0.5 m and growing with a 1 m vertical scale and 4 m horizontal scale taken on 7
January 2012. The locations where images (a–d) were obtained are indicated in Fig. 3.
Date Number of vents (N) Distance (km) Line density (N km−1) SD (N km−1)
2002 0 21.73 0.00 ND
2003 0 17.10 0.00 ND
2004 0 18.87 0.00 ND
2005 0 16.81 0.00 ND
2006 0 30.11 0.00 ND
2007 0 45.61 0.00 ND
Dec 17–21 2008 0 11.72 0.00 ND
Nov 8–11 2009 0 11.83 0.00 ND
Dec 25–27 2009 2 5.43 0.37* ND
Apr 26–28 2010 7 7.65 0.44** 0.39
Dec 16–18 2010 23 10.84 3.43** 1.16
Jan 5–8 2012 54 12.64 5.28** 3.76
Table 1. Number of vents detected by AUV “Tantan”, its cruising distance and unit distance density of vents
from 2002 to 2012. *Indicates number of vents over distance. **Evaluated from linear regression on number of
vents against distance.
December 2009, but there were 0.37 vents km−1 on 25–27 December 2009 and 5.28 vents km−1 on 5–8 January
2012 (Table 1).
Confirmation of vent activities
To confirm vent activity, we conducted additional surveys using a multi-beam echo sounder, a quantitative echo
sounder, and a ROV from 2014 to 2018. A wide view of bottom topography was provided by the multi-beam echo
sounder (Fig. 2a), and several gas ebullitions around the base of the submerged mound (dark red color) were
found with vertical streaming lines of small clumped bubble segments. These gasses transport materials, such as
Scientific Reports | (2021) 11:4175 | https://doi.org/10.1038/s41598-021-83649-4 2
Vol:.(1234567890)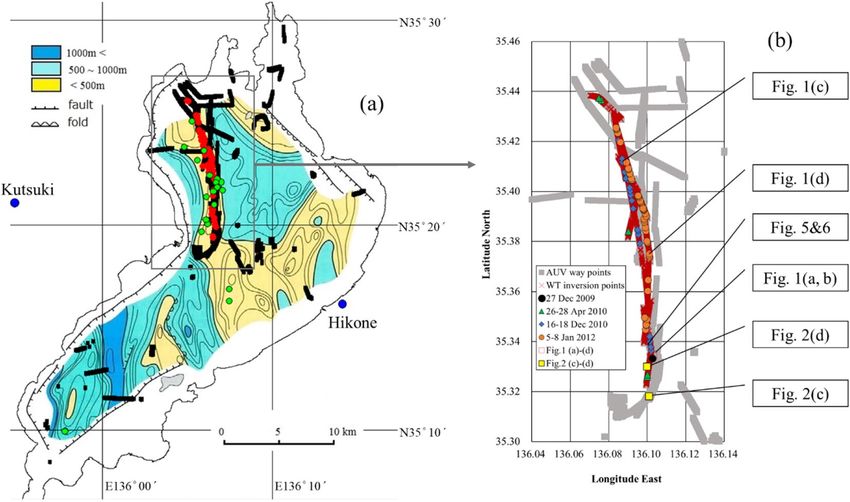
www.nature.com/scientificreports/
Figure 2. Schematic images of benthic vents in Lake Biwa. (a) The stereoscopic bottom image and gas bubble
ebullitions measured by multi-beam sonar (MBS), where the dark red color indicates the shallow area (20 m
depth) that used to be a submerged mountain peak and the dark blue color indicates the deepest area of Lake
Biwa (104 m depth), (b) holes and intermittent gas bubbles observed by the ROV (NHK) with benthic vent
location indicated by an arrow in the MBS image, and both (c) and (d) vertical plumes from a benthic vent
observed by a quantitative echo sounder, where the vertical scale on the right is water depth. Gas bubbles
formed vertical streaming lines with small bubble cluster segments, which may contribute to vertical material
transport. Image (c) shows the horizontal spread of bubbles at the thermocline located at about 20 m, and in
(d) the bubbles reached the water surface as no thermocline was present. The locations where images (c,d) were
obtained are indicated in Fig. 3.
nutrients, from the bottom sediment to overlying water (Fig. 2c,d), and may enhance water column microbial
production. Indeed, average phytoplankton production in Lake Biwa increased from 574 mgC m−2 day−1 in
2006/2007 to 1104 mgC m−2 day−1 in 2017/18 16.
ROV monitoring of benthic vents was near the deepest point of Lake Biwa on 15 May 2014. Several vents
were found (Fig. 2b) where gas bubbles emerged intermittently at nearly 10 s intervals. Many large sized Daphnia
species were observed around these vents, possibly Daphnia pulicaria, which is a zooplankton species that sud-
denly appeared after 1999 in the offshore zone of Lake Biwa17. We also found some microbial mats around the
holes, which are typical features of hydrothermal vents in lakes Baikal10, Tanganyika11 and Taupo12. We collected
two gas samples with the ROV and analyzed the gas bubbles emitted from the Lake Biwa holes. Methane was
the major constituent (> 99%), which is known to support bacterial growth and could explain the large Daphnia
spp. population that was observed18,19. Some dissolved methane concentrations in Lake Biwa were measured
before20,21, but it is difficult to take gas samples without any special devices such as an ROV attached sampler or
human occupied v ehicle22.
Gas plumes (Fig. 2c) have also been observed at several sites using a quantitative echo sounder from 2012
to 2019 as further evidence of vent existence. As these gas plumes were identified with target strengths between
− 60 dB and − 50 dB, the bubble size was estimated as ~ 40 mm in d iameter23. The bubbles spread horizontally
along the bottom of the thermocline in the stratified season (Fig. 2c) and reached the water surface during the
mixing season (Fig. 2d)24. Such gas movement is known to contribute to vertical material transport, which can
be another important mechanism of internal nutrient loading25, and can additionally contribute to atmospheric
greenhouse gas production. Gas ebullition from the sediments of wet ecosystems is a GHG pathway that has
long been underestimated but generally dominates emissions26.
Alternative origins and locations of vents
To examine the possibility that the marked high turbidity near the bottom of Lake Biwa may be due in part to
sediment re-suspension arising from shear instability in the benthic boundary layer, we deployed an acoustic
Doppler current profiler (ADCP) to measure water velocity profiles every half an hour for 551 days from 2010
to 2012. Bottom shear stress was calculated from 31,898 field data profiles27. The results showed that only 29
profiles (21 in 2010, 1 in 2011 and 7 in 2012) were > 10 N m−2, the critical bottom stress needed to resuspend
bottom sediments , while 96.3% (30,727 profiles) were < 1.0 Nm−2. The maximum value greater than critical
28
shear stress was 19.95 Nm−2 measured in 2010. The probability of generating high bottom stress due to shear
instability is < 0.1%, which clearly does not explain the increased and continuing turbidity from 2010 to 2012.
Sediment ebullition could also be the result of deep groundwater inflows. As Lake Biwa is surrounded by
mountains, groundwater seepage can be found in many places, but these are mainly concentrated in areas < 40 m
Scientific Reports | (2021) 11:4175 | https://doi.org/10.1038/s41598-021-83649-4 3
Vol.:(0123456789)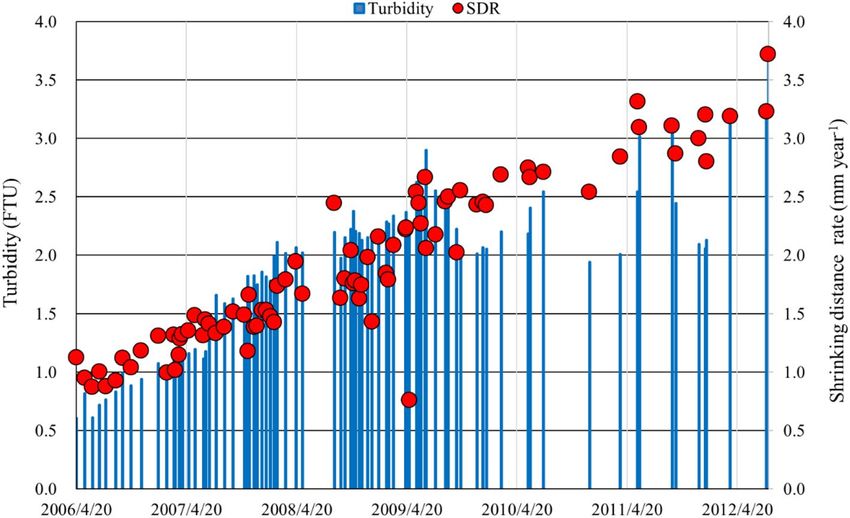
www.nature.com/scientificreports/
Figure 3. Waypoint locations for the AUV Tantan operated from 2001 to 2012 and the benthic vents detected
from 2009 to 2012. (a) The way points (filled black rectangles) and the vents (orange circles) are plotted on the
modified basement rock map of Lake Biwa with sediment thickness indicated with a color index (after Uemura
and Taishi, 1990). The green circles indicate large ebullitions of gas and water observed using a quantitative
echo sounder from 2012 to 2019. Noteworthy is that these vents are located along the shallow sedimentation
region (< 500 m) indicated by light yellow, which may correspond to an ancient mountain range of several
million years ago that gradually sank to form the present lake basin due to tectonic movement. The lake
sediments accumulated during the last several hundred thousand years. (b) An enlarged map of way points
(grey rectangle), water temperature inversion points measured by Tantan (red crosses) and vents from 2009 to
2012 (measurement dates are given in legend). A sediment temperature profile in Fig. 4 was measured at the
same point (filled black rectangle) on 27 December 2009. The locations where the images/figures in Figs. 1a–d,
2c,d, 5 and 6 were obtained are indicated by symbols and arrows.
deep29 near the shore. The recent benthic vents, however, are unlikely to be caused by ordinary groundwater
inflows because the recent rapid increase of lake turbidity and the ebullition locations in areas > 80 m deep do
not coincide with the area of groundwater seepage previously o bserved30,31.
Thus, we conclude that neither groundwater inflows or bottom shear stresses were responsible for the sud-
den recent turbidity observed in the Tantan surveys. Rather, we believe that the evidence suggests that benthic
vents are the cause, and when seeking possible mechanisms of their formation in Lake Biwa, the lake’s geologic
history and formation2,32 becomes crucial.
Geologic history of Lake Biwa
The present area of Lake Biwa is believed to have been mountainous terrain a few million years ago, but then
subsided at about 0.74 mm year−1. This occurred because it lies on the northwest section of a crustal block that
was affected by a change in direction of compression, first from south to north then from east to west, owing to
complex plate tectonic interactions in the central i sland2.
Comparing the thickness of accumulated sediments from about 1.5 Ma to the present d ay2,33 with the loca-
tions of the benthic vents detected between 2009 and 2012 shows that the vents are located along the area of
shallow sedimentation, corresponding roughly to the location of the former mountain range (Fig. 3). A large
negative gravity anomaly of -60 mGal was measured around Lake Biwa, indicating a thin crustal layer under
the lake or the presence of low-density materials due to faults34. This area of the lake bottom not only has many
faults but has also been subjected to large earthquakes (> M7.0) every 400–500 y ears35. These background data
suggest that the benthic vents found in Lake Biwa did not originate from ground water, but are related to active
tectonic movements. For example, using the data from 2006 to 2012, the turbidity [Turb (FTU)] at the deepest
point in the lake is positively correlated with the east–west lake shrinking distance rate [SDR (mm year−1)] as
[Turb] = 0.9866[SDR], where N = 83 and r2 = 0.66, which suggests that crustal movements caused the increase in
ebullitions (Fig. 4). The M9.1 earthquake off the Pacific coast of Tohoku on 11 March 2 01136–38 can be consid-
ered as one of the typical tectonic events compressing the Japanese Archipelago. Also, various slow earthquakes
along the Nankai Trough were detected between 2006 and 201839, and water temperature in several deep wells
(< 150 m) along the south coast of the main island in Japan rapidly rose from 2017 to 2019 (c.a. 0.09 K year−1,
Kamikubo et al. personal communication). Benthic vent formation in Lake Biwa was concomitant with these
phenomena. Our findings may also be a harbinger of a large earthquake in this area of Japan in the near future.
Scientific Reports | (2021) 11:4175 | https://doi.org/10.1038/s41598-021-83649-4 4
Vol:.(1234567890)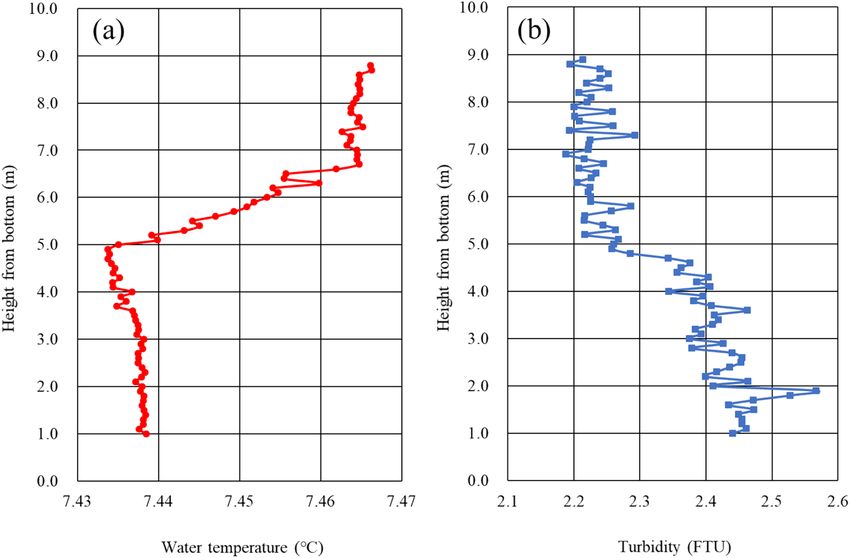
www.nature.com/scientificreports/
Figure 4. Temporal changes in turbidity (bar graph) at 1 m above the lake bottom and shrinking distance
rate (SDR) of Lake Biwa between Hikone (east side) and Kutsuki (west side) from 2006 to 2012 (see Fig. 3)
were highly correlated (r2 = 0.66 and p < 0.01 for N = 83). Increasing vent number detected by the AUV also
corresponded to the increase of lake shrinking distance rate over six years.
Evidence from physical limnology
Intensive observations by Tantan were completed along several transects in December 2009, April and Decem-
ber 2010 and January 2012. The water temperature gradient was measured with two thermistors located 0.58 m
apart and vertically attached on the head of Tantan. The data showed a temperature inversion, with a maximum
gradient of 0.08 K m−1 (average 0.003 K m−1, upward positive, N = 29,912 and 64.27% > 0) in the benthic bound-
ary near the benthic vents (white smokers in Fig. 1b); i.e., the water temperature near the bottom was slightly
but significantly higher than the temperature of the overlying water column. The water temperature inversion
points are plotted in Fig. 3. Temperature inversion is usually unstable in freshwater lakes, as mixing of the water
column would usually be expected to remove such an inversion. However, if highly turbid water occurs in the
benthic boundary layer, the density profile near the bottom can be stable (Fig. 5). Moreover, if the lake bottom
is continuously heated, the unstable condition can persist. In order to verify this situation, we deployed 6 RBR
thermistors to measure sediment temperature gradients vertically in the bottom sediment near the deepest
point in Lake Biwa from 1 July 2010 to 4 January 2012. The results showed a large mean temperature gradient of
0.2 K m−1, where the upward gradient was positive (N = 69,455 and SD = 0.014 K m−1), indicating strong upward
heat flux in the bottom sediments at the deepest point in Lake Biwa (Fig. 3) over the two-year deployment period
from 2010 to 2012 (Fig. 6), which was almost 5 times greater than the heat flux outside the benthic vent area
(about 0.04 K m−1).
Irrespective of the cause for these observed physical changes in the lake bottom, the rapid increase of vents
and the associated increased turbidity and GHG releases in Lake Biwa requires systematic ongoing surveil-
lance. The increases in turbidity in the deep benthic layer were not due to benthic shear stress or groundwater
inflows, but mainly due to ebullition created by the recently increasing number of vents. These dramatic changes
have the potential to not only indicate possible major crustal change but also significantly impact the health of
Lake Biwa by increasing influxes to the water column of nutrients, particles and greenhouse gases, and leading
to biogeochemical and ecological changes within the lake and ultimately deterioration in lake environmental
quality. Indeed, satellite observation of the lake from 2002 to 2018 has indicated a steady increase in chlorophyll
concentration, concomitant with algal production (Goto et al. personal communication, 2019). This could sig-
nificantly impact millions of people that depend upon Lake Biwa for a range of ecosystem services and drinking
water, and thus is an environmental problem and priority demanding close monitoring with advanced technol-
ogy such as an AUV40.
Methods
The world’s first autonomous underwater vehicle (AUV) “Tantan”, developed for lake ecosystem exploration and
monitoring, was built in 2000. After test operations in 2000 and 2001, Tantan started to monitor the sediment
environments with digital and video cameras in 2002. It has a length of 2 m and weighs 180 kg in air. Maximum
speed in water is 1.0 m s−1 with a diving depth of 170 m. This automated, untethered vehicle was operated along
way points keeping a fixed height of 1 m above lake sediments using an ultra-sonic distance device. The position
of Tantan underwater was determined with a SSBL (Super Short Base Line; System Engineering Corp.) and DVL
(Doppler Velocity Log; RDI). The AUV drifted about 0.15 km km−1 after 123 operations due to mechanical errors.
Location coordinates were corrected with a GPS on the water surface at each dive.
Scientific Reports | (2021) 11:4175 | https://doi.org/10.1038/s41598-021-83649-4 5
Vol.:(0123456789)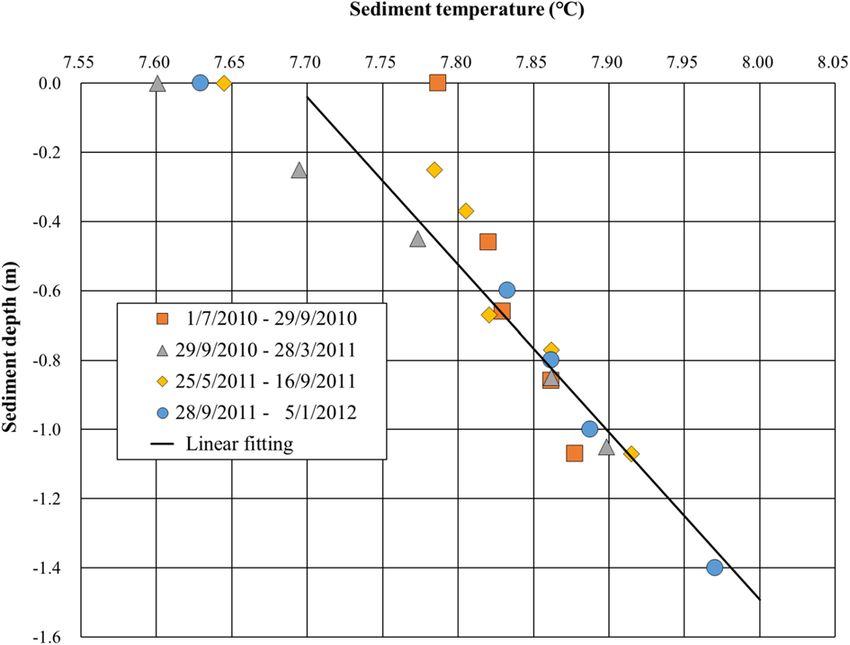
www.nature.com/scientificreports/
Figure 5. (a) Water temperature profile and (b) turbidity profile in the benthic boundary layer near the deepest
area in the North Basin of Lake Biwa measured on 28 September 2011. Warmer temperature and higher
turbidity coexist in the layer from 1 to 5 m above the bottom, which may maintain density stability.
Figure 6. Sediment temperature profiles measured near the deepest point of Lake Biwa from 2010 to
2012 (location indicated in Fig. 3). Plotted are the average data during four periods: July 1 to September 29,
2010; September 29, 2010 to March 28, 2011; May 25 to September 16, 2011; September 28, 2011 to January 5,
2012 and the linear regression fitted line for all data. This line indicates an upward heat flux of 0.2 K m−1 from
the sediment to the water.
A key feature of Tantan is the ability to take two high-definition digital video movies and one digital still
picture at the same t ime4. These video cameras faced forward and covered almost the same view. Tantan is also
equipped with sensors to observe benthic environmental water temperature, pH, turbidity, dissolved oxygen,
conductivity and chlorophyll-a, which were used to determine the environmental conditions in different water
bodies during the investigations. Using the two video cameras (SONY HDR-SR12), we obtained video images
of vents and were able to identify their position with SSBL (SGK System Giken) and DVL (RDI Doppler Veloc-
ity Log). The transect line densities of vents after 2010 in Table 1 were evaluated from linear regression of the
accumulated numbers of vents against travel distance.
We used Tantan to measure the vertical water temperature gradient at 1 m above the lake bottom along a
transect line with two high resolution temperature probes (RBR with accuracy of 0.002 K). One thermistor
Scientific Reports | (2021) 11:4175 | https://doi.org/10.1038/s41598-021-83649-4 6
Vol:.(1234567890)www.nature.com/scientificreports/
was attached to the top foredeck of Tantan, while another was fixed to its bottom surface, and the gradient was
calculated over the height difference of 0.58 m between top and bottom probes. The thermistor positions were
carefully fixed in order to avoid wrong readings due to AUV battery heating.
We also used a multi-beam echo sounder (MB1, Teledyne, 170 kHz–220 kHz), a quantitative echo sounder
(Kaijo, KFC-3000, 70 kHz), and a ROV (NHK original assembly) to identify the positions of vents and gas
ebullitions. To identify bottom sediment resuspension, we deployed a 1200 kHz acoustic RDI Doppler current
profiler (ADCP) fixed facing downward from 10 m above the bottom at 90 m from September 2010 to January
2012. Gases were collected on two occasions using an original sampling device attached to the ROV, developed
by Ritsumeikan University’s robotics team, and analyzed by gas chromatography.
Temperature profiles in bottom sediments were measured with RBR probes located at 0.0, 0.60, 0.80, 1.00,
1.20 and 1.40 m below the water–sediment interface near the deepest point where vents were found. The sam-
pling interval was set to 10 min. The east–west direction shrinking distance rate [SDR (mm year−1)] of Lake
Biwa was estimated with field data from two stations, Kutsuki (west side) and Hikone (east side), within the
dense Global Positioning System (GPS) network in J apan41. In Fig. 5, turbidity was measured with a fine-scale
profiler (F-probe) at 1 m height above the lake bottom. FTU (Formazin Turbidity Unit) is the most widely used
measurement unit for turbidity.
Data availability
All data used here are available from the first author.
Received: 4 March 2020; Accepted: 3 February 2021
References
1. Horie, S. Lake Biwa 1–654 (Dr. W. Junk, Berlin, 1984).
2. Takemura, K., Haraguchi, T., Kusumoto, S. & Itoh, Y. Tectonic basin formation in and around Lake Biwa, Central Japan. Mechan.
Sedim. Basin Form. 9, 209–229. https://doi.org/10.5772/56667 (2013).
3. Kumagai, M., Vincent, W. F., Ishikawa, K. & Aota, Y. Lessons from Lake Biwa and other Asian lakes. In Freshwater Management:
Global Versus Local Perspectives (eds Kumagai, M. & Vincent, W. F.) 4–33 (Springer-Verlag, Berlin, 2003).
4. Kumagai, M. Lake Biwa in the context of world lake problems. Verh. Inter. Verein. Limnol. 30, 1–15 (2008).
5. Kumagai, M., Ura, T., Kuroda, Y. & Walker, R. F. A new autonomous underwater vehicle designed for lake environment monitor-
ing. Adv. Robot. 16, 17–26 (2002).
6. Oki, I. et al. Chromosomes of Phagocata kawakatsui and Bdellocephala annandalei from Lake Biwa-ko in Honshú, central Japan.
Hydrobiologia 383, 315–320 (1998).
7. Trevorrow, M. V. & Tanaka, Y. Acoustic and in situ measurements of freshwater amphipods (Jesogammarus annandalei) in Lake
Biwa, Japan. Limnol. Oceanogr. 42, 121–132 (1997).
8. Ishikawa, T. & Urabe, J. Population dynamics and production of Jesogammarus annandalei, an endemic amphipod, in Lake Biwa,
Japan. Freshw. Biol. 47, 1935–1943. https://doi.org/10.1046/j.1365-2427.2002.00942.x (2002).
9. Svensson, J. & Leonardson, L. Effects of bioturbation by tube-dwelling chironomid larvae on oxygen uptake and denitrification in
eutrophic lake sediments. Freshw. Biol. 35, 289–300 (1996).
10. Crane, K., Hecker, B. & Golubev, V. Hydrothermal vents in Lake Baikal. Nature 350, 281 (1991).
11. Tiercelin, J.-J. et al. Hydrothermal vents in Lake Tanganyika, East African, Rift system. Geology 21, 499–502 (1993).
12. de Ronde, C. E. J. et al. Discovery of active hydrothermal venting in Lake Taupo, New Zealand. J. Volcanol. Geotherm. Res. 115,
257–275 (2002).
13. Igarashi, G. et al. Mantle helium flux from the bottom of Lake Mashu, Japan. Earth Planet. Sci. Lett. 108, 11–18. https://doi.
org/10.1016/0012-821X(92)90056-2 (1992).
14. Nishiura, R., Tsunogai, U., Ishibashi, J., Wakita, H. & Nojiri, Y. Origin of 13C-enriched methane in the crater lake Towada, Japan.
Geochem. J. 33, 277–283 (1999).
15. Yamanaka, T. et al. Shallow submarine hydrothermal activity with significant contribution of magmatic water producing talc
chimneys in the Wakamiko Crater of Kagoshima Bay, southern Kyushu, Japan. J. Volcanol. Geotherm. Res. 258, 74–84 (2013).
16. Goto, N. Evaluation of Organic Carbon Budgets in Lake Biwa for Management of Water Quality and Ecosystem 37–54 (Environment
Research and Technology Development Fund, Japan Ministry of the Environment, Tokyo, 2019) (in Japanese).
17. Urabe, J., Ishida, S., Nishimoto, M. & Weider, L. J. Daphnia pulicaria, a zooplankton species that suddenly appeared in 1999 in the
offshore of Lake Biwa. Limnology 4, 35–41 (2003).
18. Deines, P. & Fink, P. The potential of methanotrophic bacteria to compensate for food quantity or food quality limitations in
Daphnia. Aquat. Microbial Ecol. 65, 197–206. https://doi.org/10.3354/ame01542 (2011).
19. Schilder, J. et al. The stable carbon isotopic composition of Daphnia ephippia in small, temperate lakes reflects in-lake methane
availability. Limnol. Oceanogr. 60, 1064–1075. https://doi.org/10.1002/lno.10079 (2015).
20. Murase, J., Sakai, Y., Sugimoto, A., Okubo, K. & Sakamoto, M. Sources of dissolved methane in Lake Biwa. Limnology 4, 91–99.
https://doi.org/10.1007/s10201-003-0095-0 (2003).
21. Tsunogai, U. et al. Dual stable isotope characterization of excess methane in oxic waters of mesotrophic lake. Limnol. Oceanogr.
9999, 1–16. https://doi.org/10.1002/Ino.11566 (2020).
22. Tsunogai, U. et al. Origin and fate of deep-sea seeping methane bubbles at Kuroshima Knoll, Ryukyu forearc region, Japan. Geo-
chem. J. 44, 461–476 (2010).
23. Holliday, D. V. & Pieper, R. E. Volume scattering strengths and zooplankton distributions at acoustic frequencies between 0.5 and
3 MHz. J. Acous. Soc. Am. 67, 135–146 (1980).
24. Borges, A. V. et al. Diffusive methane emissions to the atmospherefrom Lake Kivu (Eastern Africa). J. Geophy. Res. 116, G03032.
https://doi.org/10.1029/2011JG001673 (2011).
25. Ostrovsky, I., McGinnis, D. F., Lapidus, L. & Eckert, W. Quantifying gas ebullition with echosounder: the role of methane transport
by bubbles in a medium-sized lake. Limnol. Oceanogr. Methods 6, 105–118 (2008).
26. Aben, R. C. H. et al. Cross continental increase in methane ebullition under climate change. Nat. Commun. 8, 1682. https://doi.
org/10.1038/s41467-017-01535-y (2017).
27. Howarth, M. J. & Souza, A. J. Reynolds stress observations in continental shelf seas. Deep-Sea Res. II(52), 1075–1086 (2005).
28. Otsubo, K. & Muraoka, K. Critical shear stress of cohesive bottom sediments. J. Hydrol. Eng. 114, 1241–1256 (1988).
29. Taniguchi, M. Change in groundwater seepage rate into Lake biwa, Japan. Jpn. J. Limnol. 56, 261–267 (1995).
Scientific Reports | (2021) 11:4175 | https://doi.org/10.1038/s41598-021-83649-4 7
Vol.:(0123456789)www.nature.com/scientificreports/
30. Tsurumaki, M. & Kobayashi, M. Interaction of lake and ground water: Case study of Lake Biwa. J. Geogr. 98, 53–77 (1989) (in
Japanese with English abstract).
31. Kobayashi, M. Groundwater seepage into Lake Biwa traced by pollutants. Tracers in Hydrology. IAHS 215, 143–150 (1993).
32. Horie, S. (ed.) Paleolimnology of Lake Biwa and the Japanese Pleistocene 99 (Kyoto University, Kyoto, 1983).
33. Uemura, Y. & Taishi, H. Active tectonics of the bottom of Lake Biwa and development of its lake basin, southwest Japan. Geogr.
Rev. Jpn. B. 63, 722 (1990).
34. Nishida, J., Katsura, I. & Nishimura, S. Gravity survey around Lake Biwa, southwest Japan. J. Phys. Earth. 38, 1–17 (1990).
35. Goto, S., Yamanom, M. & Kinoshita, M. Thermal response of sediment with vertical fluid flow to periodic temperature variation
at the surface. J. Geophy. Res. 110, B11006. https://doi.org/10.1029/2004JB003419 (2005).
36. Geller, G. Shake-up time for Japanese seismology. Nature 472, 407–409 (2011).
37. Sato, M. et al. Displacement above the hypocenter of the 2011 Tohoku-Oki earthquake. Science 332, 1395 (2011).
38. Ozawa, S. et al. Coseismic and postseismic slip of the 2011 magnitude-9 Tohoku-Oki earthquake. Nature 475, 373–376 (2011).
39. Yokota, Y. & Ishikawa, T. Shallow slow slip events along the Nankai Trough detected by GNSS-A. Sci. Adv. 6, 1–11. https://doi.
org/10.1126/sciadv.aay5786 (2020).
40. Clarke, T. Robots in the deep. Nature 421, 468–470 (2003).
41. Sagiya, T., Miyazaki, S. & Tada, T. Continuous GPS array and present-day crustal deformation of Japan. Pure Appl. Geophys. J. Int.
109, 2303–2322 (2000).
Acknowledgements
The authors express sincere thanks to T. Ura for designing the AUV “Tantan” and thank the crews of R/V
Hakken, the operators of AUV Tantan (C. Jiao, R. Walker, K. Ishikawa, Y. Aota, K. Morinaga, K. Fukagae, J.
Kawamura, M. Takeoka, M. Morikawa and H. Tsujimura), NHK (Japan Broadcasting Corporation) and Hydro
System Development Incorporation for their support with the field experiments. We are grateful for suggestions
and comments to improve the manuscript by W.F. Vincent, R. Pienitz, I. Ostrovsky, T. Nakajima, Y. Kagotani,
T. Tsukuda, G. Sugihara, T. Nagata, M. Yamano and D. Hamilton. We also thank N. Goto for providing unpub-
lished chlorophyll and primary production data in Lake Biwa and H. Kamikubo for sharing continuous water
temperature data for deep wells in Shizuoka Prefecture. This project was financially supported by Grants-in-Aids
for Scientific Research (20244079 and 25281007) from the Japan Society for the Promotion of Science, the Global
Environmental Research Fund (Fa-084) of the Ministry of the Environment Japan, the NEXCO Partners Club
Foundation, the financial support of the Authorized NPO Biwako Trust, the Mitsubishi Scientific Foundation,
the Shiga Prefectural Government fund and JST SICORP Grant Number JPMJCR1804, Japan.
Author contributions
M.K. designed this study, collected and analyzed the field data, and shared the writing. R.D.R. participated in the
data analysis and shared the writing. Y.A. supported the field observations with the AUV Tantan and contributed
to the data acquisition and analysis.
Competing interests
The authors declare no competing interests.
Additional information
Correspondence and requests for materials should be addressed to M.K.
Reprints and permissions information is available at www.nature.com/reprints.
Publisher’s note Springer Nature remains neutral with regard to jurisdictional claims in published maps and
institutional affiliations.
Open Access This article is licensed under a Creative Commons Attribution 4.0 International
License, which permits use, sharing, adaptation, distribution and reproduction in any medium or
format, as long as you give appropriate credit to the original author(s) and the source, provide a link to the
Creative Commons licence, and indicate if changes were made. The images or other third party material in this
article are included in the article’s Creative Commons licence, unless indicated otherwise in a credit line to the
material. If material is not included in the article’s Creative Commons licence and your intended use is not
permitted by statutory regulation or exceeds the permitted use, you will need to obtain permission directly from
the copyright holder. To view a copy of this licence, visit http://creativecommons.org/licenses/by/4.0/.
© The Author(s) 2021
Scientific Reports | (2021) 11:4175 | https://doi.org/10.1038/s41598-021-83649-4 8
Vol:.(1234567890)You can also read