Geophysical investigation of potential active tectonic deformation in Lake Wanaka - PPrepared for Otago Regional Council July 2020
←
→
Page content transcription
If your browser does not render page correctly, please read the page content below
Geophysical investigation of
  potential active tectonic
deformation in Lake Wanaka

     Prepared for Otago Regional Council

                  July 2020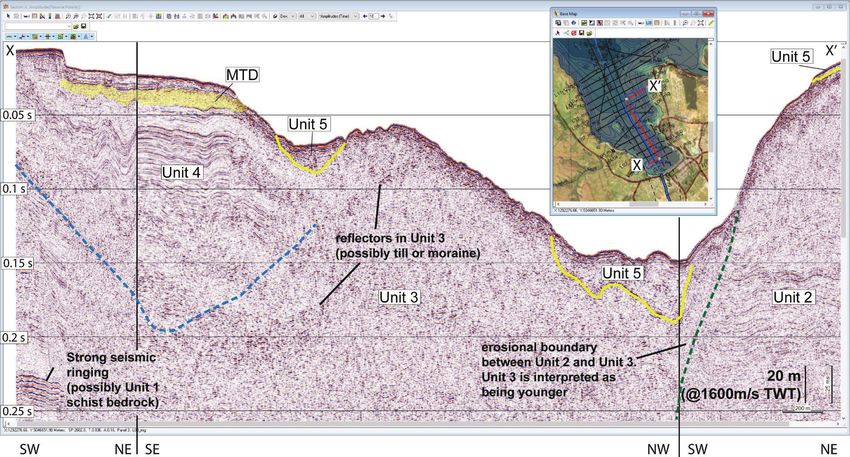
Prepared by:
Joshu Mountjoy
Susi Woelz
For any information regarding this report please contact:
Joshu Mountjoy
Programme Leader
Ocean Geology
+64-4-386 0336
Joshu.Mountjoy@niwa.co.nz
National Institute of Water & Atmospheric Research Ltd
Private Bag 14901
Kilbirnie
Wellington 6241
Phone +64 4 386 0300
NIWA CLIENT REPORT No: 2020054WN
Report date: March 2020
NIWA Project: ORC20301
Quality Assurance Statement
Reviewed by: Philip M Barnes
Formatting checked by: Alex Quigley
Approved for release by: Steve Wilcox
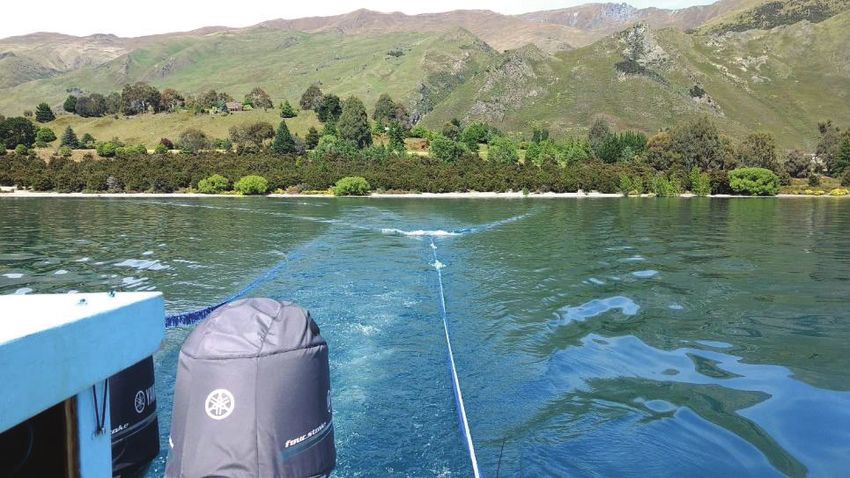
Boomer seismic surveying equipment on Lake Wanaka. [Joshu Mountjoy, NIWA]
© All rights reserved. This publication may not be reproduced or copied in any form without the permission of
the copyright owner(s). Such permission is only to be given in accordance with the terms of the client’s contract
with NIWA. This copyright extends to all forms of copying and any storage of material in any kind of
information retrieval system.
Whilst NIWA has used all reasonable endeavours to ensure that the information contained in this document is
accurate, NIWA does not give any express or implied warranty as to the completeness of the information
contained herein, or that it will be suitable for any purpose(s) other than those specifically contemplated
during the Project or agreed by NIWA and the Client.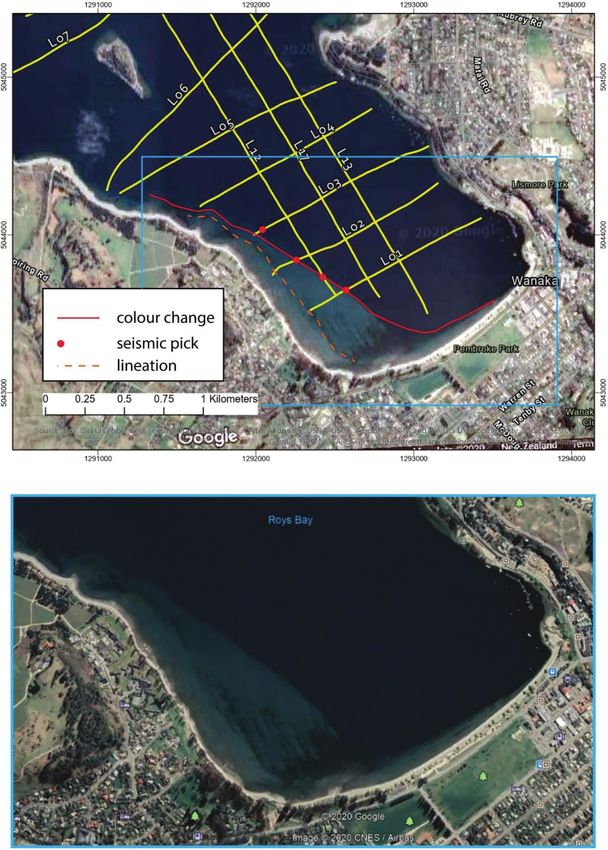
Contents
Executive summary ............................................................................................................. 5

1       Background and contract objectives ........................................................................... 6

2       Study area ................................................................................................................. 7
        2.1      Regional geology and sedimentology of Lake Wanaka ............................................ 7
        2.2      Previous bathymetric survey work in and around Lake Wanaka ............................. 9
        2.3      Background to onshore NW Cardrona Fault mapping............................................ 10

3       Data acquisition and processing ............................................................................... 11
        3.1      Equipment and survey parameters ........................................................................ 12
        3.2      Survey narrative ...................................................................................................... 14
        3.3      Data quality assessment ......................................................................................... 15
        3.4      Data processing workflow ...................................................................................... 15
        3.5      Interpretation methodology ................................................................................... 16

4       Results .................................................................................................................... 17
        4.1      Sub-bottom sediment character and distribution .................................................. 17

5       Discussion of results ................................................................................................ 24
        5.1      Interpretation with respect to the NW Cardrona Fault .......................................... 24
        5.2      Landslide deposits................................................................................................... 25

6       Recommendations ................................................................................................... 26

7       Acknowledgements ................................................................................................. 27

8       Glossary of abbreviations and terms ........................................................................ 28

9       References............................................................................................................... 29

Appendix A                     Uninterpreted seismic reflection profiles .......................................... 30

Tables
Table 1:             Data acquisition specifications for Lake Wanaka Boomer seismic
                     survey.                                                                                                           13
Table 2:             Processing steps and parameters as used for all Boomer seismic
                     lines acquired at Lake Wanaka.                                                                                    16
Table 3:             Deformation rate data considering three possible ages for the
                     folded lake sequence in Roys Bay Basin (Figure 9 and Figure 10).                                                  24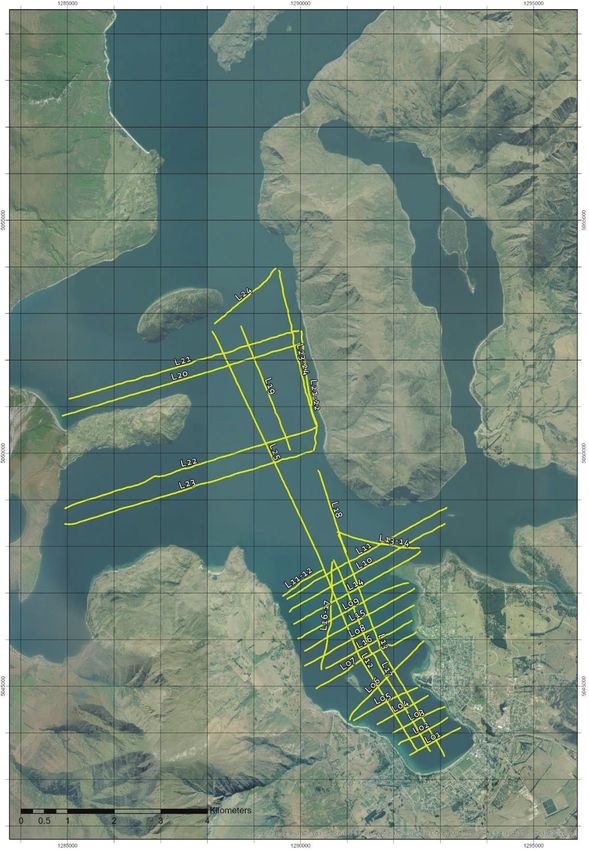
Figures
Figure 1: Geology map from QMAP 1:250,000 series (Turnbull 2000). 7
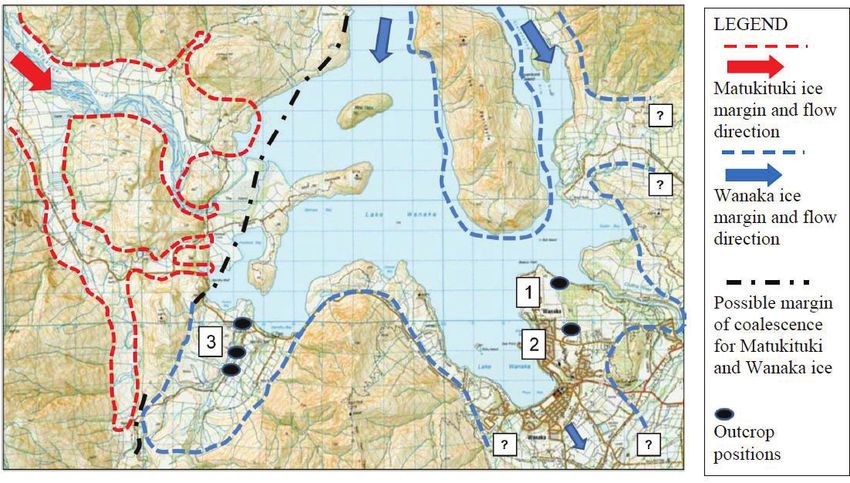
Figure 2: Aggregated extent of glacial ice advances and locations of glacial
deposits mapped in an MSc project (Sutherland, Carrivick et al. 2019). 8
Figure 3: Lake Wanaka bathymetric map. 9
Figure 4: Updated fault map for the Lake Wanaka region (Barrell 2019). 10
Figure 5: Lake Wanaka with Boomer seismic lines shown in yellow. 11
Figure 6: Boomer seismic geometry on RV Rukuwai. 12
Figure 7: Equipment and instrument set-up on RV Rukuwai during the Lake
Wanaka Boomer seismic survey. 13
Figure 8: Composite seismic line showing the relationship between seismic
stratigraphic units. 19
Figure 9: Map showing distribution of seismic units and mapped folds. 20
Figure 10: Interpreted seismic Line 01 to Line 03 illustrating folding of two
picked reflectors (green and blue) in the Roys Bay basin sequence. 22
Figure 11: Shoaling area at SW margin of Roys Bay. 23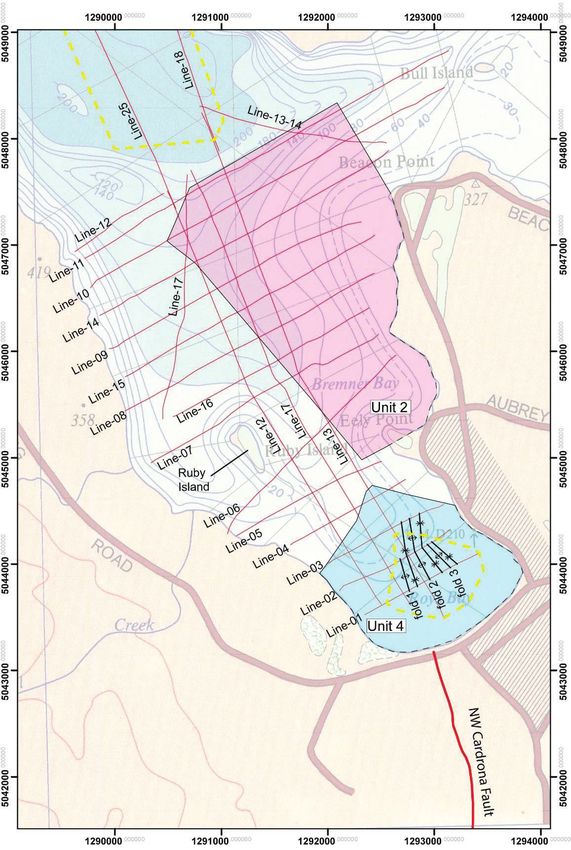
Executive summary
Following identification by GNS Science of surface deformation interpreted to be related to the NW
Cardrona Fault, Otago Regional Council contracted NIWA to investigate the lakeward continuation of
deformation.

This report documents the acquisition, processing and interpretation of new boomer seismic
reflection data acquired in Lake Wanaka in December 2019. The survey was designed to image
lakebed sediments that could preserve evidence for tectonic deformation related to the NW
Cardrona Fault in Wanaka.

Overall the dataset is of excellent quality with some variability due to weather and boating
conditions. A very good seismic wave penetration was achieved in most parts of the survey area even
in the deepest parts of the Aspiring Basin.

Imaging quality is variable as expected in this sedimentary environment. Layered lake sediments are
imaged well and occur along the north eastern margin of Roys Bay near Beacon Point and at the
southern end of Roys Bay near Wanaka Township. In other areas imaging is mostly chaotic and
discontinuous and interpreted as including glacial till, glacial moraine and landslide/rock avalanche
deposits which are known to be difficult to image in high resolution seismic reflection data. Sediment
gas locally attenuates the seismic signal very well and is present through most of the Aspiring Basin
and areas north of that.

The layered lake sediments at the southern end of Roys Bay near Wanaka Township show evidence
for folding with amplitudes up to 12 m and wavelength up to 130 m. There is evidence for sediment
deformation at the lakefloor but the magnitude of folding is less in the shallow sediments. The strike
of folds is mapped as N-S. No other evidence for sediment deformation such as displacement by
faulting has been observed.

A mass transport deposit (MTD) up to 10 m thick sits in the upper part of the folded sequence
covering more than 0.5 km2. MTDs are also identified in Aspiring Basin and inferred to form chaotic
facies within Unit 2.

As no clear evidence for a fault has been identified the origin of folding cannot be unequivocally
stated. We consider three possible origins: 1) Glacier induced stresses during ice advance, 2) Stress
induced by gravitational collapse of the Mt Roy/Mt Alpha range, 3) Tectonic induced stress. We note
that the strike of the folds is similar to deformation associated with the NW Cardrona Fault indicating
that they are likely to have the same origin. To better understand the nature of the observed
deformation it is recommended the following could be undertaken: 1) mini airgun seismic to image
deeper and identify if bedrock is offset. 2) acquire multibeam bathymetry to analyse tectonic
geomorphology, as well as investigating landslide deposits. 3) Re-examine outcrops along strike
where folding of glacial sequences has been attributed to glaciotectonics.

Geophysical investigation of potential active tectonic deformation in Lake Wanaka                     5
1      Background and contract objectives
NIWA was approached to complete an investigation to confirm the presence (or otherwise) of a likely
active trace of the NW Cardrona Fault that has been identified by GNS Science (Barrell 2019) in the
township of Wanaka and projected to continue in Lake Wanaka in a NW-SE direction through Roys
Bay.

To achieve this a “boomer” seismic reflection survey was proposed and then completed in December
2019. The geophysical data have been processed and this report documents the data acquisition and
processing parameters, and the interpretation of the data with respect to evidence of the lakeward
extent of the NW Cardrona Fault.

6                         Geophysical investigation of potential active tectonic deformation in Lake Wanaka
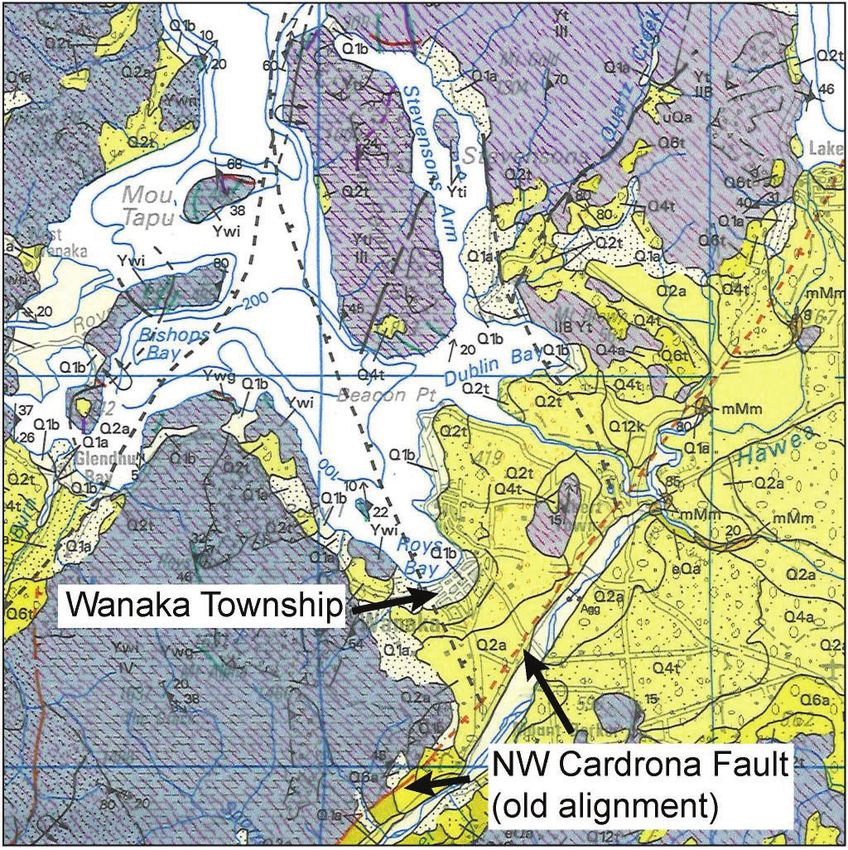
2        Study area
2.1      Regional geology and sedimentology of Lake Wanaka
Lake Wanaka and surrounding area is underlain by metamorphosed rocks of the Rakaia Terrane
Schist (Turnbull 200) (Figure 1). The area has been heavily affected by past glaciations which have
carved out the valleys that lakes Wanaka and Hawea now occupy and are responsible for shaping the
majority of the landforms in the region. The formation of Lake Wanaka is dated at 29±5 kyr3. The
southern shore of Lake Wanaka, including Wanaka township and from Roys Bay north east to Dublin
Bay is predominantly underlain by glacial till and outwash gravels from multiple glacial advances
(Figure 1 and Figure 2).

Figure 1: Geology map from QMAP 1:250,000 series (Turnbull 2000). Yellow indicates Quaternary deposits
with Q2t and Q4t being glacial till. Grey blue hatched area indicates schist. Red lines indicate active faults and
black dashed lines inactive faults. This map shows the previous alignment of the NW Cardrona Fault striking
towards Lake Hawea at the top right corner of the map. The new mapped alignment of the NW Cardrona Fault
branches onto the black dashed line into Lake Wanaka as shown in Figure 4.

Geophysical investigation of potential active tectonic deformation in Lake Wanaka                                    7
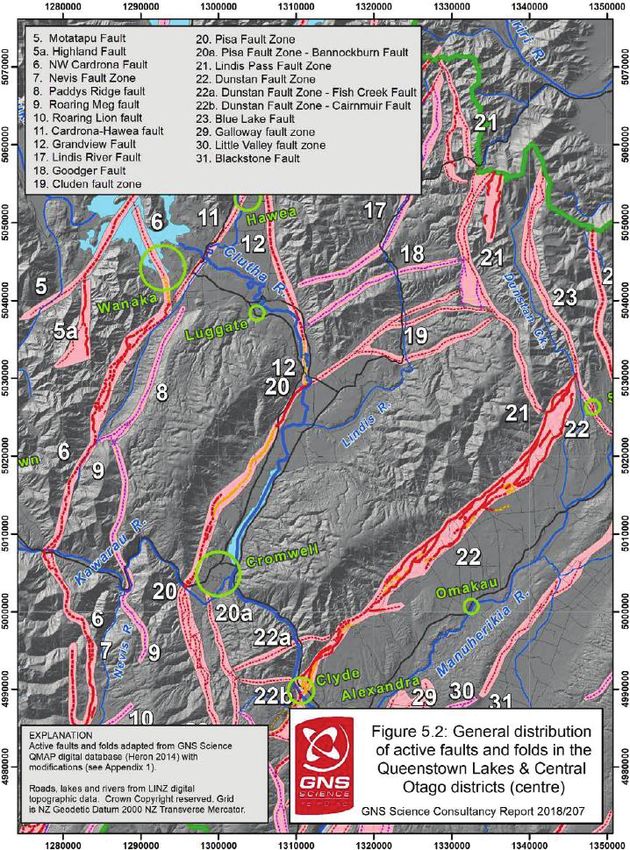
Figure 2: Aggregated extent of glacial ice advances and locations of glacial deposits mapped in an MSc
project (Sutherland, Carrivick et al. 2019). Of relevance to this study are 1 (Beacon Point) and 2 (Korimako
Crescent).

8                            Geophysical investigation of potential active tectonic deformation in Lake Wanaka
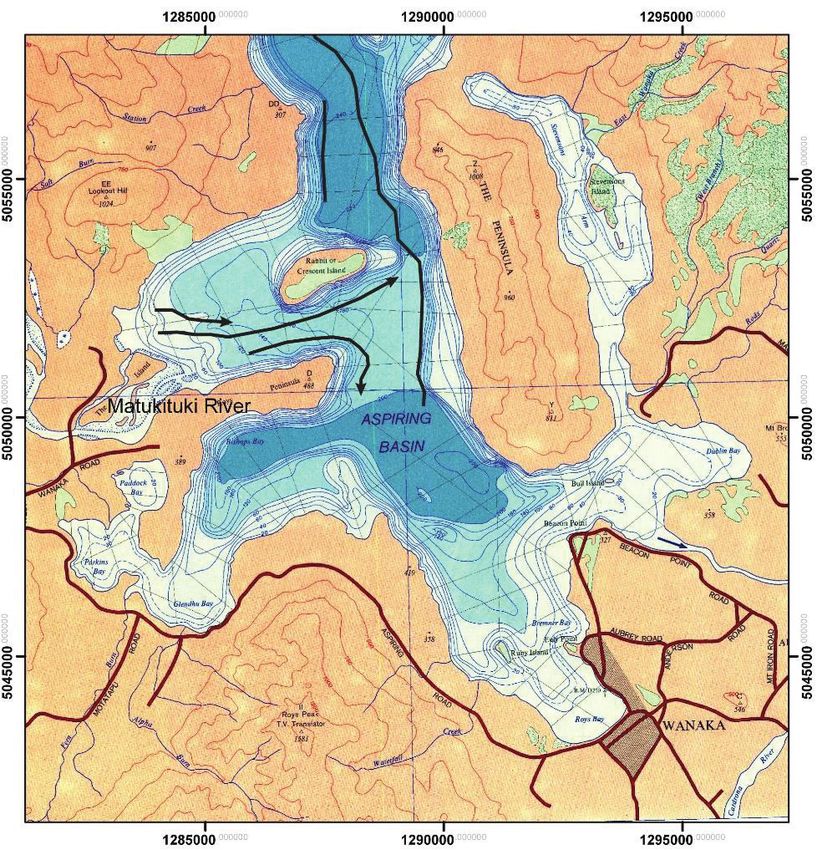
2.2     Previous bathymetric survey work in and around Lake Wanaka
A bathymetric survey was carried out in 1976 using single beam echo sounder to map the lake
bathymetry (Irwin and Ridgeway 1976) (Figure 3). This captures the broad morphology of the lake
and in the southern end including Roys Bay, Dublin Bay and Glendhu Bay the lake progressively
deepens to the Aspiring Basin. North of Aspiring Basin the lake shoals between The Peninsula and
Rabbit Island before deepening into a northern basin. Lakefloor channels have been mapped from
the Matukituki River extending into Aspiring Basin and interpreted as being fed by river derived
turbidity currents (Irwin and Ridgeway 1976).

Figure 3: Lake Wanaka bathymetric map. Previously mapped lakefloor channels (Irwin and Ridgeway 1976) are
shown as black lines with inferred sediment flow direction indicated by arrows. Coordinates are NZTM.

Geophysical investigation of potential active tectonic deformation in Lake Wanaka                       9
2.3     Background to onshore NW Cardrona Fault mapping
Based on topographic interpretation from new lidar data a re-interpretation of the NW Cardrona
Fault has it extending north from the Cardrona valley and through part of Wanaka township (Barrell
2019) (Figure 4), instead of northeast to Lake Hawea (Turnbull 2000) (Figure 1). The mapped surface
deformation is in the form of a monoclinal fold, interpreted to deform old lake-beach landforms <
18,000 years. The fold deforms a ~100 to ~200 m wide zone of ground that has been up-warped to
the west by 4-5 m causing a gentle easterly tilt across that zone. The alignment of the monocline
indicates it strikes NNW into Roys Bay. The NW Cardrona Fault is the most active fault in the district,
with a slip rate of 0.38 mm/yr and calculated recurrence interval 5,500 years.

Figure 4: Updated fault map for the Lake Wanaka region (Barrell 2019). The fault of interest to this study is
number 6, the NW Cardrona Fault.

10                           Geophysical investigation of potential active tectonic deformation in Lake Wanaka
3       Data acquisition and processing
Boomer seismic data acquisition took place on 2nd and 3rd December 2019 on-board NIWA’s 6 m
research vessel Rukuwai II. Some 30 seismic lines were acquired during the course of the two days,
totalling 92 line-kilometres (Figure 5).

Figure 5: Lake Wanaka with Boomer seismic lines shown in yellow.

Geophysical investigation of potential active tectonic deformation in Lake Wanaka                    11
3.1     Equipment and survey parameters
The seismic source was a CSP-300 Joule Applied Acoustics AA201 boomer plate towed from a CAT200
catamaran (Table 1). The 25 m long GeoEel high-resolution streamer had 16 channels with a 1.5625
m group interval (2 hydrophones per group). It was towed using a 25 m long tow cable and 10 m
stretch section.

During the survey, the boomer plate/catamaran and hydrophone streamer were towed on separate
sides of RV Rukuwai, with the boomer source towed portside about 20 m behind the stern and the
streamer towed starboard side about 24 m behind the stern with approx. 2.4 m horizontal separation
(see Figure 6).

Figure 6: Boomer seismic geometry on RV Rukuwai. Distances were measured onboard and later corrected
using the first arrivals from the acquired data.

For navigation we used a MarineStar 9200 GPS unit with a Fugro-provided XP corrections signal. With
the corrections signal the system can provide horizontal accuracy of 20-30 cm and the location
information is written directly into the seismic data header.

The GeoEel CNT2 recording system included the streamer deck unit (SPSU), SPSU 230 to 60-volt
power supply and an acquisition computer with monitor.

The boomer shot firing rate was 1.0 s at a nominal boat speed of 4.0 knots to give a nominal 6-fold
(stacked) coverage. The sampling rate was 0.125 ms with a record length of 0.5 s.

The configuration allowed for a serial string, containing the ship’s navigation, to be fed from the
navigation system into the GeoEel seismic acquisition computer and to be logged with the SEG-D
formatted files, which is a format developed by the Society of Exploration Geophysicists (SEG) for
field seismic data. Line number and DGPS status were also included. DGPS coverage was available for
the majority of the survey. Minor navigation jumps observed during data processing have been
corrected.

12                         Geophysical investigation of potential active tectonic deformation in Lake Wanaka
Figure 7: Equipment and instrument set-up on RV Rukuwai during the Lake Wanaka Boomer seismic survey.

Table 1: Data acquisition specifications for Lake Wanaka Boomer seismic survey.
                 Source                                 CSP-300 Joule Applied Acoustics AA201
 Receiver                                 16 channels GeoEel with a 1.5625m group interval, two
                                          hydrophones per channel.
 Tow depth                                Source and Receiver at about 0.5 m.
 Navigation                               Fugro MarineStar 9200 GPS.
 Shot Firing Rate                         1 s.
 Nominal boat speed                       4 kn.
 Resulting fold                           6.25, later enhanced to 12 to 18 through processing.
 Recording length                         0.5 s.
 Data sampling rate                       0.125 ms.
 Offset to 1st active streamer channel    Nominal 4.7 m, later corrected through automated picking of first
                                          arrival.

Geophysical investigation of potential active tectonic deformation in Lake Wanaka                             13
3.2 Survey narrative
Otago Regional Council Boomer seismic survey (December 2019).
30th November and 1st December 2019 – Travel days: Wellington to Wanaka.
2nd December 2019 – Survey day 1 acquiring Boomer seismic data in Roys Bay, Bremner Bay, around
Beacon Point and up to Bull Island.
8:00 am Boat in water at Wanaka Marina, preparing equipment for deployment.
8:30 am Equipment in water, testing and setting of parameters for survey.
9:20 am Start of Survey with Line 01.
12:15 pm Weather becoming slightly rougher.
5:27 pm End of Line 17, end of survey day 1.
6:15 pm Equipment out of water, heading back to Wanaka Marina.
7:00 pm Boat out of water in Wanaka marina.
Weather: Temperatures between 8 and 15 °C , wind between 5 and 8 km/h from NE with gusts of 10
km/h, 35 % cloud coverage, average humidity 75%, afternoon rain becoming stronger towards
evening.
3rd December 2019 – Day 2 surveying across Aspiring Basin and behind Roys Peninsula south of
Crescent Island.
7:00 am Boat in water at Wanaka Marina, preparing equipment for deployment.
7:23 am Start of survey with Line 18.
Ongoing problems with unresponsive part of streamer.
08:06 am End of Line 19, acquisition dropped to 8 channels, changed first AD-converter.
09:20 am Start of Line 20, strong noise on several channels, streamer check at end of line.
11:22 am Resume survey with Line 21, weather became rougher.
03:40 pm End of Line 25, end of survey day 2.
04:00 pm Equipment out of water and partly packed up.
4:45 pm Boat out of water in Wanaka Marina.
Weather: Temperatures between 9 and 13 °C, wind between 11 and 21 km/h with gusts of over 30
km/h, 80% cloud coverage, 85 % humidity, rain all day becoming less for a shorter period in the
afternoon.
4th and 5th December 2019 – Travel days: Wanaka to Wellington.
14 Geophysical investigation of potential active tectonic deformation in Lake Wanaka3.3 Data quality assessment Survey lines were navigated with as little deviation as possible. Some lines had to be truncated as they ran into shallow water unsafe for the vessel and the gear, especially when turning off-line. The data quality in general was good, with the variability arising from the acquisition direction due to weather and lake-state conditions, in particular on the second survey day. Gas masking was significant on several lines, blanking the reflectors beneath the impedance layer. There were also some locations closer to the lake shores or in vicinity of the lake’s islands with significant sideswipe reflection coming from steep slopes. Strong multiple energy was observed in several places. Typically, acoustic penetration was up to 100 - 125 ms beneath the lakefloor (i.e., equivalent to a sub-bottom depth of ~80 – 100 m, assuming 1600 m/s for the sound velocity in recent sediments), with occasional penetration down to 150 ms beneath the lakefloor. There is good penetration even at lake depth of greater than 160 m. 3.4 Data processing workflow All lines were processed in the same way using Globe Claritas® software, as summarised in Table 2 and described briefly hereafter. After converting the data from SEG-D to SEG-Y and extracting the navigation information, data were inspected visually, and lines were trimmed to focus on straight sections and line portions with useful signal. A band-pass filter test was carried out to try to eliminate noise originating from low or high frequency sources. The resulting corner filter frequencies of 150-300-1250-2000 Hz ensured both: the elimination of high and low frequency noise. Furthermore, missing traces and/or shots were added and the acquisition geometry set (common depth point/CDP spacing 1 m, binning 1.5 m) before the shots per line were written into the Globe Claritas’® SEG-Y format. A pre-stack deconvolution was applied to sharpen the signal before stacking and therefore enhance the signal-to-noise ratio. After sorting the data into CDP gathers, the Normal-Move-Out was corrected with a constant velocity of 1500 m/s before stacking and a post-stack deconvolution was applied to further enhance the signal. Migration of seismic data ensures reflections are shown at the right position and angle and collapses diffracted energy to its originating location. We use a Finite-Difference Migration allowing dip angles up to 45° to be corrected. Throughout the processing, the seismic header was updated several times in order to refine further processing (e.g., digitising the lakefloor reflection in the header is necessary for muting unwanted signal above this reflector). To finalise the processing, a further band-pass filter, as well as a coherency filter, was applied and any signal above the lakefloor was muted. An AGC function was applied for production of the final dataset. The final SEG-Y has a 500 ms trace length and has shot-point numbers (also referred to as shot pegs) in the 240-byte trace header in bytes 17-20. Navigation information in New Zealand Transverse Mercator can be found in the same header in bytes 81-84 and bytes 85-88. Geophysical investigation of potential active tectonic deformation in Lake Wanaka 15
Table 2: Processing steps and parameters as used for all Boomer seismic lines acquired at Lake Wanaka.
              Process                                  Explanation/parameters/comments
 Read SEG-D data                     Convert SEG-D to SEG-Y, extract navigation.
 Update header                       Fill missing shots and traces.
 Geometry                            Set up source and receiver geometry in trace header.
 Data QC and Band-pass filter        Remove faulty traces, band-pass filter 150-300-1250-2000 Hz.
 Pre-stack deconvolution             Filter length 40 ms, gap 0.5 ms.
 CDP gather                          Sorting the data into CDP gathers.
 Offset correction                   Automated first arrival picking and writing directly into seismic trace
                                     header.
 NMO correction                      Correction for normal move-out with constant velocity 1500 m/s.
 Stack                               13 to 20-fold stack.
 Update header information           Digitised lakefloor written into header.
 Migration                           FD migration with time slice window of 5 ms and dip filter factor of
                                     0.707, velocity 1500 m/s.
 Frequency filter                    Band-pass filter corner frequencies: 150-300-1250-2000 Hz.
 Coherency filter                    5 trace running mix window with 0.05, 0.1, 0.7, 0.1, 0.05 weight
                                     function.
 AGC                                 50 ms median type window.
 Surgical mute                       Mute above lakefloor.
 Update header information           Shotpoints (with a multiplier of 10) written.
 Write SEG-Y files                   Written in 240-byte standard trace header:
                                     Shot peg position in bytes 17-20
                                     Easting (NZTM) in bytes 81-84
                                     Northing (NZTM) in bytes 85-88.
Appendix A shows Line 1 to Line25 from the Lake Wanaka Boomer seismic survey.

3.5     Interpretation methodology
Interpretation of seismic data has been carried out using IHS Kingdom Suite software. Stratigraphic
unit mapping and interpreted deformation has been mapped into ESRI ArcGIS for map interpretation
and figure production. This report focuses on the area south of Aspiring Basin. Although boomer
seismic data was collected to the north of Aspiring Basin it is of limited use for the objectives of this
study due to the presence of sediment gas and poor imaging and therefore we do not include it in
the interpretation here. For seismic interpretation and conversion of thicknesses to depth we use a
velocity of 1600 m/s TWT.

Recognition of tectonic deformation in seismic reflection data is based on knowledge of how active
faults deform sedimentary sequences and the interplay of sedimentation and deformation. In lake
basins, sediments are typically deposited as flat-lying relatively thin beds (e.g., Mountjoy, Wang et al.
2019). Variation from flat lying orientation may occur when they are deposited over existing
topography (e.g., draping a bedrock high). Distinguishing between such drape and post-depositional
deformation is subject to interpretation.

16                           Geophysical investigation of potential active tectonic deformation in Lake Wanaka
4 Results 4.1 Sub-bottom sediment character and distribution The seismic interpretation approach followed below is to map and describe the main seismic stratigraphic units as related to glacial advance and retreat. 4.1.1 Seismic units Five units have been identified and mapped where possible (Figure 8). The lateral distribution of the mapped units (2 and 4) is shown in Figure 9. Unit 1 Seismic basement Schist bedrock is exposed onshore around the margins of the lake and on Ruby Island (Figure 1) and is expected to occur everywhere beneath the lake basin sedimentary sequence. The character of bedrock in boomer seismic reflection data is characterised by a reflection off the sediment-bedrock interface and no internal reflectivity is expected. The same seismic character can occur for other coarse clastic sediments and so acoustically opaque units are routinely grouped together as “seismic basement”. It is possible to distinguish bedrock on some seismic profiles adjacent to Ruby Island (e.g., L07 Appendix A) but otherwise there is no clearly mappable bedrock or seismic basement horizon. This is most likely because the energy of the boomer seismic source is not sufficient to penetrate through the inferred glacial till, moraine and rock avalanche deposits of unit 3. Unit 2 thick package of low amplitude coherent reflectivity This is characterised by flat lying laterally continuous reflectivity of relatively low amplitude. The unit continues down to more than 100 m below the lake floor indicating a substantial lacustrine deposit. The unit occurs along the eastern side of Roys Bay (Figure 9). There is a diffuse lateral boundary to the west where this unit abuts Unit 3 (Figure 8). This unit is interpreted as fine-grained lacustrine sediments infilling the Lake Wanaka basin (cf. sampled sediments from Lake Tekapo (Mountjoy, Wang et al. 2019)). The lateral boundary from seismic reflectivity on several lines suggests that Unit 3 has eroded into Unit 2. Unit 2 is interpreted as having been deposited during glacial periods prior to MIS 2, based on the thickness of the sediment package and relationship to other units. Unit 3 Chaotic reflectivity This Unit is characterised by a lack of lateral coherency. Some strong reflectors exist within Unit 3 (see example in Figure 8) but these are of limited extent and mostly cannot be tracked between adjacent seismic profiles so the geological origin is difficult to determine with certainty. This unit is interpreted as being made up of a variety of sedimentary bodies, including glacial till, glacial moraine and landslide or rock avalanche deposits. Unit 4 Localised coherent reflectivity (Roys Bay basin) At the southern end of Roys Bay there is a laterally continuous sequence of coherent reflectivity we informally name Roys Bay basin (Figure 8 and Figure 9). This unit is distinguished from Unit 2 as it only occurs in the shallow section and has a much stronger, sharper seismic signal. It is interpreted as overlying Unit 3 which is deposited on an eroded surface onto Units 1 and 2. It is overlain by small Geophysical investigation of potential active tectonic deformation in Lake Wanaka 17
mini-basins of Unit 5. The reflectors have an undulating geometry which contrasts with the relatively
flat lying reflectors in Unit 2. The uppermost 20 m of Roys Bay basin includes a chaotic unit up to 10
m thick and an extent of at least 0.5 km2.

We interpret Unit 4 as the lacustrine deposits initially deposited in a terminal glacial lake near the
southern extent the Wanaka glacial advance (Figure 2). Based on the stratigraphic relationship with
the other units, Unit 4 is likely associated with the last glacial retreat. Lacustrine sequences mapped
on land to the north east4 (Figure 2) are attributed to the end of the last glaciation and may be the
same unit.

Unit 5 Surface basin sequences

Unit 5 is characterised by laterally coherent reflectivity but generally not flat lying indicating
relatively complex sedimentary structure (Figure 8). Thicknesses range from a few m to more than 40
m. Unit 5 occurs locally as small basin fill sequences making it difficult to correlate between adjacent
seismic lines. It is not shown in Figure 9 due to this uncertainty in lateral extent, and so it does not
obscure Units 2 and 4.

Unit 5 is interpreted as post-glacial fine-grained sedimentary deposits (cf. sampled sediments from
Lake Tekapo (Mountjoy, Wang et al. 2019)) that have accumulated in depressions in other units
following glacial retreat. These are inferred to be mini sediment basins, as opposed to the major
modern sediment depocenter in Aspiring Basin which is also Unit 5 (e.g., layered reflective unit down
to 0.35 s on Line 18 in Appendix A). We infer that Unit 5 is Holocene.

18                         Geophysical investigation of potential active tectonic deformation in Lake Wanaka
Figure 8: Composite seismic line showing the relationship between seismic stratigraphic units. The location of
the seismic profile is indicated by the red line on the inset panel. The scale at left is milliseconds two way travel
time (TWT). Vertical exageration is approximately 10x.

Geophysical investigation of potential active tectonic deformation in Lake Wanaka                                 19
Figure 9: Map showing distribution of seismic units and mapped folds. Fold 1,2 and 3 refer to Table 3. The
extent of the two main coherent reflectivity units (2 and 4) are shown. Identified MTDs are shown as yellow
dashed outlines. The northern-most MTD represents multiple deposits within the Aspiring basin. Coordinates
are NZTM.

20                          Geophysical investigation of potential active tectonic deformation in Lake Wanaka
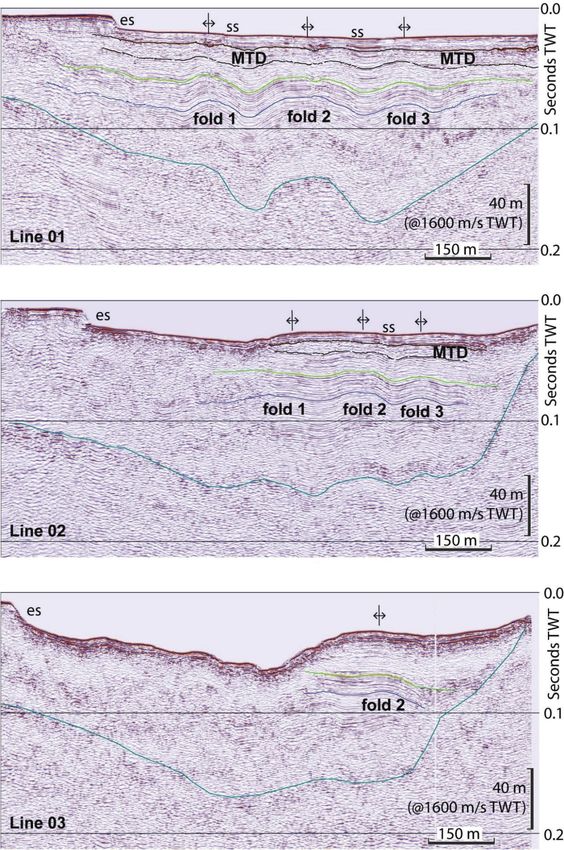
4.1.2 Sediment deformation
Throughout most of the seismic dataset little is observed in terms of deformation of sedimentary
units. Unit 2 occurs as flat lying packages of reflectivity and Unit 3 is not coherent enough to preserve
any clear deformation relationships. The exception is the sedimentary package in Unit 4, informally
termed Roys Bay basin. This package of coherent reflectivity is characterised by undulations that are
65-130 m crest to crest and 4.8-12 m amplitude.

Prominent reflective horizons have been mapped across the area of Roys Bay basin, and gridded in
Kingdom Suite to create surfaces in two way travel time. The crests of undulations have been
mapped between seismic profiles indicating an approximately N-S trend (Figure 9 and Figure 10). This
correlation is only possible on the three southernmost SW-NE lines but provides enough information
to delineate the extent and trend of these features.

The upper 10 m of sediment (e.g., in Line-01) does not exhibit the same magnitude of folding as
occurs at depth (e.g., the green reflector in Figure 10). However, sediment deformation apparently
continues all the way to the lakefloor showing truncated reflectors, onlap relationships and lakefloor
surface scarps (ss) (Figure 10). Disturbance of the reflectivity occurs through the two main undulation
crests however there is no clear evidence for offset reflectors. The geometry of the undulations
indicates that they are mostly symmetrical.

There is a step in the lakefloor at the south western end of Lines 1-3 (labelled es in Figure 10) and at
the southern end of Line 12 (Appendix A). This step is 7.5-13.5 m high and has truncated seismic
reflectors in the slope indicating erosion. In the sedimentary section beneath the step the package of
reflectivity continues beneath it without any noticeable offset (e.g., between the green and blue
reflector in Line 01 in Figure 10). We have identified a change in colour in the lake in Google Earth
imagery that we interpret as a shallow area of the lake at the south western corner of Roys Bay
(Figure 11).

4.1.3 Mass transport deposits
Landslide deposits usually termed Mass Transport Deposits (MTDs) in subaqueous environments are
commonly recognised in seismic reflection profiles by a lack of coherent reflectivity with respect to
layered units above and below (Mackey 2015). MTD’s have been identified in two locations in the
dataset (Figure 9). The clearest of these is in the southern end of Roys Bay. We do not image the full
extent of this MTD unit in seismic data and it is likely to be larger than 5x10⁶ m3. The MTD is overlain
by up to 10 m of younger sediment but as we have no information on sedimentation rates here we
cannot determine any timing for the event.

At least two MTDs are imaged in the southern end of Aspiring Basin (Figure 9). For an example of
these view Line 18 SP500-100 from 0.32-0.34s TWT (Appendix A). We only capture a small area of
these as in the central area of this basin there is significant gas that obscures seismic imaging. The
MTDs are buried by approximately 10 m of layered reflectivity.

Geophysical investigation of potential active tectonic deformation in Lake Wanaka                        21
Figure 10: Interpreted seismic Line 01 to Line 03 illustrating folding of two picked reflectors (green and blue)
in the Roys Bay basin sequence. Ss is surface scarp interpreted as related to folding. Es is erosional scarp
interpreted as related to lakefloor erosion processes. Profile locations on Figure 5and Figure 9.

22                           Geophysical investigation of potential active tectonic deformation in Lake Wanaka
Figure 11: Shoaling area at SW margin of Roys Bay. Underlying image is from Google Maps with an expanded
and uninterpreted view at bottom from Google Earth. The lighter grey coloured area in the SW corner of the
lake is interpreted as shallower water depth. This correlates with the seismic picks of where the step is in Lines
1-3 and Line 12.

Geophysical investigation of potential active tectonic deformation in Lake Wanaka                               23
5         Discussion of results
5.1       Interpretation with respect to the NW Cardrona Fault
The observed undulations in Roys Bay basin stratigraphy have a trend that matches the strike of the
newly mapped NW Cardrona Fault (Figure 9). The undulations are interpreted as folds rather than
sediment waves or draped pre-sedimentation topography. The NNW-SSE orientation of the folds
indicates a WSW-ENE orientation of principal stress.

The continuity of reflectivity in the sedimentary sequence beneath the lakefloor scarp (Figure 10)
that correlates to the shallow area of the lake in the SW corner of Roys Bay (Figure 11) indicates that
this is not a fault related feature.

Using the measured fold amplitudes and a range of published ages, a vertical rate of folding can be
calculated. Restoring the mapped reflectors across the folded length of the sequence indicates
shortening of approximately 7%, equal to ~49 m.

Table 3: Deformation rate data considering three possible ages for the folded lake sequence in Roys Bay
Basin (Figure 9 and Figure 10). Surface scarps are indicated as ss in Figure 10. References for ages used for
rates (shown in brackets) are: Date for formation of Lake Wanaka 29±5 kyr (Sutherland, Carrivick et al. 2019) is
inferred to be the oldest possible age of deposition marking the formation of the Lake Wanaka water body.
Average age for the initiation of deglaciation following the LGM 18 kyr (Sutherland, Carrivick et al. 2019) is
inferred to be the most likely age of deposition. Age for late stage glacial deposits preserved on Beacon Point
11 kyr4 is inferred to be the youngest possible age of deposition.
                    Amplitude      Surface scarp    Wavelength      Rate mm/yr     Rate mm/yr      Rate mm/yr
      Feature
                      (m)           height (m)         (m)            (29 kyr)       (18 kyr)        (11 kyr)
 Fold 1                12               2.4             100             0.4             0.7            1.1
 Fold 2                10.4             1.6             130             0.4             0.6            0.9
 Fold 3                4.8              NA               65             0.2             0.3            0.4

We consider three processes here that might have produced the stress in the lake basin sediments to
cause folding.

           1.   Late glacial surge deforming sub and proglacial sediments. Evans (Evans 2015)
                documents deformation in lacustrine sequences on Beacon Point including anticlinal
                folding. This folding is attributed to glaciotectonic deformation. The mapped strike of
                folds in Figure 9 does not appear to support glaciotectonics as the glaciers advanced
                NW to SE into Roys Bay sub-orthogonal to the required principal stress. A recessional
                moraine has been mapped near the Korimako Crescent site in Figure 2 indicating a
                west to east direction of ice flow but this is interpreted as a local ice tongue (Evans
                2015).

           2.   Mountain range collapse and toe thrusting from Roys Peak/Mt Alpha range. There
                are major deep seated schist bedrock landslides in this area, including along the Mt
                Roy to Mt Alpha range (Mackey 2015). It is possible that long-term deep-seated slope
                failure causes toe compression that would result in deformation of weak lacustrine
                sediments. The orientation of principal stress is approximately correct for this
                mechanism, however it would require significant lateral displacement of the toe to
                induce the amount of folding observed.

24                            Geophysical investigation of potential active tectonic deformation in Lake Wanaka
3. Tectonic forces inducing compression through the area. This could imply a reverse
fault or faults at depth with associated folding over the fault tips. At the depth of
imaging in the boomer seismic data here we do not observe any offset reflectivity that
would indicate the presence of fault tips to shallow depths.
It is plausible that the folding of the Roys Bay basin sedimentary sequence is because it has been
subject to WSW-ENE compression as a result of reverse faulting at depth and that the observed
folding represents the continuation of the structure responsible for monoclinal folding beneath
Wanaka township. The vertical rate of folding calculated would suggest a relatively very high slip rate
for a fault in this tectonic domain (i.e., combining the deformation rate of the three folds together).
As this is at the northern end of the NW Cardrona Fault it is possible that the fault is dying out and
this may result in multiple fault splays and hence the multiple folds. This would be inconsistent with a
high slip rate however. The symmetrical nature of the folds is not consistent with folded sequences
over thrust faults observed in marine seismic data in other locations around New Zealand, where
folding generally has a strong asymmetry or vergence. Unfortunately without deeper imaging of the
sequence beneath the folds we cannot verify the nature of any tectonic structure.
5.2 Landslide deposits
MTDs are observed in two locations within Unit 5 sequences, and likely occur within Unit 3 but these
are indistinguishable from till and moraine material. Landslide source areas are widespread in the
hills surrounding the lake (Mountjoy, Wang et al.) and it is most likely that the MTDs relate to these
terrestrial source areas. Without high resolution lake bathymetry data it is very difficult to determine
source areas and extent of terrestrially derived landslide deposits that form a component of Unit 3.
The MTD mapped at the southern end of Roys Bay is buried beneath up to 10 m of younger sediment
and would not be visible in multibeam bathymetry.
Geophysical investigation of potential active tectonic deformation in Lake Wanaka 256 Recommendations
The presence of folding of lacustrine sediments at the southern end of Lake Wanaka supports the
continuation of surface deformation in a NNE direction. The data do not unequivocally demonstrate
the presence of a major fault however, and further work could be undertaken to identify if such a
structure occurs. This could include:
Mini-airgun seismic profiles over Roys Bay basin to image deeper into the lacustrine
sequences to identify bedrock offset. This is a difficult survey to complete in a lake
environment but is feasible with equipment held at NIWA. Concurrently further
boomer seismic profiles could be collected to increase the line density.
Multibeam bathymetric survey of Roys Bay. There is evidence that the observed
folding continues to the lake floor so identification of the surface trace of the fold(s)
would assist with confirming the strike of the structures and relating these to the lake
floor geomorphology. A bathymetric survey would determine the origin of the
lakefloor step observed in the south western corner of Roys Bay. This information
would also be very valuable for determining the nature and extent of any recent
landslide deposits (MTDs) in Unit 3.
Revisit the folded sequences mapped by Evans (Evans 2015) at Beacon Point and
Kirimoko Crescent in light of the results of this study to see if there is evidence to
confirm tectonic deformation as oppose to glaciotectonic processes.
We have identified several MTDs in the lake which may provide information on potential lake
tsunami hazard related to future hillslope failures. The most prominent MTD is in Roys Bay and is up
to 10 m thick and adjacent to Wanaka Township. There are also indications that larger MTDs occur
within Unit 3 although these are poorly imaged and cannot be correlated between seismic profiles. A
multibeam bathymetric survey would be very valuable to identify the distribution of MTDs and would
most likely enable the source area (expected to be range fronts adjacent to the lake) and deposit
volume to be calculated which would support numerical modelling of tsunami generation.
26 Geophysical investigation of potential active tectonic deformation in Lake Wanaka7 Acknowledgements We are grateful to Pete Notman who looked after the logistics of getting equipment to Wanaka and piloted the boat Rukuwai II during the survey, and to Will Quinn who prepared and set up the electronics and provided electronics support during the survey. Otago Regional Council reviewed a draft of this manuscript on 9 March 2020. Comments from Otago Regional Council and David Barrell (GNS Science) have been incorporated into the draft report for external review. Recommendations from an external peer review by GNS Science (Letter report CR 2020/70 LR) have been incorporated into the final version of this report. Geophysical investigation of potential active tectonic deformation in Lake Wanaka 27
8      Glossary of abbreviations and terms
 MTD               Mass Transport Deposit.
 LGM               Last Glacial Maximum.
 TWT               Two Way Travel time.

28                 Geophysical investigation of potential active tectonic deformation in Lake Wanaka
9       References
          Barrell, D.J.A. (2019) General distribution and characteristics of active faults and folds in the
             Queenstown Lakes and Central Otago Districts, Otago. Lower Hutt (NZ). GNS Science.
             Consultancy Report, 2018/207: 99.

          Evans, L. (2015) Sedimentological Investigation of Late Glacial (Otiran) Exposures along the
             Southern Margins of Lake Wanaka, South Island, New Zealand. Unpublished. Master of
             Philosophy thesis, The University of Queensland, Australia.

          Irwin, J., Ridgeway, N.M. (1976) Lake Wanaka Bathymetry. 1:55 440 N.Z. Oceanogr. Inst.
             Chart, Lake Series.

          Mackey, B. (2015) Seismic Hazard in Queenstown Lakes District. Otago Regional Council
            Report: 155.

          Mountjoy, J.J., Wang, X., Woelz, S., Fitzsimons, S., Howarth, J.D, Orpin, A.R., Power, W.
            (2019) Tsunami hazard from lacustrine mass wasting in Lake Tekapo, New Zealand.
            Geological Society, London, Special Publications, 477 No. 1: 413-426.

          Sutherland, J.L., Carrivick, J.L., Shulmeister, J., Quincey, D.J., James, W.H. (2019) Ice-contact
             proglacial lakes associated with the Last Glacial Maximum across the Southern Alps,
             New Zealand. Quaternary Science Reviews, 213: 67-92.

          Turnbull, I.M. (compiler) (2000) Geology of the Wakatipu area. Institute of Geological &
             Nuclear Sciences 1:250 000 geological map 18. Lower Hutt, New Zealand. Institute of
             Geological & Nuclear Sciences Ltd: 1 sheet + 72.

Geophysical investigation of potential active tectonic deformation in Lake Wanaka                        29
You can also read