Ground Deformation and Seismic Fault Model of the M6.4 Durres (Albania) Nov. 26, 2019 Earthquake, Based on GNSS/INSAR Observations - MDPI
←
→
Page content transcription
If your browser does not render page correctly, please read the page content below
geosciences
Article
Ground Deformation and Seismic Fault Model of the
M6.4 Durres (Albania) Nov. 26, 2019 Earthquake,
Based on GNSS/INSAR Observations
Athanassios Ganas 1, * , Panagiotis Elias 2 , Pierre Briole 3 , Flavio Cannavo 4 ,
Sotirios Valkaniotis 5 , Varvara Tsironi 1,6 and Eleni I. Partheniou 1
 1    National Observatory of Athens, Institute of Geodynamics, Lofos Nymfon, Thission, 11810 Athens, Greece;
      vtsironi@noa.gr (V.T.); hparth83@gmail.com (E.I.P.)
 2    National Observatory of Athens, Institute of Astronomy, Astrophysics, Space Applications and Remote
      Sensing, Vas. Pavlou and I. Metaxa, GR-15 236 Penteli, Greece; pelias@noa.gr
 3    Ecole Normale Supérieure, PSL research University, Laboratoire de Géologie-UMR CNRS 8538,
      75006 Paris, France; briole@ens.fr
 4    Istituto Nazionale di Geofisica e Vulcanologia-Osservatorio Etneo, Piazza Roma 2, 95125 Catania, Italy;
      flavio.cannavo@ingv.it
 5    Koronidos Str., 42131 Trikala, Greece; valkaniotis@yahoo.com
 6    Department of Geology, University of Patras, 26504 Rio, Greece
 *    Correspondence: aganas@noa.gr; Tel.: +30-210-3490186

 Received: 25 March 2020; Accepted: 25 May 2020; Published: 1 June 2020

 Abstract: We identify the source of the Mw = 6.4 earthquake that rocked north-central Albania on
 November 26, 2019 02:54 UTC. We use synthetic aperture radar interferograms tied to the time series
 of coordinates of two permanent Global Navigation Satellite System (GNSS) stations (DUR2 and TIR2).
 We model the source by inverting the displacement data. Assuming in our model a half-space elastic
 medium and uniform slip along a rectangular fault surface, we invert the 104 picked measurements
 on a couple of ascending and descending interferograms to calculate the parameters of the fault. All
 inversions made with different input parameters converge towards a stable and robust solution with
 root mean square (r.m.s.) residual of 5.4 mm, thus ~1/5 of a fringe. They reveal that the earthquake
 occurred deep in the crust on a low-angle fault (23◦ ) dipping towards east with a centroid at 16.5 km
 depth. The best-fitting length and width of the fault are 22 and 13 km, and the reverse slip, 0.55 m.
 The seismic moment deduced from our model agrees with those of the published seismic moment
 tensors. This geometry is compatible with a blind thrust fault that may root on the main basal thrust,
 i.e., along the thrust front that separates Adria–Apulia from Eurasia. It is notable that there is a
 123 ns yr−1 active shortening of the crust between the GNSS stations DUR2-TIR2 (equivalent to a
 shortening rate of 3.6 mm yr−1 ), and roughly in the east–west direction. Given this amount of strain
 the recurrence time of M6+ earthquakes along this fault should be of the order of 150 years.

 Keywords: deformation; earthquake; GNSS; InSAR; inversion; fault; Albania

1. Introduction
      The tectonics of western and northern Albania are characterised by on-going compression due to
collision between the Eurasian plate and the Adriatic block. Crustal deformation is characterised by
shortening directed in a NNE–SSW to E–W orientation ([1–6]; Figure 1a). Geological data indicate that
the region between Tirana and Durrës (Figure 1b) is the site of Neogene thrusting and folding [7–9].
The main thrusts are west-directed [10,11] while the thrust front is dextrally offset along two NE–SW
transfer zones, the “Scutari-Pec” [11,12] ~60 km north of Tirana (near the town of Lezhe; Figure 1b)

Geosciences 2020, 10, 210; doi:10.3390/geosciences10060210                   www.mdpi.com/journal/geosciences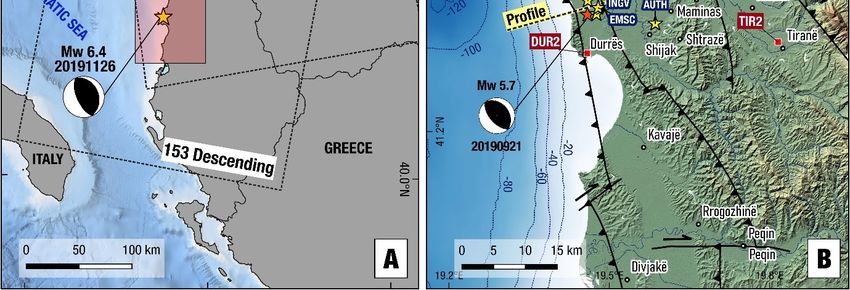
Geosciences 2020, 10, 210                                                                                          2 of 16

and the Elbasan-Vlora Transfer Zone [8] ~30 km south of Tirana. The inferred trace of the main basal
thrust of Eurasia over Apulia (that is part of the Dinaric–Hellenic orogen) passes through Durrës
with a general NNW–SSE orientation ([8]; their Figure 11b). Several west-verging reverse faults are
reported [8] on an E–W geological cross-section to offset Pliocene–Miocene sediments near Tirana with
significant cumulative displacements (1–2 km). The tectonic strain rate was estimated at 30–40 ns yr−1 of
contraction [5,6] for north-central Albania which is comparable to other active areas of the peri-Adriatic,
such as the south Apennines, as well as with areas in northern Greece such as Khalkidhiki [4].
     The most significant earthquake of the recent history was the April 15, 1979 Mw = 6.9 “Montenegro”
earthquake ([13]; Figure 1a) that occurred ~100 km towards the north of Durrës on a very low-angle (14◦ )
thrust fault dipping towards the northeast [1,14]. On November 16, 1982, a Mw = 5.6 thrust faulting
earthquake on a low angle fault (27◦ ) event occurred to the SW of Tirana [1]. The Mw = 6.4 November
26, 2019 02:54 UTC earthquake ruptured another reverse fault near the city of Durrës [9,15–18]; see
supplementary Figure S1 for a map with published moment tensors). Its centroid was determined in
the range 6–26 km (Table 1; locations and magnitudes from the sources 1–7). The magnitude of the
main aftershock (occurred on 06:08 UTC on the same day) was Mw = 5.4 according to the European
Mediterranean Seismological Centre (EMSC). By November 30th, the death toll reached 51, while
several thousands of residents were left homeless [16]. Many buildings in Durrës were levelled and
many more were dangerously damaged [19]. A horizontal peak ground acceleration (PGA) of 192 cm
s−2 was recorded by a strong motion station in Durrës [20].

      Table 1. Determination of the parametric data of the Nov. 26, 2019 02:54 UTC earthquake by
      various agencies.

                                                                               Depth
                    Institute    Longitude        Latitude         Mw                        Source
                                                                                (km)
                       GFZ          19.580         41.460          6.4            26             1
                      GCMT          19.578         41.390          6.4           24.1            2
                      USGS          19.526         41.514          6.4           19.5            3
                      CPPT          19.360         41.380          6.4            15             4
                      INGV          19.467         41.371          6.2            21             5
                      AUTH          19.578         41.359          6.1             6             6
                      EMSC          19.470         41.380          6.4            10             7
      Sources: 1. https://geofon.gfpotsdam.de/old/data/alerts/2019/gfz2019xdig/mt.txt, 2. https://www.globalcmt.org/
      CMTsearch.html, 3. https://earthquake.usgs.gov/earthquakes/eventpage/us70006d0m/moment-tensor, 4. https:
      //www.emsccsem.org/Earthquake/mtfull.php?id=807751andyear=2019;INFO, 5. http://cnt.rm.ingv.it/en/event/
      23487611/?tab=MeccanismoFocale#TDMTinfo, 6. http://geophysics.geo.auth.gr/ss/, 7. https://www.emsccsem.org/
      Earthquake/earthquake.php?id=807751.

     The November 26 Mw = 6.4 event of Durrës was preceded by a Mw = 5.7 that occurred on
September 21, 2019 14:04 UTC, with the same type of reverse-faulting kinematics ([21]; Figure 1b). This
foreshock caused limited liquefaction effects near Durrës and damage to buildings of Durrës, Tirana
and several settlements of the broader area [21]. The geometry and kinematics of both ruptures are
similar. The Mw = 6.4 event moment tensor solution (USGS; Table 2) shows a NNW–SSE fault plane
with strike, dip and rake angles 338◦ /27◦ /92◦ . The Mw = 5.7 event moment tensor solution (USGS)
shows a NNW-SSE fault plane with angles 323◦ /32◦ /93◦ .
     Here we use Sentinel-1 synthetic aperture radar interferograms, tied at the offsets measured at
two permanent Global Navigation Satellite System (GNSS) stations, to infer the parameters of the
seismic fault. Our best-fitting model is a low-angle reverse fault dipping at 23◦ towards the northeast.
The centroid of this fault is located at a depth of 16.5 km on a structure that could be a decollement
at the base of the brittle crust. This finding contributes to the understanding of the present tectonic
processes in the Apulia–Eurasia collision zone.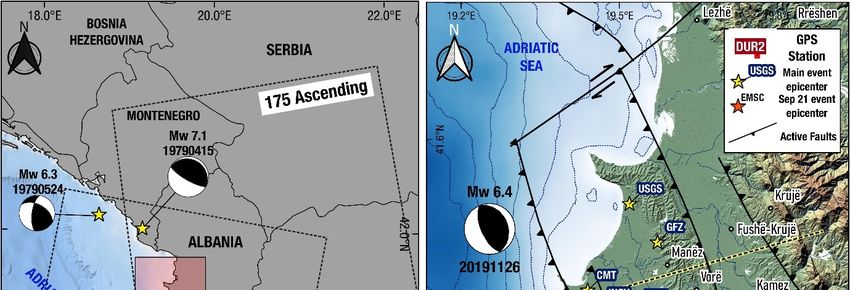
Geosciences 2020, 10, 210                                                                                                            3 of 16
       Geosciences 2020, 10, x FOR PEER REVIEW                                                                             3 of 17

            Figure
       Figure       1. (A)
                1. (A)  Map Mapof of thesouth
                                   the   southAdriatic
                                                 Adriatic Sea—Albania
                                                          Sea—Albania showing
                                                                           showing extent  of Sentinel-1
                                                                                      extent              satellite
                                                                                               of Sentinel-1        frames.
                                                                                                                satellite  frames.
            Adriatic  Sea   bathymetry    data  from  https://www.emodnet-bathymetry.eu/.
       Adriatic Sea bathymetry data from https://www.emodnet-bathymetry.eu/. Beachballs indicate  Beachballs  indicate  the the
       focalfocal mechanisms
              mechanisms      of of recentstrong,
                                 recent    strong,shallow
                                                   shallow earthquakes
                                                             earthquakes[14];  USGS,
                                                                            [14];     Table
                                                                                  USGS,      2; compressional
                                                                                          Table                  quadrants
                                                                                                  2; compressional     quadrants
            are shaded in black). Shaded rectangle indicates study area shown in 1b. (B) Relief map of the Durres–
       are shaded in black). Shaded rectangle indicates study area shown in 1b. (B) Relief map of the
            Tirana area in central-western Albania showing main geological structures (thrust faults; ticks on the
       Durres–Tirana area in central-western Albania showing main geological structures (thrust faults; ticks
            upthrown side), epicentre (yellow stars) determined by various agencies and Global Navigation
       on the upthrown side), epicentre (yellow stars) determined by various agencies and Global Navigation
            Satellite System (GNSS) stations that recorded the earthquake. Beachball indicates the United States
       Satellite  System
            Geological      (GNSS)
                          Survey      stations
                                  (USGS)    focalthat recorded
                                                  mechanism   of the  earthquake.
                                                                 the Nov.   26, 2019 Beachball
                                                                                     earthquake.indicates    the United
                                                                                                    Red star indicates  theStates
       Geological
            European Mediterranean Seismological Centre (EMSC) epicentre of the September 21, 2019 Mw = 5.7 the
                     Survey    (USGS)     focal  mechanism     of the  Nov.   26, 2019 earthquake.      Red  star   indicates
       European     Mediterranean
            earthquake                  Seismological
                          (Focal mechanism               Centre
                                               from USGS).   Fault(EMSC)
                                                                   lines areepicentre
                                                                             from [22].of the September
                                                                                        Yellow               21,the
                                                                                                 line indicates   2019  Mw = 5.7
                                                                                                                     profile
       earthquake
            in Figure(Focal
                       6.     mechanism from USGS). Fault lines are from [22]. Yellow line indicates the profile in
       Figure 6.
            Table 1. Determination of the parametric data of the Nov. 26, 2019 02:54 UTC earthquake by various
                   Table 2. Focal mechanism data for the 26 November 2019 Mw = 6.4 earthquake.
            agencies.

                                 M0            Depth         Strike     Dip      Rake
                                                                                 Depth      Strike       Dip      Rake
     Institute   Mw                Institute     Longitude    Latitude ◦Mw                 Source                             Source
                              (N   m−1 )         (km)         (◦ )     ( )         (◦ )
                                                                                  (km)
                                                                                              ◦( )       (◦ )       (◦ )
      GFZ         6.4        5.20 × 10¹⁸           26         151        726.4     89         335         18        94           1
                                    GFZ            19.580      41.460              26          1
     GCMT         6.4        5.65 × 10¹⁸          24.1        145        68        79         351         25       114           2
                                   GCMT            19.578      41.390      6.4    24.1         2
     USGS         6.4        4.56 × 10¹⁸          19.5        156        63        89         338         27        92           3
     CPPT         6.4        5.08 ×USGS
                                    1018           19.526
                                                   15          41.514
                                                              168        696.4    19.5
                                                                                  104          3
                                                                                              312         25        57           4
     INGV         6.2               1018
                             2.38 × CPPT           21
                                                   19.360     134
                                                               41.380    826.4     84
                                                                                   15         350
                                                                                               4          10       126           5
     AUTH         6.1        1.34 × 10¹⁸            6         150        49       109         303         44        69           6
                                  INGV         19.467     41.371     6.2    21         5
      Sources: 1. https://geofon.gfz-potsdam.de/old/data/alerts/2019/gfz2019xdig/mt.txt, 2. https://www.globalcmt.org/
                                  AUTH         19.578     41.359     6.1     6         6
      CMTsearch.html, 3. https://earthquake.usgs.gov/earthquakes/eventpage/us70006d0m/moment-tensor,             4. https:
      //www.emsc-csem.org/Earthquake/mtfull.php?id=807751andyear=2019;INFO,
                                  EMSC         19.470     41.380     6.4    10        5.7 http://cnt.rm.ingv.it/en/event/
      23487611/?tab=MeccanismoFocale#TDMTinfo, 6. http://geophysics.geo.auth.gr/ss/.
           Sources:        1.      https://geofon.gfpotsdam.de/old/data/alerts/2019/gfz2019xdig/mt.txt,          2.
           https://www.globalcmt.org/CMTsearch.html,                                                             3.
2.   Data and   Methods
           https://earthquake.usgs.gov/earthquakes/eventpage/us70006d0m/moment-tensor,                           4.
           https://www.emsccsem.org/Earthquake/mtfull.php?id=807751andyear=2019;INFO,                            5.
2.1. InSAR Data Processing
     We used synthetic aperture radar interferometry (InSAR) to capture the deformation produced
by the Durrës earthquake (Figure 2). In the Mediterranean, InSAR is systematically used to map the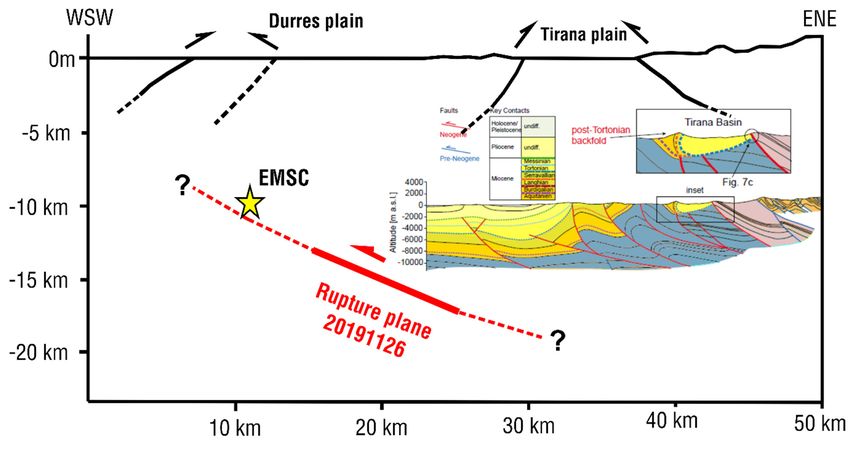
Geosciences 2020, 10, 210                                                                    4 of 16

ground deformation produced by large earthquakes after removing the signal from the topography
(e.g., [23–31]) and minimising the tropospheric noise.
      Geosciences 2020, 10, x FOR PEER REVIEW                                      5 of 17

                                                     a
                                                Figure 2. Cont.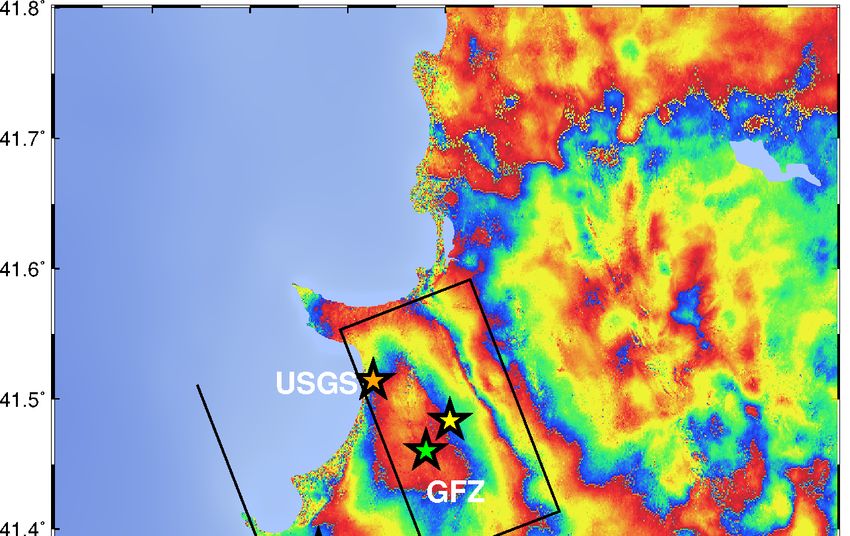
Geosciences 2020, 10, 210 5 of 16
Geosciences 2020, 10, x FOR PEER REVIEW 6 of 17
b
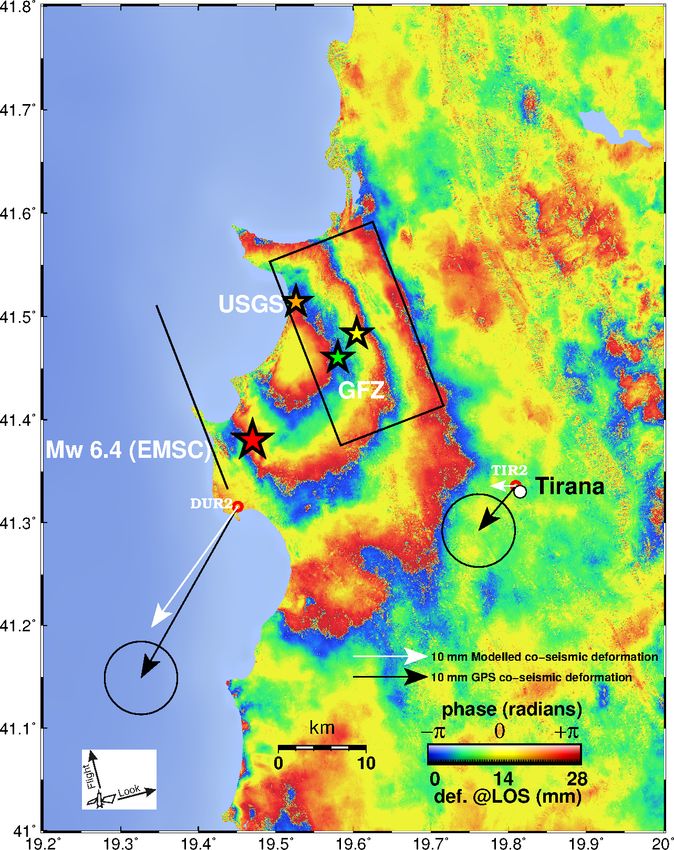
FigureFigure
2. 2.(a).(a). Sentinel-1
Sentinel-1wrapped
wrapped interferogram descending
interferogram track 153 (acquisition
descending track 153 dates 20191125- dates
(acquisition
20191125–20191201). Yellow star indicates the location of the geodetic centroid (this rectangle
20191201). Yellow star indicates the location of the geodetic centroid (this study). Black study). Black
shows the surface projection of the seismic fault. Solid black line indicates fault plane intersection to
rectangle shows the surface projection of the seismic fault. Solid black line indicates fault plane
the Earth’s surface. The red star indicates the earthquake epicentre (EMSC location), orange and green
intersection to the Earth’s surface. The red star indicates the earthquake epicentre (EMSC location),
stars USGS and German Research Centre for Geosciences (GFZ) epicentres, respectively. The vector
orangepairs
and represent
green stars USGS and German Research Centre for Geosciences (GFZ) epicentres, respectively.
the GPS measured (black) and modelled (white) co-seismic horizontal displacements
The vector pairs DUR2
at stations represent
and the
TIR2GPS measured
respectively (black)
(see Table and
3 formodelled (white)
values). (b). co-seismic
Sentinel horizontal
1A wrapped
displacements at stations
interferogram DUR2
ascending and
track 175TIR2 respectively
(acquisition dates(see Table 3and
20,191,120 for 20,191,126
values). (b). Sentinel
16:32 1A wrapped
UTC). Yellow
interferogram ascending
star indicates track of
the location 175the
(acquisition dates 20,191,120
geodetic centroid (this study).and 20,191,126
Black rectangle16:32
showsUTC). Yellow star
the surface
indicates the location of the geodetic centroid (this study). Black rectangle shows the surface projection
of the seismic fault. Solid black line indicates fault plane intersection to the Earth’s surface. The red star
indicates the earthquake epicentre (EMSC location). The vector pairs represent the Global Positioning
System (GPS) measured (black) and modelled (white) coseismic horizontal displacements at stations
DUR2 and TIR2 respectively (see Table 3).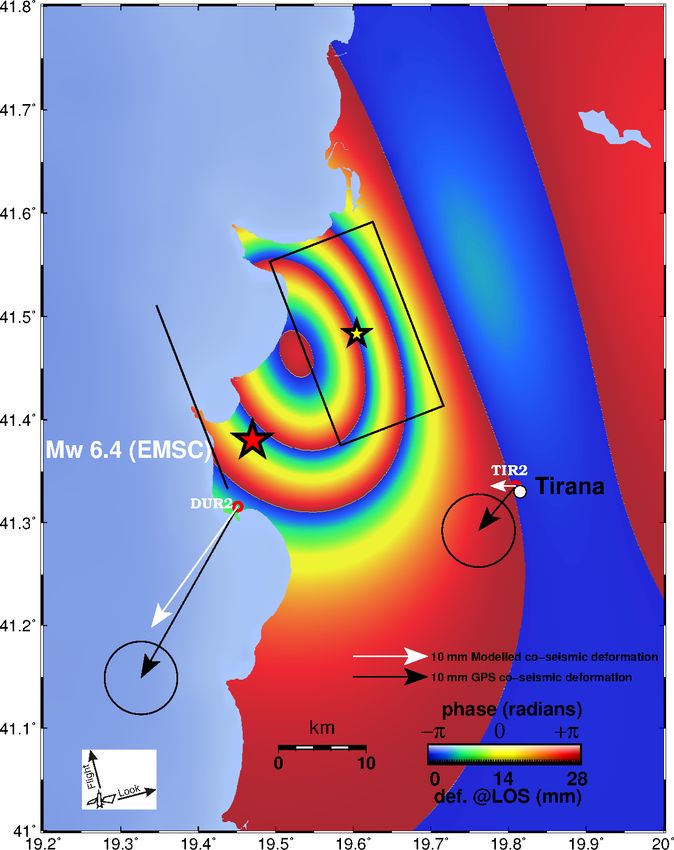
Geosciences 2020, 10, 210                                                                          6 of 16

      Table 3. Co-seismic displacements produced by the September 21, 2019 and November 26, 2019
      earthquakes at the AlbPOS GNSS stations DUR2 and TIR2 (Figure 1b).

                            Mw = 5.7, September 21, 2019            Mw = 6.4, November 26, 2019
       Site
                      East (mm)     North (mm)      Up (mm)   East (mm)     North (mm)      Up (mm)
     DUR2               −5 ± 4         −3 ± 4        10 ± 8    −13 ± 2        −23 ± 2         13 ± 4
     TIR2               −4 ± 4         −4 ± 4         7±8      −5 ± 2         −6 ± 2          0±4

     We processed Sentinel-1 Interferometric Wide (IW) acquisitions from ascending and descending
orbits, tracks 175 and 153, respectively. We used the open-source SNAP v7.0 ESA software [32],
implemented in an offline version of Automated Interferogram Processing Station (AIPS, http:
//aips.space.noa.gr) and the online facilities of the GEP-TEP (Geohazards Exploitation Platform
-Thematic Exploitation Platform; http://geohazards-tep.eu). For the ascending track we use the data
acquired on November 14 and 26 (16:32 UTC), and for the descending track those acquired on November
25 and December 1, 2019.
     The two interferograms provided a measurement of the ground motion along two opposite
line of sights (LOS; Figure 2a,b). The digital elevation model (DEM) used for the processing is
the Shuttle Radar Topography Mission (SRTM) 1 Arc-Second Global ([33]; Digital Object Identifier
number:/10.5066/F7PR7TFT). We enhanced the signal to noise ratio by applying the adaptive power
spectrum filter of [34] with a window size of 3, Fast Fourier Transform (FFT) size of 64 and a coherence
threshold of 0.2.
     The existence and amplitude of tropospheric disturbances in InSAR can be partly assessed by
looking at single interferograms. This is because the tropospheric effect (signal delay) can be separated
in two components: one correlated with the topography and the other not correlated. In the case of
our interferograms (Figure 2) we could find no correlation with topography. The estimated amplitude
of the tropospheric noise at short spatial wavelengths (0.5–5 km) is low, below a quarter of a fringe.
There are three fringes well visible in the ascending interferogram and two in the descending one,
aligned in an area of ~40 km elongated NW–SE north of Durrës, mostly on-shore along the coastal
plain (Figures 1 and 2). The maximum ascending LOS change is ~8.4 cm towards the satellite.
     Four moderate magnitude aftershocks (up to M = 5.4; EMSC magnitudes https://www.emsc-csem.
org/Earthquake/europe/M5/) occurred in the 36-h period following the mainshock; they did not affect
the deformation signal as all those events occurred relatively deep (the GFZ moment tensor solutions
for two aftershocks indicate depths comparable to that of the mainshock; ~26 km) and with moderate
magnitudes. We generated additional interferograms for the postseismic period (up to December 14,
2019), in order to clarify any possible impact on the estimated deformation. However, no postseismic
deformation was detected (see supplementary Figure S2). We also processed Sentinel 1 interferometric
pairs for the foreshock of September 21, 2019 (Mw = 5.7) to investigate the source geometry and depth,
but no ground displacements were detected either (see supplementary Figure S3).

2.2. GNSS Data Processing
      We analysed the GNSS data of the stations DUR2 (Durrës, 19.4510◦ E, 41.3156◦ N) and TIR2,
(Tirana, 19.8095◦ E, 41.3357◦ N) both belonging to the Albanian Positioning Service (AlbPOS) geodetic
network (http://www.geo/edu.al/gnss/albpos; see Figure 1b for locations). The processing was made
with the Precise Point Positioning (PPP) strategy [35] by means of the GIPSY/OASIS II software (ver.
6.4) developed by the Jet Propulsion Laboratory (JPL; http://gipsy-oasis.jpl.nasa.gov; [36]). We used the
JPL final orbits (flinnR) and clocks, absolute antenna calibration, random walk troposphere estimation,
and the FES2004 ocean loading model. We calculated the static offsets for both September 21, 2019 and
November 26, 2019 events (Table 3; Figure 3, vertical lines indicate timing of earthquakes). The offsets
indicate mm/cm size motion towards west, south and upwards (i.e., uplift), for both events. Regarding
the large aftershock on Nov. 26, 2019 06:08:25 UTC (M = 5.4), we could not see any evidence of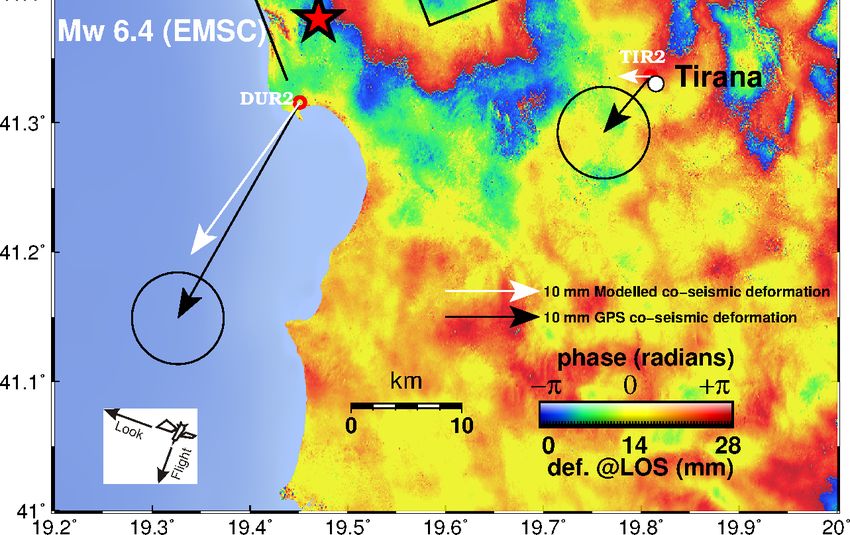
Geosciences 2020, 10, 210                                                                                                           7 of 16

this aftershock in the GNSS time series. Furthermore, the GNSS time series show no evidence of
fast postseismic motion in the days following the mainshock (Figure S4). This indicates that the
interferograms (Figure 2) correspond to the coseismic displacements only and are not biased by
postseismic
     Geosciences motion
                 2020, 10, x signals.
                             FOR PEER REVIEW                                         8 of 17

      Figure   3. GNSS
           Figure   3. GNSS time  series
                               time  series(Up,
                                            (Up,North,
                                                  North, East   componentfrom
                                                          East component      fromtoptop  to bottom
                                                                                       to bottom       series)
                                                                                                  series) at theatpermanent
                                                                                                                   the permanent
           stations
      stations       of Durrës
                 of Durrës       (DUR2;top
                              (DUR2;       toppanel)
                                               panel) and
                                                       and Tirana
                                                            Tirana(TIR2;
                                                                    (TIR2;bottom
                                                                            bottom panel). TheThe
                                                                                      panel).   figure  shows
                                                                                                     figure    the residuals
                                                                                                            shows     the residuals
      afterafter  removing
             removing       thethe  tectonicvelocities
                                 tectonic      velocities that
                                                          that are
                                                                are also
                                                                     also estimated.
                                                                           estimated.TheThe offsets  produced
                                                                                                offsets  producedby the bytwo
                                                                                                                            the two
           earthquakes
      earthquakes          of September
                       of September     21,21, 2019and
                                             2019   andNovember
                                                         November 26,26, 2019
                                                                         2019are
                                                                               arevisible
                                                                                   visibleand
                                                                                            andcan
                                                                                                 canbebe
                                                                                                       measured
                                                                                                          measured (see(see
                                                                                                                        TableTable 3).
           3). Vertical lines indicate timing of earthquakes.
      Vertical lines indicate timing of earthquakes.
     3. Inversion of the Geodetic Data
Geosciences 2020, 10, 210 8 of 16
The time series of coordinates are plotted in Figure 3 (a zoom on the week before and after the
mainshock is presented in supplementary Figure S4). The long-term velocities, in the reference frame
ITRF2014, are 23.6 ± 0.3 mm yr−1 in east and 16.3 ± 0.3 mm yr−1 in north at Durrës and 20.0 ± 0.3
mm yr−1 and 15.8 ± 0.3 mm yr−1 at Tirana. Therefore, the net motion of DUR2, assuming TIR2 fix,
is 3.6 ± 0.5 mm yr−1 of shortening in the azimuth N80◦ E. It is notable that there is a 123 ns yr−1 active
shortening of the crust between the two GNSS stations located at 30 km one to the other, and roughly
in the east-west direction. This 1-D estimate of tectonic strain is about 2.4 larger than the 2-D estimates
from regional studies (e.g., 30–40 ns yr−1 , [5,6]). In addition, both GNSS stations exhibit long-term
subsidence of −8.7 and −6.5 mm yr−1 respectively (Figure 3), presumably due mostly to anthropogenic
reasons. The displacements and uncertainties retrieved from the analysis of the time series are reported
in Table 3.
The LOS-projected (ascending and descending) motions measured at DUR2 for the November
26, 2019 event are used to give an absolute reference to the ascending and descending interferograms
shown before (Figure 2). This absolute tie to GNSS is crucial for the inversion made in the next section.
The LOS unit vector [East North Up] used is [−0.52 −0.12 0.84] and [0.63 −0.14 0.77], for the ascending
and descending track, respectively.
3. Inversion of the Geodetic Data
Assuming a half-space elastic model with uniform slip along a rectangular fault surface, the source
of the ground deformation was inverted using the InSAR data and the code inverse6 [37]. We fed the
inversion with 104 LOS measurements that were picked manually on the interferograms (Figure 2),
52 points on the ascending and 32 for descending track.
Taking various initial conditions compatible with the fault planes inferred from the seismological
centres, we performed 6500 inversions. Those inversions define a stable and robust solution with root
mean square (r.m.s.) residual of 5.4 mm thus ~1/5 of a fringe. The parameters of the best-fitting solution
are in the Table 4. Table 4 also contains the uncertainties on the parameters of our final best-fitting fault
model. The inversion result for depth to top-fault vs. fault length is shown in Figure 4 which is tailored
to appreciate visually the range of values (and thus uncertainties) of the parameter couple: top-fault
depth-fault length. All inversion results are included in supplementary Figure S5. In Figure S6 it is
shown the fit only at the picked points of the modelled and measured displacements in the LOS, along
with the r.m.s. misfit, which is 3.3 mm and 8.1 mm for the ascending and descending track respectively.
Table 4. Parameters of the seismic fault as determined by linear inversion of geodetic data. Centroid
refers to centre of the fault plane (yellow star in Figures 2 and 5).
Centroid Angles Fault Slip
Long. Lat Depth Strike Dip Length Width
◦ ◦ km ◦ ◦ km km m
19.604 ± 0.015 41.483 ± 0.01 16.5 ± 2 340 ± 5 23 ± 5 22 ± 2 13± 2 0.55 ± 0.1Geosciences 2020, 10, 210 9 of 16
Geosciences 2020, 10, x FOR PEER REVIEW 10 of 17
Figure
Figure 4. Diagram
4. Diagram ofofdepth
depth(of
(ofthe
the top-edge
top-edge ofofthe
thefault; Y-axis)
fault; versus
Y-axis) faultfault
versus length (X-axis),
length with the
(X-axis), with the
values of root mean square (r.m.s.) error in colour of the inversions output (see vertical scaleThe
values of root mean square (r.m.s.) error in colour of the inversions output (see vertical scale bar). bar). The
inversion series is converging to the lowest r.m.s. at a depth of 14 km and length of 22 km.
inversion series is converging to the lowest r.m.s. at a depth of 14 km and length of 22 km.
Our modelling demonstrates that the earthquake occurred deep in the crust on a low-angle reverse
fault (23◦ ) dipping towards east with centroid at 16.5 km depth. The best-fitting length and width
of the fault are 22 and 13 km and the reverse slip 0.55 m (Figure 5). Assuming a medium rigidity
of 3.3 × 10¹⁰ Pa, the seismic moment deduced from our model, 5.19 × 10¹⁸ N m−1 , is closer to GFZ’s
published seismic moment tensor (Table 2). The modelling also indicates that the top of the fault plane
is buried at a depth of ~14 km, so there was no rupture in the shallow crust above that depth.
The geodetic fault-model is in agreement with published moment tensor solutions showing
a NNW–SSE fault plane (see Table 2). The geodetic centroid is located ~15 km to the NE of the
EMSC epicentre but a few km away from either the USGS or the GFZ epicentre (Figure 1b; Figure 2).
The inferred fault geometry (see Figure 5 for a surface projection) is compatible with a blind thrust
fault rooting on the main basal thrust front that separates Adria–Apulia from Eurasia.Geosciences 2020, 10, 210 10 of 16
Geosciences 2020, 10, x FOR PEER REVIEW 11 of 17
Figure5.5.Synthetic
Figure Synthetic interferogram
interferogram ofof the
the ascending
ascendingtrack
track175
175using
usingthethe
fault parameters
fault parametersof Table 4. 4.
of Table
Yellow star indicates the geodetic centroid. Black rectangle shows the surface projection of the
Yellow star indicates the geodetic centroid. Black rectangle shows the surface projection of the seismic seismic
fault. Solid
fault. Solid black
black line
lineindicates
indicatesprojected fault
projected plane
fault intersection
plane (fault(fault
intersection trace) trace)
at Earth’s surface.surface.
at Earth’s The
red star indicates the earthquake epicentre (EMSC location). The vector pairs represent the GPS
The red star indicates the earthquake epicentre (EMSC location). The vector pairs represent the GPS
measured (black) and modelled (white) coseismic horizontal displacements at stations DUR2 and
measured (black) and modelled (white) coseismic horizontal displacements at stations DUR2 and
TIR2 respectively.
TIR2 respectively.
4. Discussion
4.1. Geodetic Determination of Earthquake ParametersGeosciences 2020, 10, 210 11 of 16
4. Discussion
4.1. Geodetic Determination of Earthquake Parameters
Our modelling shows that the November 26, 2019 EMSC epicentre must be shifted by 15 km to
match the geodetic data (see Figures 1b and 5 for locations; the same distance holds for epicentres
determined by CMT and INGV; see Figure 1b). On the other hand, the USGS epicentre is located
about 7 km NW of the geodetic centroid and the GFZ epicentre about 3 km to the SW, respectively.
We note that such shifts between the geodetic solution and the EMSC solution (among others) has been
observed for several large earthquakes that occurred along the eastern Ionian coast in the recent years,
i.e., the Cephalonia doublet 2014 [26], Lefkada 2015 [30] and Zakynthos 2018 [38]. This systematic
shift might be primarily due to the velocity model used for the Ionian Sea and Adriatic area by some
seismological agencies.
Like in all elastic models, we cannot solve independently all parameters of the modelled fault.
In particular, there is a strong trade-off between fault width and amplitude of slip, and between fault
azimuth and rake. In our case fixing the rake at 90◦ (based on the seismic moment tensors; Table 2)
has a direct impact on the azimuth of the modelled fault. The fact that our modelled azimuth is
consistent with the azimuth of the geological structures (Figure 1b; Figure 6) supports the reliability of
our approach.
Geosciences 2020, 10, x FOR PEER REVIEW 13 of 17
Figure 6. Schematic cross section across the strike of the seismic fault of the November 26, 2019
Figure 6. Schematic cross section across the strike of the seismic fault of the November 26, 2019
earthquake. The inferred fault plane is indicated by the red line (half arrow denotes motion of the
earthquake. The inferred fault plane is indicated by the red line (half arrow denotes motion of the
hanging wall of the fault). Inset profile shows geological structure [8]. No vertical exaggeration.
hanging wall of the fault). Inset profile shows geological structure [8]. No vertical exaggeration. The
The trace of the section is noted in Figure 1b.
trace of the section is noted in Figure 1b.
Our fault model also indicates that the 8 ± 2 km depth proposed by [17] for the hypocentre is not
4.3. GNSS Magnitude of Durres Earthquake
supported by the geodetic data.
Weseries
A emphasize the useful
of studies [40–43]role of station
produced DUR2
GNSS and, more generally,
peak-ground the importance
displacement of the
(PGD) scaling presence
laws and
proposed algorithms
of GNSS stations withfor their real-time
a sufficient densityuse
to as ancontrol
give unsaturated and reliable
and absolute scale estimator of earthquake
to InSAR data. In the case
magnitude.
of the Durrës One of them [42]
earthquake, onemodelled the magnitude
or two more permanentscaling properties
stations of peak
to the north andground horizontal
east of the geodetic
displacements
centroid would(PGD and PGD-S)
have provided greatfor strong
added earthquake
value events
for the near usingdetermination
real-time L1-norm minimisation
of the fault
regression. In this
location. GNSS andstudy
InSAR weare
use only horizontal
valuable sources ofoffsets at the two
displacement GNSS
data. Thestations (DUR2now
real challenge andisTIR2;
to use
Figure 3, Figure
them jointly moreS4)
andtomore
calculate the GNSS
efficiently magnitude of this earthquake. We used the coseismic
and quickly.
offsets of Table 3 and the geodetic centroid location calculated by the inversion model (41.483° N,
19.604° E, 16.5 km depth; Table 4). The PGD formulas are defined as [42]:
PGD = (|AN-S| + |AE-W|)/2 (1)
PGD-S = (AN-S2 + AE-W2)1/2 (2)
Therefore, PGD is the mean value of the absolute horizontal displacement in two orthogonal
directions (i.e., E-W, N-S; in cm), while PGD-S is the resultant horizontal displacement (in cm).
Plugging the relevant values to the PGD scaling laws (empirical equations (3) and (4) below)Geosciences 2020, 10, 210 12 of 16
4.2. Tectonic Strain and Earthquake Recurrence
With GNSS data, we were able to estimate crustal shortening between Durrës and Tirana.
This shortening amounts to 3.6 ± 0.5 mm yr−1 of 1-D strain in the azimuth N80◦ E. Such a large
shortening rate in a small band of crust (about 30 km) and if the decollement at depth (active in that
event) represents the main boundary of the blocks (i.e., the basal thrust), then we may be able to
estimate earthquake recurrence along the seismic fault of November 26, 2019. Assuming a uniform
slip of 0.55 ± 0.1 m that is released periodically (assuming full locking and uniform loading rates), then
the recurrence time of M6+ earthquakes would be on the order of 152 ± 10 years (i.e., the amount of
co-seismic slip of the event divided by the shortening rate). Further, assuming that shortening strain in
the region between Durrës and Tirana is accommodated by two reverse faults (i.e., the 2019 seismic
fault and its probable continuation toward south) then the mean recurrence time of a M6+ event would
be in the range 70–80 years. We note that a strong M = 6.1 earthquake is reported on December 12,
1926 ([39]; 93 years ago) for the region of Durres with an elliptical isoseismal pattern (long-axis oriented
NW–SE).
Using the fault model parameters (Table 4) we drew a cross section (1:1) along the direction
ENE–WSW passing through Durrës and the surface projection of the east-dipping seismic fault. We then
positioned the inferred seismic fault with its top near the depth of 14 km and its bottom near the depth
of 18 km. We also projected the EMSC epicentre to show its position with respect to the inferred fault
plane. The geometry of the inferred fault and its kinematics (reverse-slip) match the tectonic style
for the region Durrës—Tirana ([8]; see inset geological profiles in Figure 6). The geological structure
is interpreted as a result of Neogene thrusting and folding with west-directed shear indicators [8].
N-S to NW-SE oriented synclines, anticlines and thrust faults have been mapped in central Albania
between Durrës and Tirana [7] and published cross sections (Figure 6 inset) depict series of E-dipping
late Neogene thrusts at depths down to 10 km. It is therefore reasonable to suggest that the November
26, 2019 earthquake ruptured a basement reverse fault along the Neogene thrust front.
4.3. GNSS Magnitude of Durres Earthquake
A series of studies [40–43] produced GNSS peak-ground displacement (PGD) scaling laws and
proposed algorithms for their real-time use as an unsaturated and reliable estimator of earthquake
magnitude. One of them [42] modelled the magnitude scaling properties of peak ground horizontal
displacements (PGD and PGD-S) for strong earthquake events using L1-norm minimisation regression.
In this study we use only horizontal offsets at the two GNSS stations (DUR2 and TIR2; Figure 3, Figure
S4) to calculate the GNSS magnitude of this earthquake. We used the coseismic offsets of Table 3 and
the geodetic centroid location calculated by the inversion model (41.483◦ N, 19.604◦ E, 16.5 km depth;
Table 4). The PGD formulas are defined as [42]:
PGD = (|AN-S | + |AE-W |)/2 (1)
PGD-S = (AN-S 2 + AE-W 2 )1/2 (2)
Therefore, PGD is the mean value of the absolute horizontal displacement in two orthogonal
directions (i.e., E-W, N-S; in cm), while PGD-S is the resultant horizontal displacement (in cm).
Plugging the relevant values to the PGD scaling laws (empirical Equations (3) and (4) below) that
were proposed by [42] for the Aegean region, then we obtain a moment magnitude Mw (PGD) = 6.44
and Mw (PGD-S) = 6.42 assuming a hypocentral distance (R) of 27.957 km to the GNSS station DUR2
(Table 5).
Mw PGD = [LOG(PGD) + 8.2849]/(1.6810 − 0.2453 × LOG(R)) (3)
Mw PGD-S = [LOG(PGD-S) + 8.0839]/(1.6793 − 0.2447 × LOG(R)) (4)Geosciences 2020, 10, 210 13 of 16
Table 5. Estimation of earthquake magnitude for the 2019 Durrës earthquake using the GNSS static
offset data. PGD/PGD-S is in cm, R is in km. The magnitudes were calculated using the empirical
relationships [42] of Equation (3) (PGD) and Equation (4) (PGD-S). R is the source (centroid) to
station distance.
PGD R PGD-S Mw PGD Mw PGD-S Station
1.80 27.957 2.64 6.44 6.42 DUR2
0.55 28.883 0.78 6.07 6.03 TIR2
For station DUR2 the magnitude difference (∆M) or Mw (seismology)—Mw (GNSS) is less than
or equal to 0.04 units using the PGD/PGD-S approach [40–43]. There is a deviation observed in the
case of station TIR2, where the estimated magnitude from GNSS is 6.07 (Table 5; PGD relationship) or
6.03 (PGD-S relationship), i.e., it is underestimated by 0.33–0.37 units of magnitude. The reason for
this underestimation may be (a) the azimuthal distribution of the two GNSS stations with respect to
the direction of seismic slip (assuming a rake of 90◦ the slip vector is directed towards N250◦ E, i.e.,
towards the west or the city of Durrës; Figure 5) and/or (b) the uneven distribution of the thick pile of
sedimentary rocks in central Albania (including several km of Triassic evaporites) that may differently
attenuate seismic energy at both stations.
5. Conclusions
1. We identify the main source of the Mw = 6.4 earthquake that rocked north-central Albania
on November 26, 2019 to be located within the frontal area of the basal thrust of the
Dinaric–Hellenic orogen.
2. We modelled the seismic fault by combining the ascending and descending Sentinel observations.
Mixing ascending and descending orbits provides a more robust solution. We find that we can
model the overall fringe pattern by reverse slip on an east-dipping fault. The fault plane is a
low-angle thrust fault (22 by 13 km) that dips towards the east (23◦ ).
3. The inversion of geodetic data suggests that the upper edge of the fault is at a depth of 14 km,
well constrained by the modelling of the interferograms.
4. Geodetic data GNSS and InSAR (Figure 2) show ground motion to the southwest and surface
uplift in agreement with moment tensor solutions from seismology.
5. The epicentre published by EMSC is located 15 km southwest of the one deduced from geodesy,
this might be due to insufficient inaccuracy of the velocity model of the crust beneath the Adriatic.
6. It is notable that there is a 123 ns yr−1 active shortening of the crust between the GNSS stations
DUR2-TIR2 (equivalent to a shortening rate of 3.6 mm yr−1 ), and roughly in the east-west direction.
7. Given this amount of strain the recurrence time of M6+ earthquakes along this fault should be of
the order of 150 years.
8. The GNSS-derived magnitude in station DUR2 matches the moment magnitude from seismology
to within 0.04 units.
Supplementary Materials: The following are available online at http://www.mdpi.com/2076-3263/10/6/210/s1,
Figure S1: EMSC map showing focal mechanisms published by various agencies (last accessed on May 11, 2020),
Figure S2: Sentinel 1 wrapped interferogram tracks 153 (descending) and 175 (ascending) of the Durrës area
showing no ground deformation during the postseismic period up to December 14, 2019, Figure S3: Sentinel
1 wrapped interferogram tracks 153 (descending) & 175 (ascending) of the Durrës area showing no ground
deformation due to the Sept. 21, 2019 (Mw = 5.7) foreshock, Figure S4: Coseismic offsets at two GNSS stations
(DUR2 & TIR2) at the East, North, Up components, respectively. Red dots represent the daily station position at
each component. The station coordinates are approximately at: DUR2 (Lat. 41.3156◦ –Lon. 19.451◦ ) and TIR2 (Lat.
41.3357◦ –Lon 19.8095◦ ). Station locations are shown in Figure 1, Figure S5: Graphs showing inversion results
for several fault parameters: (A) top-fault depth (km) (B) slip (m)—for reverse (C) length (km) and (D) width
(km). Y-axis shows the r.m.s. misfit, Figure S6: Graphs showing fit of the modelling of the line-of-sight (LOS)
displacements picked on the observed fringes, (a) for ascending track 175 and (b) for descending track 153.Geosciences 2020, 10, 210 14 of 16
Author Contributions: Conceptualization: A.G. and P.B., Methodology: A.G., P.E. and P.B., Software: P.E.,
P.B., F.C. and V.T., Formal analysis: P.E. and P.B., Investigation: A.G. and S.V., Data curation: V.T. and E.I.P.,
Writing—original draft preparation: all authors, Writing—review and editing: A.G. and P.B., Visualization: S.V.
and P.E., Supervision: A.G., Funding acquisition: A.G. All authors have read and agreed to the published version
of the manuscript.
Funding: This research was supported by “HELPOS-Hellenic Plate Observing System” (MIS 5002697) which is
funded by the Operational Programme “Competitiveness, Entrepreneurship and Innovation” (NSRF 2014-2020)
and co-financed by Greece and the European Union (European Regional Development Fund).
Acknowledgments: We thank two anonymous reviewers for constructive reviews and Efthimios Lekkas, Mark
Handy, Christian Beck, Efthimios Sokos, and Nikos Theodoulidis for discussions. We thank ESA, Geohazards
Lab and Terradue for providing access to Geohazards Exploitation Platform (GEP) for InSAR cloud processing.
GNSS data were provided by ALBPOS and IGEWE https://www.geo.edu.al/gnss/ The ALOS global digital surface
model-30 m used in Figure 1 is available from https://www.eorc.jaxa.jp/ALOS/en/aw3d30/index.htm We thank the
QGIS Development Team—Open Source Geospatial Foundation Project http://qgis.osgeo.org.
Conflicts of Interest: The authors declare no conflict of interest. The funders had no role in the design of the
study; in the collection, analyses, or interpretation of data; in the writing of the manuscript, or in the decision to
publish the results.
References
1. Baker, C.; Hatzfeld, D.; Lyon-Caen, H.; Papadimitriou, E.; Rigo, A. Earthquake mechanisms of the Adriatic
Sea and Western Greece: Implications for the oceanic subduction-continental collision transition. Geophys.
J. Int. 1997, 131, 559–594. [CrossRef]
2. Louvari, E.; Kiratzi, A.; Papazachos, B.; Hatzidimitriou, P. Fault-plane Solutions Determined by Waveform
Modeling Confirm Tectonic Collision in the Eastern Adriatic. Pure Appl. Geophys. 2001, 158, 1613–1637.
[CrossRef]
3. Jouanne, F.; Mugnier, J.-L.; Koçi, R.; Bushati, S.; Matev, K.; Kuka, N.; Shinko, I.; Kociu, S.; Duni, L. GPS
constraints on current tectonics of Albania. Tectonophysics 2012, 554, 50–62. [CrossRef]
4. Pérouse, E.; Chamot-Rooke, N.; Rabaute, A.; Briole, P.; Jouanne, F.; Georgiev, I.; Dimitrov, D. Bridging
onshore and offshore present-day kinematics of central and eastern Mediterranean: Implications for crustal
dynamics and mantle flow. Geochem. Geophys. Geosyst. 2012, 13. [CrossRef]
5. Métois, M.; D’Agostino, N.; Avallone, A.; Rabaute, A.; Duni, L.; Kuka, N.; Koçi, R.; Georgiev, I.;
Chamot-Rooke, N. Insights on continental collisional processes from GPS data: Dynamics of the peri-Adriatic
belts. J. Geophys. Res. Solid Earth 2015, 120, 8701–8719. [CrossRef]
6. D’Agostino, N.; Métois, M.; Koci, R.; Duni, L.; Kuka, N.; Ganas, A.; Georgiev, I.; Jouanne, F.; Kaludjerovic, N.;
Kandić, R. Active crustal deformation and rotations in the southwestern Balkans from continuous GPS
measurements. Earth Planet. Sci. Lett. 2020, 539, 116246. [CrossRef]
7. Xhomo, A.; Nazaj, S.; Nakuci, V.; Yzeiraj, D.; Lula, F.; Sadushi, P. Geological Map of Albania (1:200.000);
Ministry of Industry and Energy, Ministry of Education and Science, Albanian Geological Survey, AlpPetrol,
Polytechnical University of Tirana: Tirana, Albania, 1999.
8. Handy, M.R.; Giese, J.; Schmid, S.M.; Pleuger, J.; Spakman, W.; Onuzi, K.; Ustaszewski, K. Coupled
Crust-Mantle Response to Slab Tearing, Bending, and Rollback Along the Dinaride-Hellenide Orogen.
Tectonics 2019, 38, 2803–2828. [CrossRef]
9. Handy, M.R.; Schmid, S.M.; Briole, P. The M 6.4 Albanian earthquake of Nov. 26, 2019 and its relation to
structures at the Dinarides-Hellenides junctions. EGU Gen. Assem. 2020, 5409, 5194. [CrossRef]
10. Aliaj, S.; Sulstarova, E.; Muço, B.; Koçiu, S. Seismotectonic Map of Albania, at Scale 1:500.000; Seismological
Institute, Academy of Sciences: Tirana, Albania, 2000; p. 297.
11. Basili, R.; Kastelic, V.; Demircioglu, M.B.; Garcia Moreno, D.; Nemser, E.S.; Petricca, P.; Sboras, S.P.;
Besana-Ostman, G.M.; Cabral, J.; Camelbeeck, T.; et al. The European Database of Seismogenic Faults (EDSF)
Compiled in the Framework of the Project SHARE. 2013. Available online: http://diss.rm.ingv.it/share-edsf/
doi:10.6092/INGV.IT-SHARE-EDSF (accessed on 9 May 2020).
12. Aubouin, J.; Dercourt, J. Les transversales dinariques dérivent-elles de paléofailles transformantes? Comptes
Rendus Académie Sci. 1975, 281, 347–350.
13. Ambraseys, N.N.; Ciborowski, A.; Despeyroux, J. The Earthquake of 15 April in Montenegro; The United
Nations Educational, Scientific and Cultural Organization: Paris, France, 1979.Geosciences 2020, 10, 210 15 of 16
14. Benetatos, C.; Kiratzi, A. Finite-fault slip models for the 15 April 1979 (Mw 7.1) Montenegro earthquake and
its strongest aftershock of 24 May 1979 (Mw 6.2). Tectonophysics 2006, 421, 129–143. [CrossRef]
15. Papadopoulos, G.; Agalos, A.; Carydis, P.; Lekkas, E.; Mavroulis, S.; Triantafyllou, I. The Destructive
Earthquake (Mw6.4) of 26 November 2019 in Albania: A First Report. EGU Gen. Assem. 2020. [CrossRef]
16. Lekkas, E.; Mavroulis, S.; Papa, D.; Carydis, P. The November 26, 2019 Mw 6.4 Durrës (Albania) Earthquake;
Newsletter of Environmental, Disaster and Crises Management Strategies: Athens, Greece, 2019; p. 15. ISSN
2653-9454.
17. Caporali, A.; Floris, M.; Chen, X.; Nurçe, B.; Bertocco, M.; Zurutuza, J. The November 2019 Seismic Sequence
in Albania: Geodetic Constraints and Fault Interaction. Remote Sens. 2020, 12, 846. [CrossRef]
18. Ganas, A. Co-seismic deformation and preliminary fault model of the M6.4 Durres (Albania)
Nov. 26, 2019 earthquake, based on space geodesy observations. EGU Gen. Assem. 2020.
Available online: https://www.google.com.hk/url?sa=t&rct=j&q=&esrc=s&source=web&cd=&cad=
rja&uact=8&ved=2ahUKEwivotmMg8_pAhUUhZQKHQIEA4kQFjAAegQIAhAB&url=https%
3A%2F%2Fmeetingorganizer.copernicus.org%2FEGU2020%2FEGU2020-8478.html%3Fpdf&usg=
AOvVaw0OfVQKceWMZpL3K9PRsJfT (accessed on 25 May 2020).
19. Mavroulis, S.; Lekkas, E.; Carydis, P.; Papa, D. Factors controlling building damage distribution of the
November 26 Mw 6.4 Albania earthquake. EGU Gen. Assem. 2020, 2020–18616. [CrossRef]
20. Duni, L.; Theodoulidis, N. Short Note on the November 26, 2019, Durrës (Albania) M6.4 Earthquake:
Strong Ground Motion with Emphasis in Durrës City. EMSC on Line Report. Available online:
https://www.google.com.hk/url?sa=t&rct=j&q=&esrc=s&source=web&cd=&ved=2ahUKEwjP2v6Nhs_
pAhXOGaYKHfTWChIQFjAAegQIAxAB&url=http%3A%2F%2Fwww.itsak.gr%2Fuploads%2Fnews%
2Fearthquake_reports%2FEQ_Albania_2019-11-26_M6.4.pdf&usg=AOvVaw3sWTWRshmwbW_G2Uct-
M4e (accessed on 9 May 2020).
21. Lekkas, E.; Mavroulis, S.; Filis, C.; Carydis, P. The September 21, 2019 Mw 5.6 Albania Earthquake; Newsletter of
Environmental, Disaster and Crises Management Strategies: Athens, Greece, 2019; p. 13. ISSN 2653-9454.
22. Piccardi, L.; Toth, L.; Vittori, E.; Aliaj, S.; Cello, G.; Cunningham, D.W.; Drakatos, G.; Gosar, A.; Herak, D.;
Herak, M.; et al. A First Attempt at Compiling a Map of Active Faults of the Adria Region; Geophysical Research
Abstracts: Vienna, Austria, 2007; Volume 9, p. 09228. Available online: https://www.bib.irb.hr/297056
(accessed on 25 May 2020).
23. Kontoes, C.; Elias, P.; Sykioti, O.; Briole, P.; Remy, D.; Sachpazi, M.; Veis, G.; Kotsis, I. Displacement field and
fault model for the September 7, 1999 Athens Earthquake inferred from ERS2 Satellite radar interferometry.
Geophys. Res. Lett. 2000, 27, 3989–3992. [CrossRef]
24. Atzori, S.; Manunta, M.; Fornaro, G.; Ganas, A.; Salvi, S. Postseismic displacement of the 1999 Athens
earthquake retrieved by the Differential Interferometry by Synthetic Aperture Radar time series. J. Geophys.
Res. Space Phys. 2008, 113, 09309. [CrossRef]
25. Atzori, S.; Hunstad, I.; Chini, M.; Salvi, S.; Tolomei, C.; Bignami, C.; Stramondo, S.; Trasatti, E.; Antonioli, A.;
Boschi, E. Finite fault inversion of DInSAR coseismic displacement of the 2009 L’Aquila earthquake (central
Italy). Geophys. Res. Lett. 2009, 36. [CrossRef]
26. Briole, P.; Elias, P.; Parcharidis, I.; Bignami, C.; Benekos, G.; Samsonov, S.; Kyriakopoulos, C.; Stramondo, S.;
Chamot-Rooke, N.; Drakatou, M.; et al. The seismic sequence of January–February 2014 at Cephalonia Island
(Greece): Constraints from SAR interferometry and GPS. Geophys. J. Int. 2015, 203, 1528–1540. [CrossRef]
27. Ilieva, M.; Briole, P.; Ganas, A.; Dimitrov, D.; Elias, P.; Mouratidis, A.; Charara, R. Fault plane modelling of the
2003 August 14 Lefkada Island (Greece) earthquake based on the analysis of ENVISAT SAR interferograms.
Tectonophysics 2016, 693, 47–65. [CrossRef]
28. Papadopoulos, G.A.; Ganas, A.; Agalos, A.; Papageorgiou, A.; Kontoes, C.; Diakogianni, G.; Papoutsis, I.
Earthquake Triggering Inferred from Rupture Histories, DInSAR Ground Deformation and Stress-Transfer
Modelling: The Case of Central Italy During August 2016–January 2017. Pure Appl. Geophys. 2017, 174,
3689–3711. [CrossRef]
29. Melgar, D.; Ganas, A.; Geng, J.; Liang, C.; Fielding, E.; Kassaras, I. Source characteristics of the 2015Mw6.5
Lefkada, Greece, strike-slip earthquake. J. Geophys. Res. Solid Earth 2017, 122. [CrossRef]
30. Ganas, A.; Elias, P.; Bozionelos, G.; Papathanassiou, G.; Avallone, A.; Papastergios, A.; Valkaniotis, S.;
Parcharidis, I.; Briole, P. Coseismic deformation, field observations and seismic fault of the 17 November
2015 M = 6.5, Lefkada Island, Greece earthquake. Tectonophysics 2016, 687, 210–222. [CrossRef]Geosciences 2020, 10, 210 16 of 16
31. Ganas, A.; Elias, P.; Kapetanidis, V.; Valkaniotis, S.; Briole, P.; Kassaras, I.; Argyrakis, P.; Barberopoulou, A.;
Moshou, A. The July 20, 2017 M6.6 Kos Earthquake: Seismic and Geodetic Evidence for an Active
North-Dipping Normal Fault at the Western End of the Gulf of Gökova (SE Aegean Sea). Pure Appl. Geophys.
2019, 176, 4177–4211. [CrossRef]
32. Veci, L.; Lu, J.; Prats-Iraola, P.; Scheiber, R.; Collard, F.; Fomferra, N.; Engdahl, M. The Sentinel-1 toolbox.
In Proceedings of the IEEE International Geoscience and Remote Sensing Symposium (IGARSS), Quebec
City, QC, Canada, 13–18 July 2014; pp. 1–3.
33. Farr, T.; Rosen, P.A.; Caro, E.; Crippen, R.; Duren, R.; Hensley, S.; Kobrick, M.; Paller, M.; Rodríguez, E.;
Roth, L.; et al. The Shuttle Radar Topography Mission. Rev. Geophys. 2007, 45, 2004. [CrossRef]
34. Goldstein, R.M.; Werner, C.L. Radar interferogram filtering for geophysical applications. Geophys. Res. Lett.
1998, 25, 4035–4038. [CrossRef]
35. Zumberge, J.F.; Heflin, M.B.; Jefferson, D.C.; Watkins, M.M.; Webb, F.H. Precise point positioning for the
efficient and robust analysis of GPS data from large networks. J. Geophys. Res. Space Phys. 1997, 102,
5005–5017. [CrossRef]
36. Bertiger, W.; Desai, S.D.; Haines, B.; Harvey, N.; Moore, A.W.; Owen, S.; Weiss, J.P. Single receiver phase
ambiguity resolution with GPS data. J. Geod. 2010, 84, 327–337. [CrossRef]
37. Briole, P. Modelling of earthquake slip by inversion of GNSS and InSAR data assuming homogenous elastic
medium. Zenodo 2017. [CrossRef]
38. Ganas, A.; Briole, P.; Bozionelos, G.; Barberopoulou, A.; Elias, P.; Tsironi, V.; Valkaniotis, S.; Moshou, A.;
Mintourakis, I. The 25 October 2018 Mw = 6.7 Zakynthos earthquake (Ionian Sea, Greece): A low-angle fault
model based on GNSS data, relocated seismicity, small tsunami and implications for the seismic hazard in
the west Hellenic Arc. J. Geodyn. 2020, 101731. [CrossRef]
39. Papazachos, B.C.; Comninakis, P.E.; Karakaisis, G.F.; Karakostas, B.G.; Papaioannou, C.A.; Papazachos, C.B.;
Scordilis, E.M. A Catalogue of Earthquakes in Greece and Surrounding Area for the Period 550BC-1999; Publ.
Geophys. Laboratory, University of Thessaloniki: Thessaloniki, Greece, 2000; Volume 1, p. 333.
40. Crowell, B.W.; Melgar, D.; Bock, Y.; Haase, J.S.; Geng, J. Earthquake magnitude scaling using seismogeodetic
data. Geophys. Res. Lett. 2013, 40, 6089–6094. [CrossRef]
41. Melgar, D.; Crowell, B.W.; Geng, J.; Allen, R.M.; Bock, Y.; Riquelme, S.; Hill, E.M.; Protti, M.; Ganas, A.
Earthquake magnitude calculation without saturation from the scaling of peak ground displacement. Geophys.
Res. Lett. 2015, 42, 5197–5205. [CrossRef]
42. Ganas, A.; Andritsou, N.; Kosma, C.; Argyrakis, P.; Tsironi, V.; Drakatos, G. A 20-yr database (1997–2017) of
co-seismic displacements from GPS recordings in the Aegean area and their scaling with Mw and hypocentral
distance. Bull. Geol. Soc. Greece 2018, 52, 98–130. [CrossRef]
43. Ruhl, C.J.; Melgar, D.; Geng, J.; Goldberg, D.E.; Crowell, B.W.; Allen, R.M.; Bock, Y.; Barrientos, S.; Muñoz, S.R.;
Baez, J.C.; et al. A Global Database of Strong-Motion Displacement GNSS Recordings and an Example
Application to PGD Scaling. Seism. Res. Lett. 2018, 90, 271–279. [CrossRef]
© 2020 by the authors. Licensee MDPI, Basel, Switzerland. This article is an open access
article distributed under the terms and conditions of the Creative Commons Attribution
(CC BY) license (http://creativecommons.org/licenses/by/4.0/).You can also read