Hurricane Ike: Observations and Analysis of Coastal Change - USGS Open-File Report 2009-1061
←
→
Page content transcription
If your browser does not render page correctly, please read the page content below
Hurricane Ike: Observations and Analysis
            of Coastal Change
              USGS Open-File Report 2009-1061
By Kara S. Doran, Nathaniel G. Plant, Hilary F. Stockdon, Asbury H. Sallenger, and Katherine A. Serafin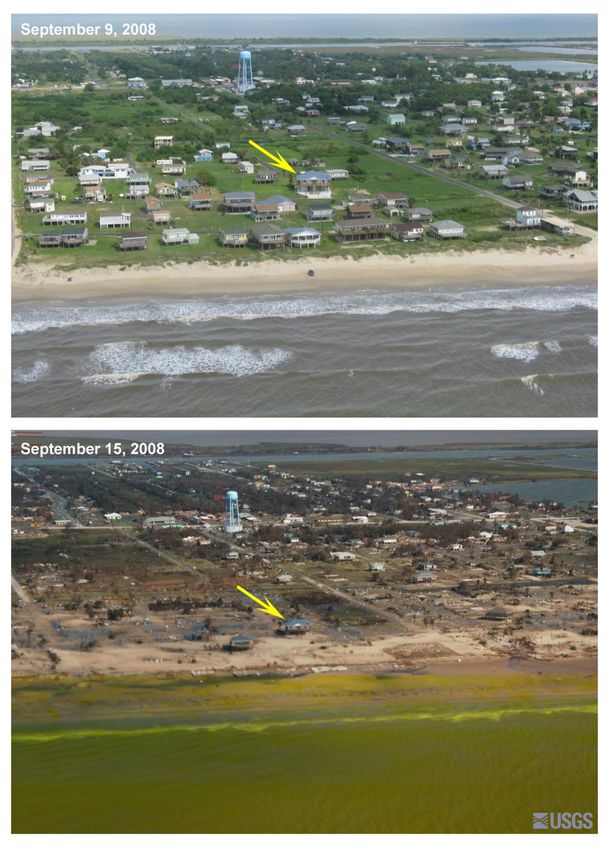
Hurricane Ike: Observations and Analysis of Coastal
Change
By Kara S. Doran, Nathaniel G. Plant, Hilary F. Stockdon, Asbury H. Sallenger, and Katherine A. Serafin

Open-File Report 2009–1061

U.S. Department of the Interior
U.S. Geological Survey
U.S. Department of the Interior
KEN SALAZAR, Secretary
U.S. Geological Survey
Suzette M. Kimball, Acting Director

U.S. Geological Survey, Reston, Virginia 2009

For product and ordering information:
World Wide Web: http://www.usgs.gov/pubprod
Telephone: 1-888-ASK-USGS

For more information on the USGS—the Federal source for science about the Earth,
its natural and living resources, natural hazards, and the environment:
World Wide Web: http://www.usgs.gov
Telephone: 1-888-ASK-USGS

Suggested citation:
Doran, Kara S., Plant, Nathaniel G., Stockdon, Hilary F., Sallenger, Asbury H., Serafin, Katherine A., 2009, Hurricane
Ike: Observations of Coastal Change: U.S. Geological Survey Open-File Report 2009-1061.

Any use of trade, product, or firm names is for descriptive purposes only and does not imply
endorsement by the U.S. Government.

Although this report is in the public domain, permission must be secured from the individual
copyright owners to reproduce any copyrighted material contained within this report.

                                       ii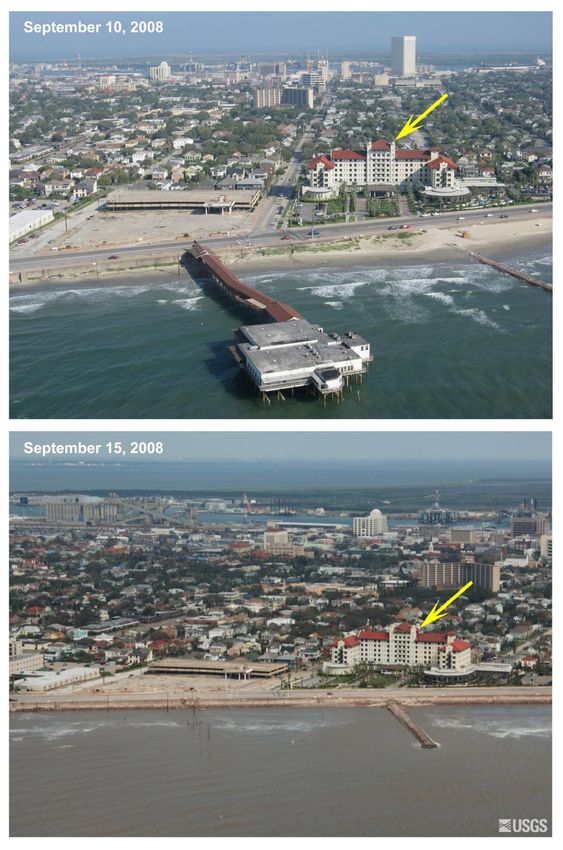
Contents
1. Introduction................................................................................................................................................................ 1
2. Storm Overview ......................................................................................................................................................... 2
   2.1 Storm History ....................................................................................................................................................... 2
   2.2 Extent of Hurricane-Force Winds ......................................................................................................................... 2
   2.3 Offshore Wave Climate ........................................................................................................................................ 3
   2.4 Storm Surge......................................................................................................................................................... 4
3. USGS Coastal-Change Observations........................................................................................................................ 5
   3.1 Oblique Aerial Photography and Video observations ........................................................................................... 5
   3.2 Lidar Topographic Surveys .................................................................................................................................. 6
     3.2.1 Lidar Flight Information.................................................................................................................................. 7
     3.2.2 Lidar Control GPS Base-Stations .................................................................................................................. 7
     3.2.3 Lidar Quality .................................................................................................................................................. 8
4. Coastal-Change Analysis .........................................................................................................................................10
   4.1 Photo Comparison Analysis ................................................................................................................................10
     4.1.1 Surfside Beach to San Luis Pass, Texas......................................................................................................10
     4.1.2 Galveston, Texas .........................................................................................................................................14
     4.1.3 Bolivar Peninsula..........................................................................................................................................18
     4.1.4 High Island to Sabine Pass, Texas...............................................................................................................21
     4.1.5 Cameron Parish, Western Louisiana ............................................................................................................25
   4.2 Quantitative Topographic-Change Analysis ........................................................................................................28
     4.2.1 Dune Elevation Change................................................................................................................................31
     4.2.2 Shoreline Change.........................................................................................................................................32
     4.2.3 Beach-Volume Change ................................................................................................................................32
5. Acknowledgments.....................................................................................................................................................33
References Cited..........................................................................................................................................................34

Figures
Figure 1. Track of Hurricane Ike in the Atlantic Ocean, Caribbean Sea, and Gulf of Mexico. .................................... 2
Figure 2. Wind speeds in kilometers per hour generated by Hurricane Ike, as calculated by the National Oceanic and
        Atmospheric Administration Hurricane Research Division................................................................................ 3
Figure 3. Significant wave height during the passage of Hurricane Ike, as measured from National Oceanic and
        Atmospheric Administration Buoy 42035 located near Galveston, Texas......................................................... 4
Figure 4. Digital-photography and video and recording system used aboard aircraft during coastal oblique video and
        photography missions....................................................................................................................................... 6
Figure 5. Hurricane Ike pre- and post-storm oblique aerial photography and video flights and post-storm lidar
        coverage........................................................................................................................................................... 8
Figure 6. Map of Galveston Island. .............................................................................................................................. 9
Figure 7. Relative offset between 2005 and 2008 Experimental Advanced Airborne Research Lidar first-return
        lidar...................................................................................................................................................................10
Figure 8. Location index for photo pairs from Surfside Beach, Texas to Cameron Parish, Louisiana………………....11
Figure 9. Oblique aerial photography from Quintana, Texas, on September 9, 2008 and September 15, 2008, two
        days after landfall of Hurricane Ike ..................................................................................................................12
Figure 10. Oblique aerial photography from Christmas Bay, Texas, on September 9, 2008, and September 15, 2008,
        two days after landfall of Hurricane Ike............................................................................................................13
                                                                                       iii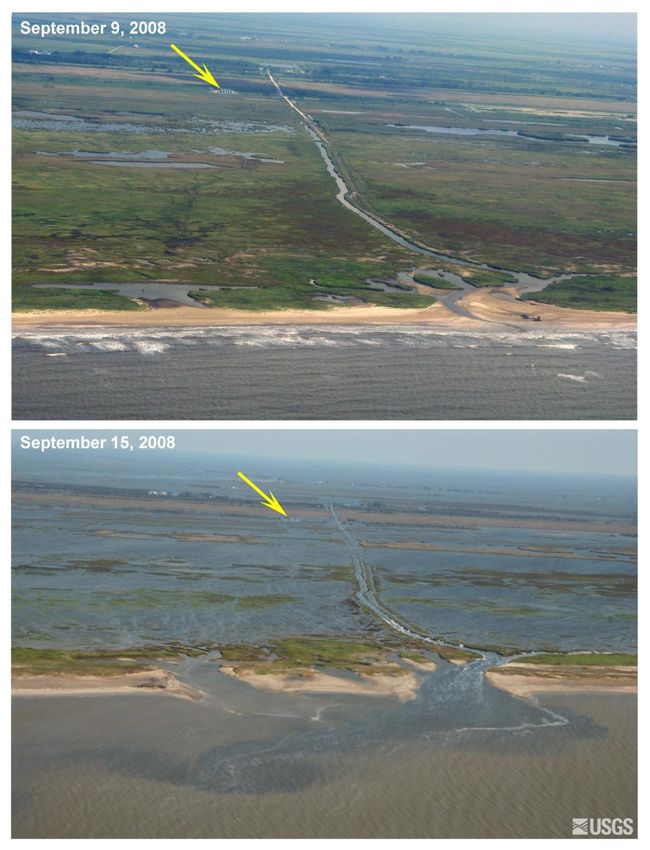
Figure 11. Oblique aerial photography of Galveston, Texas, on September 9, 2008, and September 15, 2008, two
        days after landfall of Hurricane Ike ..................................................................................................................15
Figure 12. Oblique aerial photography of Galveston, Texas, on September 9, 2008, and September 15, 2008, two
        days after landfall of Hurricane Ike ..................................................................................................................16
Figure 13. Oblique aerial photography of Galveston, Texas, on September 9, 2008, and September 15, 2008, two
        days after landfall of Hurricane Ike ..................................................................................................................17
Figure 14. Oblique aerial photography of Bolivar Peninsula, Texas, on September 9, 2008, and September 15, 2008,
        two days after landfall of Hurricane Ike............................................................................................................19
Figure 15. Oblique aerial photography of Bolivar Peninsula, Texas, on September 9, 2008, and September 15, 2008,
        two days after landfall of Hurricane Ike............................................................................................................20
Figure 16. Oblique aerial photography near McFaddin Wildlife Refuge, Texas, on September 9, 2008, and
        September 15, 2008, two days after landfall of Hurricane Ike .........................................................................22
Figure 17. Oblique aerial photography near McFaddin Wildlife Refuge, Texas, on September 9, 2008, and
        September 15, 2008, two days after landfall of Hurricane Ike .........................................................................23
Figure 18. Oblique aerial photography near McFaddin Wildlife Refuge, Texas, on September 9, 2008, and
        September 15, 2008, two days after landfall of Hurricane Ike .........................................................................24
Figure 19. Oblique aerial photography from Cameron Parish, Louisiana, on September 9, 2008, and September 15,
        2008, two days after landfall of Hurricane Ike..................................................................................................26
Figure 20. Oblique aerial photography from Peveto Beach, Louisiana, on September 9, 2008, and September 15,
        2008, two days after landfall of Hurricane Ike..................................................................................................27
Figure 21. Oblique aerial photography from Holly Beach, Louisiana, from 2001-2008. ..............................................28
Figure 22. September 2005 Experimental Advanced Airborne Research Lidar first-return lidar digital elevation model
        of Crystal Beach, Texas...................................................................................................................................29
Figure 23. September 2008 Experimental Advanced Airborne Research Lidar first-return lidar digital elevation model
        of Crystal Beach, Texas...................................................................................................................................30
Figure 24. Coastal change at Crystal Beach, Texas due to Hurricane Ike. .................................................................31
Figure 25. Hurricane Ike dune-elevation change, shoreline change, and beach-volume change. ..............................33

Tables
Table 1.         Details of the two GPS control stations used during the September 17-18, 2008, EAARL lidar mission. .. 7

                                                                                iv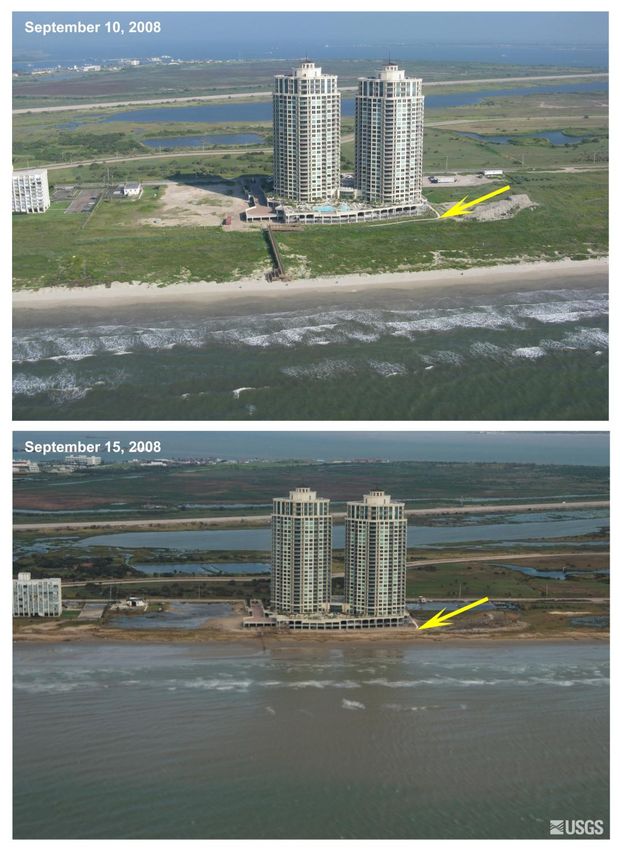
Conversion Factors

SI to Inch/Pound
                 Multiply            By                                To obtain
                                   Length
centimeter (cm)                    0.3937           inch (in.)
meter (m)                          3.281            foot (ft)
kilometer (km)                     0.6214           mile (mi)
kilometer (km)                     0.5400           mile, nautical (nmi)
meter (m)                          1.094            yard (yd)
                                   Volume
                 3
cubic meter (m )                   6.290            barrel (petroleum, 1 barrel = 42 gal)
                 3
cubic meter (m )                 264.2              gallon (gal)
cubic meter (m3)                   0.0002642        million gallons (Mgal)
                     3
cubic decimeter (dm )              0.03531          cubic foot (ft3)
cubic meter (m3)                  35.31             cubic foot (ft3)
cubic meter (m3)                   1.308            cubic yard (yd3)
                                  Flow rate
kilometer per hour (km/hr)         0.6214           mile per hour (mi/hr)

Additional Abbreviations and Acronyms
       ACRONYM OR ABBREVIATION                         DEFINITION

CORS                               Continuously Operating Reference Stations

DEM                                Digital Elevation Model

EAARL                              Experimental Advanced Airborne Research Lidar

GPS                                Global Positioning System

Hz                                 Hertz

                                                v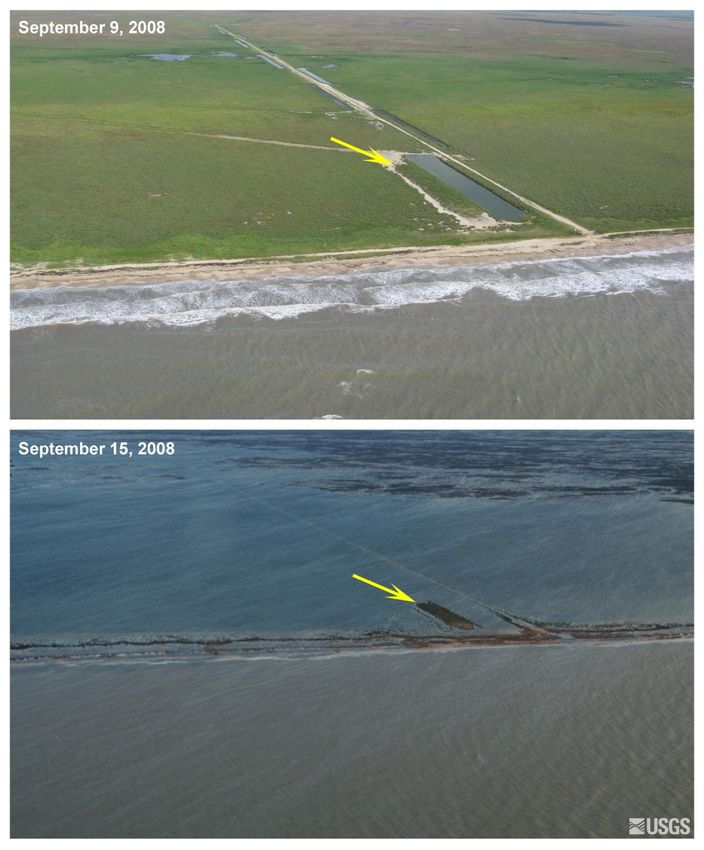
kHz      Kilohertz

KGLS     Scholes International Airport at Galveston

KPKV     Calhoun County Airport

Lidar    Light Detection and Ranging

NAD83    North American Datum 1983

NAVD88   North American Vertical Datum 1988

NHC      National Hurricane Center

nm       Nanometer(s)

NOAA     National Oceanic and Atmospheric
         Administration
NWC      National Weather Center

USGS     U.S. Geological Survey

UTC      Coordinated Universal Time

                      vi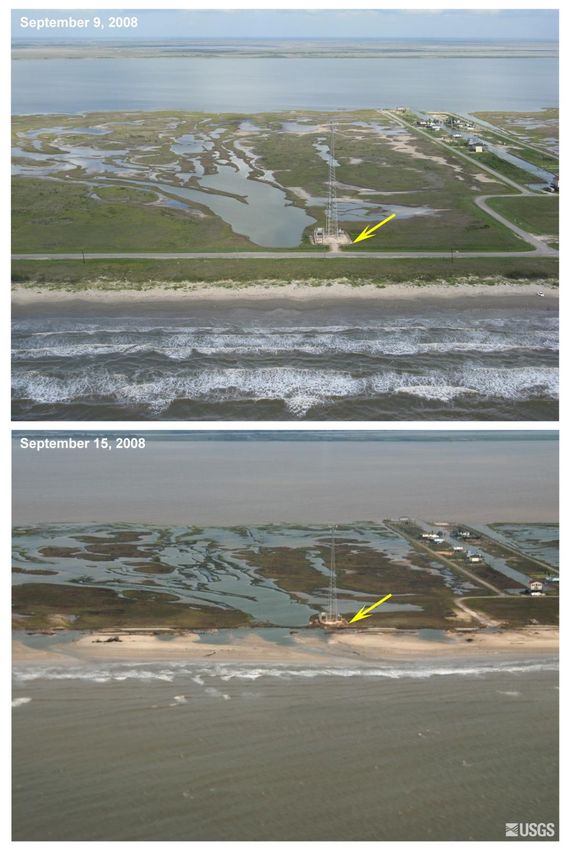
Hurricane Ike: Observations and Analysis of Coastal
Change
By Kara S. Doran, Nathaniel G. Plant, Hilary F. Stockdon, Asbury H. Sallenger, and Katherine A. Serafin
1. Introduction
Understanding storm-induced coastal change and forecasting these changes require knowledge
of the physical processes associated with the storm and the geomorphology of the impacted coastline.
The primary physical processes of interest are the wind field, storm surge, and wave climate. Not only
does wind cause direct damage to structures along the coast, but it is ultimately responsible for much of
the energy that is transferred to the ocean and expressed as storm surge, mean currents, and large waves.
Waves and currents are the processes most responsible for moving sediments in the coastal zone during
extreme storm events. Storm surge, the rise in water level due to the wind, barometric pressure, and
other factors, allows both waves and currents to attack parts of the coast not normally exposed to those
processes.
Coastal geomorphology, including shapes of the shoreline, beaches, and dunes, is equally
important to the coastal change observed during extreme storm events. Relevant geomorphic variables
include sand dune elevation, beach width, shoreline position, sediment grain size, and foreshore beach
slope. These variables, in addition to hydrodynamic processes, can be used to predict coastal
vulnerability to storms.
The U.S. Geological Survey’s (USGS) National Assessment of Coastal Change Hazards Project
(http://coastal.er.usgs.gov/hurricanes), strives to provide hazard information to those interested in the
Nation’s coastlines, including residents of coastal areas, government agencies responsible for coastal
management, and coastal researchers. As part of the National Assessment, observations were collected
to measure coastal changes associated with Hurricane Ike, which made landfall near Galveston, Texas,
on September 13, 2008. Methods of observation included aerial photography and airborne topographic
surveys. This report documents these data-collection efforts and presents qualitative and quantitative
descriptions of hurricane-induced changes to the shoreline, beaches, dunes, and infrastructure in the
region that was heavily impacted by Hurricane Ike.
The contents of this report are divided into the following sections:
Section 2, Storm Overview - presents a synopsis of the storm, including meteorological
evolution, wind speed impact area, wind-wave generation, and storm-surge extent and
magnitudes.
Section 3, Coastal-Change Observations - describes the observation missions that responded to
Hurricane Ike, which included acquisition of oblique aerial photography and airborne
topography surveys using lidar.
Section 4, Coastal-Change Analysis - describes data-analysis methods and results.
1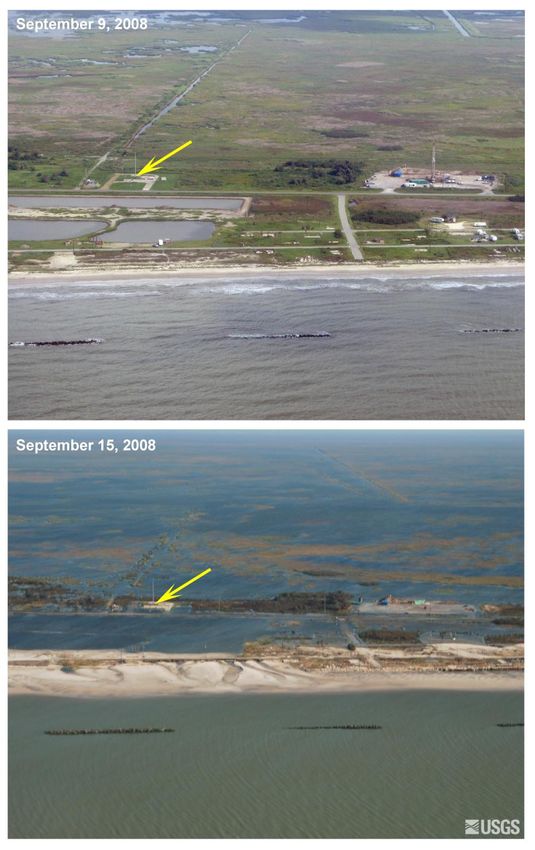
2. Storm Overview
 2.1 Storm History
         According to the National Oceanic and Atmospheric Administration (NOAA) National
 Hurricane Center’s best track, Hurricane Ike was an active tropical-weather system in the Caribbean Sea
 and Gulf of Mexico from August 28 to September 13, 2008 (fig. 1; Berg, 2009). On September 1 at
 0600 Universal Time Coordinated (UTC), a tropical wave 1,250 km west of the Cape Verde Islands was
 identified as a tropical depression. At 1200 UTC the same day, Tropical Storm Ike became the ninth
 named storm of the 2008 hurricane season. By 0600 UTC on September 4, Ike had intensified to a
 category 4 storm with winds of 231 km/hr. Hurricane Ike passed over Grand Turk, Salt Cay, and South
 Caicos islands on September 7 and made another landfall later that day on Great Inagua Island in the
 southern Bahamas. Subsequent landfalls occurred near Cabo Lucrecia, Cuba, on September 8 and near
 San Cristobal, Cuba, on September 9 before the storm entered the Gulf of Mexico. Hurricane Ike
 crossed the Gulf of Mexico and made landfall along the north end of Galveston Island, Texas, as a
 strong category 2 storm with maximum sustained winds of 175 km/hr at 0700 UTC on September 13
 (Berg, 2009).

Figure 1. Track of Hurricane Ike in the Atlantic Ocean, Caribbean Sea, and Gulf of Mexico. Hurricane track
     information was obtained from the National Hurricane Center (Berg, 2009).

         2.2 Extent of Hurricane-Force Winds
         Maximum sustained wind swaths estimated by the NOAA Atlantic Oceanographic and
 Meteorological Laboratory Hurricane Research Division (using methods described by Powell and
 others, 1998) indicate that hurricane-force winds impacted approximately 180 km of coastline (Fig. 2).
 The maximum wind-speeds were observed just east of Galveston, Texas. Hurricane-force winds
 extended across the Texas-Louisiana border and affected much of the Louisiana coast.

                                                        2
98 o W 96 o W 94 o W 92 o W 90 o W
160
1
33 o 33
N 140 0.9
0.8
120
31 o 31
N 0.7
100
Wind Speed (km/hr)
0.6
Galveston, TX
o 0.5
29 29
N 80
16
0
0.4
14 0
60
12
27o 27
N 10
0 0.3
0
40
80
0.2
60
40
o 20 0.1
25 25
N 20
0
0 0.002 0
Figure 2. Wind speeds in kilometers per hour generated by Hurricane Ike, as calculated by the National Oceanic
and Atmospheric Administration Hurricane Research Division. The extent of hurricane-force wind, as defined
by a category 1 wind speed of 119 km/hr, is indicated by the orange contour.
2.3 Offshore Wave Climate
Several moored buoys operated by the NOAA National Data Buoy Center recorded heights and
periods of waves generated by Hurricane Ike. Approximately 33 hrs prior to landfall, Hurricane Ike
passed within 28 km of Buoy 42001 (fig. 1), which is located in the Gulf of Mexico approximately 330
km south of Southwest Pass, Louisiana. The maximum significant wave height recorded at this station
was 9.2 m (National Data Buoy Center, 2008). Buoy 42035 (fig. 1), moored east of Galveston, Texas,
in 13.7 m of water, went adrift on September 12 and later passed through the eye of Hurricane Ike. The
buoy recorded a maximum significant wave height of 6.0 m at 0400 UTC on September 13 (fig. 3), 3
hrs before Hurricane Ike came ashore in Galveston, Texas (National Data Buoy Center, 2008).
37.0
6.5
6.0
5.5
Wave height, in meters
5.0
4.5
4.0
3.5
3.0
2.5
9/12/08 9/12/08 9/13/08 9/13/08 9/14/08
0000 UTC 1200 UTC 0000 UTC 1200 UTC 0000 UTC
Figure 3. Significant wave height during the passage of Hurricane Ike, as measured from National Oceanic and
Atmospheric Administration Buoy 42035 located near Galveston, Texas.
2.4 Storm Surge
Measurements of maximum storm surge are generally gathered from coastal tide gages and land-
based storm sensors (East and others, 2008), and high-water marks (McGee and others, 2006). During
Hurricane Ike, many tide gages were operational, and the data have been published by NOAA (Berg,
2009; National Weather Service Houston/Galveston, 2008). Higher-than-normal water levels affected
all Gulf Coast States as Hurricane Ike moved into the Gulf of Mexico. The large wind field pushed
water toward the coastline well before landfall. Maximum storm tides ranged from 0.37 to 0.87 m above
normal along the west coast of Florida. The coasts of Alabama, Mississippi, and southeastern Louisiana
experienced maximum storm surges ranging from 0.79 m at Gulfport, Mississippi, to 1.98 m at Shell
Beach near New Orleans, Louisiana. West of Grand Isle, Louisiana, storm-surge heights rose
progressively, increasing from 1.17 m at Grand Isle to 3.82 m at Port Arthur, Texas. Near landfall,
many tide gages failed due to large wave action that destroyed the instrument platforms. On the Bolivar
Peninsula, high-water marks indicate that all of the area was covered by at least 1 m of water with many
areas covered by at least 3 m of water (Berg, 2009). Storm-surge levels on Galveston Island are
estimated to have been between 3 and 4.5 m from high-water marks and the Eagle Point tide gage,
located in Galveston Bay. South of Galveston Island along the Texas coast in Brazoria County, surge
levels of 1.5 to 3 m were recorded.
43. USGS Coastal-Change Observations
The USGS National Assessment of Coastal Change Hazards Project responded to Hurricane Ike
with the following observation missions:
Pre-storm oblique aerial photography (completed September 10, 2008)
Post-storm oblique aerial photography (completed September 15, 2008)
Post-storm airborne lidar topographic survey (completed September 18, 2008)
Ground-based control surveys (completed September 18, 2008)
The near-real-time response of this effort is documented at http://coastal.er.usgs.gov/hurricanes/ike/.
Photographs taken after the storm are matched to pre-storm images to locate areas of extreme
erosion and accretion, retreat of the shoreline, and damage to infrastructure. In some areas of special
concern, repeat photography surveys are flown, allowing a closer look at the gradual recovery of the
beach system. Additionally, aerial photographs are often valuable for the identification of buildings and
vegetation that are not easily distinguished in lidar maps. Post-storm photos are used to plan lidar
mapping missions to target areas with significant coastal change. The post-storm topographic-lidar
survey targets the region that was heavily affected by the storm. The updated topography from this
mission can be compared to pre-storm topography to estimate changes in shoreline position, dune
elevation, and infrastructure. The post-storm topography also serves as an update for emergency and
coastal managers who require detailed knowledge of the post-storm landscape.
3.1 Oblique Aerial Photography and Video Observations
The USGS oblique digital photography is collected prior to hurricane landfall and immediately
after landfall. Pre-storm photography is conducted well before landfall or immediately prior to landfall
if prior imagery does not exist or is excessively out of date. Digital photography is shot by hand while
video is recorded continuously. Images are geolocated using accurate Global Positioning System (GPS)
positions which are recorded separately and merged with the imagery in post-processing. The compact
digital video/digital photo system (fig. 4) can be used on various aircraft such as the NOAA Twin Otter,
the Coast Guard H60 and H65 helicopters, and commercial King Air and Navajo Chieftain aircraft.
A pre-storm oblique aerial-photography survey of the Texas coastline was collected on
September 9, 2008, four days before landfall, in a cooperative agreement between Louisiana State
University, the University of New Orleans, and the USGS. The aircraft was a single-engine Cessna. In
total, 1,767 digital photos were obtained over a 630-km extent from Cameron, Louisiana, to Port Isabel,
Texas.
Post-storm oblique aerial photography and video of the region of landfall were collected from a
twin engine King Air aircraft on September 14 and 15, 2008, two days after landfall. In total, 2,521
digital photographs and 8 hrs of video were obtained over a 240-km extent from Freeport, Texas, to
Cameron, Louisiana. The photography sample rate was 0.5 frames/sec (or approximately 1 photo per
200 m). Examples of both pre- and post-storm photographs obtained during these two flights are shown
in Section 4.1.
5Figure 4. Digital-photography and video recording system used aboard aircraft during coastal oblique video and
photography missions.
3.2 Lidar Topographic Surveys
Modern, high-resolution lidar systems can map hundreds of kilometers of coast in a day with
point densities exceeding one point per square meter. High point densities combined with reasonable
horizontal and vertical accuracies allow for the creation of topographic/bathymetric digital-elevation
models (DEM) that show details of the coastal environment. Lidar systems emit pulses of light that
reflect off the Earth’s surface, allowing the computation of elevation from the two-way transmission
time. The high-frequency pulses are emitted from a laser that is mounted on a small aircraft. Aircraft
movement is monitored by an inertial navigation unit, a GPS unit, and tilt sensors. More complete
descriptions of coastal lidar instruments and methods can be found in Brock and others (2002).
Lidar surveys receive positioning control using differential GPS that requires a base-station
receiver on the ground. The USGS sets up base stations near the area of hurricane impact if
continuously operating reference stations (CORS) are not available. Additionally, because slowly
varying positioning errors can corrupt the data (Sallenger and others, 2003), control points are surveyed
6for use in identifying these errors. Control points on surfaces that do not vary, such as roads or parking
lots, can be obtained using ground-based surveying methods or by utilizing previous lidar surveys.
Ground-based surveys performed on the beach surface are required to be synchronous with the lidar
survey because of the likelihood for rapid and significant changes associated with the storm and the
post-storm recovery period. Vertical accuracy of the lidar survey data is expected to be on the order of
10-20 cm (Sallenger and others, 2003), whereas the horizontal-position accuracy is on the order of 1 m
(Nayegandhi and others, in press).
After collection, the lidar data are processed using software specific to the lidar instrument.
Included in the processing steps are removal of wild points and separation of points into first- and last-
return lidar products (Bonisteel and others, in press). The lidar first- and last-returns are the first and last
backscatter to return to the sensor from the laser pulse. First-returns can be used to estimate canopy
height in vegetated areas or rooftop height in developed areas, while last-returns can be used to estimate
elevation of the bare-Earth surface under vegetation.
3.2.1 Lidar Flight Information
An airborne lidar survey of post-storm topography was completed September 17, 2008, four
days after landfall, on the Texas coast between Port Lavaca and Port Arthur using the USGS
Experimental Advanced Airborne Research Lidar (EAARL) system. The EAARL system was mounted
on a twin-engine Cessna 310 aircraft. The survey covered 300 km of coastline in 6.15 hrs and collected
53.5 million points. Eight flight passes were flown from San Luis Pass north to Port Arthur (fig. 5),
while only two passes were flown from San Luis Pass south to Port Lavaca. Each pass overlaps the
adjacent pass by 30-50 percent. Lidar data were only collected for September 17, 2008. Problems with
the laser on September 18 limited the mission to imagery only.
3.2.2 Lidar Control GPS Base-Stations
Ground-based survey systems were set up near the airport at Port Lavaca, TX (KPKV) and on
the Bolivar Peninsula (KGLS) (fig. 5). New control points were created for both survey locations.
Instrumentation details and precise locations, including ellipsoidal height, for each station are listed in
table 1. In standby, when the lidar aircraft was not deployed, both GPS systems collected 30 sec data
from 2008-09-17 16:28:14 to 2008-09-18 20:52:54. During flights, the sample rate was increased to 2
Hz. GPS quality was good for both stations.
Table 1. Details of the two GPS control stations used during the September 17-18, 2008, EAARL lidar mission.
Station ID KPKV KGLS
Latitude 28° 39.1288' N 29° 21.7366' N
Longitude 96° 40.9334' W 94° 46.6855' W
Ellipsoidal Height (WGS84) -17.521 m -24.6750 m
Receiver Type Ashtech Z Eurocard Ashtech Z Eurocard
Antenna Type ASH700936B_M ASH700936A_M
7Figure 5. Hurricane Ike pre- and post-storm oblique aerial photography and video flights and post-storm lidar
coverage. The locations of the GPS base stations are noted as black triangles.
3.2.3 Lidar Quality
First-return lidar points were interpolated to a series of regular 5 x 5 m grid domains. The
interpolation method applies a smoothing filter that removes short-scale variability and determines the
degree to which residual noise has been removed. Elevations at grid points that received too few
observations to reduce system noise were removed. Evaluation of the actual vertical accuracy of the
8lidar could not be performed against ground-based surveying because the lidar flight path did not
overlap the ground base station. Since no ground surveys were conducted concurrent with the
September 17, 2008, lidar survey, a relative offset between the 2005 and 2008 data was determined.
Lidar data were selected from a number of small areas containing fixed, flat features, such as roads,
parking lots, and large buildings (fig. 6). For this intercomparison, a section of the city of Galveston was
used. Grid cells were then selected based on their spatial error (normalized sampling error less than 25
percent and residual error less than 20 cm) to eliminate cells with a small number of observations or
high noise due to system behavior, or vegetation, or other sources of clutter. The grid cells that were
selected were used to determine the relative offset of + 32 (+/- 0.001) cm (fig. 7), indicating that the
2008 survey was biased high compared to the 2005 survey. This bias may be due to navigation errors in
either or both of the surveys used in the comparison. Since the bias is within the vertical-error limits of
the lidar surveys (+/- 20 cm), the bias has not been removed from either dataset. The presence of a bias
is important because it increases the uncertainty of the measures of coastal change presented in Section
4.2.
95 o10' W 95 o00' W 94 o50' W 94 o40' W 94 o30' W
29 o30' N Galveston
Bay
29 o24' N
29 o18' N
Area selected for 2005,
29 o12' N 2008 lidar survey
relative offset
evaluation
29 o06' N Gulf of
Mexico
29 o00' N
Figure 6. Map of Galveston Island. Red square shows location of the area selected for evaluating the relative
offset between 2005 and 2008 lidar surveys.
9Figure 7. Relative offset between 2005 and 2008 Experimental Advanced Airborne Research Lidar first-return
lidar.
4. Coastal-Change Analysis
The pre- and post-storm photography and the pre- and post-storm lidar topography were
compared to describe and quantify the spatial extent, nature, and magnitude of coastal changes. The
photography was used to identify examples of coastal changes that span the range of responses to the
hurricane conditions. The lidar topography quantifies these changes. The quantitative analyses include
estimates of changes in dune height, shoreline position, and sediment volume.
4.1 Photo Comparison Analysis
4.1.1 Surfside Beach to San Luis Pass, Texas
On the sandy beaches west of Galveston Island (fig. 8, locations 1 and 2), peak dune elevations
before the storm ranged from 2 to 4 m. The coastal change along this largely undeveloped stretch of
beach was less severe than the change observed on Galveston Island and Bolivar Peninsula. Large
waves and surge eroded the beach, causing shoreline retreat and scarping of the dune face (figs. 9 and
10).
1095 o00' W 94o30' W 94 o00' W 93 o30' W
Calcasieu
Sabine Lak e
30 o00' N Lak e
12 13
11
29o40' N 10
Galveston
Bay 9 C a m e ron
H ous ton Pa ris h
8
H igh Is la nd
6 7 to Sa bine Pa s s
Boliva r
29o20' N Pe nins ula
5
4
3
Ga lve s ton
Gulf of Mexico
o
29 00' N 2
1 Surfs ide Be a ch
to Sa n Luis Pa s s
28o40' N
Figure 8. Location index for photo pairs (Figures 9-21) from Surfside Beach, Texas to Cameron Parish,
Louisiana.
11Figure 9. Oblique aerial photography from Quintana, Texas (Location 1, Figure 8) on September 9, 2008 (top)
and September 15, 2008, two days after landfall of Hurricane Ike (bottom). Yellow arrows mark features visible
in each image. At this location well west of Ike's landfall location, there is evidence of erosion of the seaward
leg of the rectangular berm. The steep scarp is typical of erosion due to wave collision against the berm slope.
Erosion and overwash can be seen on the lower dune to the west (left) of the larger berm.
12Figure 10. Oblique aerial photography from Christmas Bay, Texas (Location 2, Figure 8), on September 9, 2008
(top), and September 15, 2008, two days after landfall of Hurricane Ike (bottom). Yellow arrows mark features
visible in each image. Here, severe beach and dune erosion occurred, and overwash or inundation deposited
sand behind remnants of the dune and onto the road.
134.1.2 Galveston, Texas
Most of Galveston Island was west of Hurricane Ike landfall (fig. 8, locations 3-5) and was not
exposed to the extreme winds of the right eyewall that devastated the Bolivar Peninsula. On the sandy
beaches west of the Galveston seawall, peak dune elevations before the storm were 2 to 4 m, roughly
half of the elevation of the seawall. The coastal change along this stretch of Galveston Island was
considerably more than on the seawalled section nearby, but less than the change observed on the
Bolivar Peninsula. At landfall, while the Bolivar Peninsula was being pummeled with extreme onshore
winds, much of Galveston Island experienced offshore winds, reducing both surge and, to some extent,
wave heights. However, impacts were not absent. Waves, aided by high surge, eroded the beach,
moving the shoreline landward of some houses west of the seawall (fig. 11).
The city of Galveston was protected from storm surge and wave attack by a 5- to 6-m high, 16
km-long seawall. Erosion was restricted to the beach in front of the seawall (fig. 12). Here, most of the
severe impacts to buildings were confined to those that were built on piers that extended seaward of the
seawall. A small section of the eastern end of the island was not protected by the seawall. This area was
on the right-hand side of the hurricane track and likely experienced the strongest winds, and the highest
surge and waves, leading to beach and dune erosion (fig. 13).
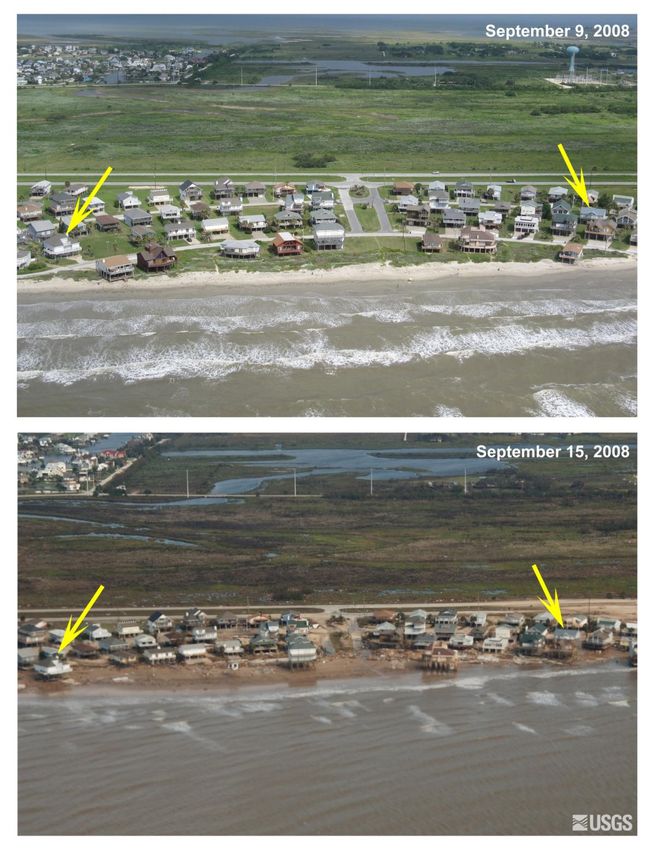
14Figure 11. Oblique aerial photography of Galveston, Texas (Location 3, Figure 8), on September 9, 2008 (top),
and September 15, 2008, two days after landfall of Hurricane Ike (bottom). Yellow arrows mark features visible
in each image. Evidence of inundation here includes eroded beach face, sand deposited inland of the
shoreline, and distressed vegetation. However, the coastal-change impacts were less severe here than on the
Bolivar Peninsula, located northeast of landfall.
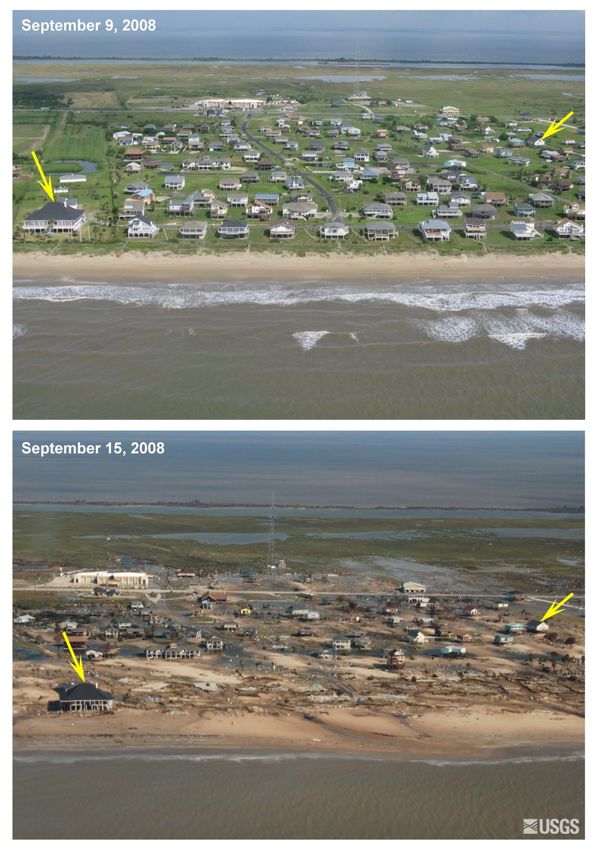
15Figure 12. Oblique aerial photography of Galveston, Texas (Location 4, Figure 8), on September 9, 2008 (top) and
September 15, 2008, two days after landfall of Hurricane Ike (bottom). Yellow arrows mark features visible in
each image. Hurricane-induced waves and surge destroyed a pier and eroded adjacent beaches.
16Figure 13. Oblique aerial photography of Galveston, Texas (Location 5, Figure 8), on September 9, 2008 (top) and
September 15, 2008, two days after landfall of Hurricane Ike (bottom). Yellow arrows mark features visible in
each image. Hurricane-induced waves and surge destroyed a small walkway. Coastal-change impacts include
beach and dune erosion, and the removal of considerable dune vegetation. This location is on the right-hand
side of the hurricane track and likely experienced the strongest winds, highest surge, and waves.
174.1.3 Bolivar Peninsula
Hurricane Ike made landfall at the mouth of Galveston Bay, thus exposing the coast lying east of
landfall to the right-front quadrant of the storm, the location of the strongest winds. The storm surge,
onshore-directed winds, and waves all focused their greatest energy in this area. The combination of low
dunes and high-surge levels on the Bolivar Peninsula (fig. 8, locations 6 and 7) made those beaches
vulnerable to inundation and large-scale coastal changes during landfall. Entire neighborhoods were
destroyed by battering waves riding on top of a 5-m storm surge. Low sand dunes (about 2 m elevation)
protecting beach-front neighborhoods were flattened by erosion, and sand from the beach and dunes was
transported landward and ultimately deposited across the width of several blocks (figs. 14 and 15). At
the narrowest part of the Peninsula near Gilchrist, Texas, the sand and debris were swept into Galveston
Bay.
18Figure 14. Oblique aerial photography of Bolivar Peninsula, Texas (Location 6, Figure 8), on September 9, 2008
(top) and September 15, 2008, two days after landfall of Hurricane Ike (bottom). Yellow arrows mark features
visible in each image. In addition to loss of houses, the evidence of inundation here includes eroded dune face
and sand deposited well inland of the shoreline.
19Figure 15. Oblique aerial photography of Bolivar Peninsula, Texas (Location 7, Figure 8), on September 9, 2008
(top), and September 15, 2008, two days after landfall of Hurricane Ike (bottom). Yellow arrows mark features
visible in each image. In addition to the loss of houses, the evidence of inundation here includes eroded dune
face and sand deposited well inland of the shoreline.
204.1.4 High Island to Sabine Pass, Texas
Farther east across the upper Texas coast (fig. 8, locations 8-10), the pre-storm morphology was
different and so were the impacts. Before the storm, dune elevations (or berms in the absence of dunes)
were extremely low, ranging from only 1 to 2 m high. Landward of mainland beaches were low-lying
marshlands. The storm surge of 3 to 4 m overtopped the beach systems and, in places, inundated the
marshes tens of kilometers landward from the shoreline. Two days after the storm, floodwaters were
still present, held in place by what remained of the beaches that acted like levees containing the water
(figs. 16 and 17). The beach crests rose above the water and resembled barrier islands, whereas they
were actually mainland beaches. Breaches were cut through these 'barriers' and water flowed seaward,
slowly draining the huge, shallow lakes. During this process, eroded sand was transported seaward into
the Gulf of Mexico (fig. 18).
21Figure 16. Oblique aerial photography near McFaddin Wildlife Refuge, Texas (Location 8, Figure 8), on September
9, 2008 (top) and September 15, 2008, two days after landfall of Hurricane Ike (bottom). Yellow arrows mark
features visible in each image. Widespread inundation and persistent flooding are obvious but the extent of
coastal change is difficult to assess.
22Figure 17. Oblique aerial photography near McFaddin Wildlife Refuge, Texas (Location 9, Figure 8), on September
9, 2008 (top) and September 15, 2008, two days after landfall of Hurricane Ike (bottom). Yellow arrows mark
features visible in each image. Again, widespread inundation and persistent flooding are obvious. The white
foam at the bottom of the post-storm photo is due to the return flow cascading over the berm as the area drains
into the Gulf of Mexico.
23Figure 18. Oblique aerial photography near McFaddin Wildlife Refuge, Texas (Location 10, Figure 8), on
September 9, 2008 (top) and September 15, 2008, two days after landfall of Hurricane Ike (bottom). Yellow
arrows mark features visible in each image. Evidence of widespread inundation is apparent. The flooded area
continues to drain through a channel that cuts through the roadway. The dunes have been eroded and
dissected. Backflow through this area transported sediment offshore.
244.1.5 Cameron Parish, Western Louisiana
The morphology of the western Louisiana coast (fig. 8, locations 11-13) is similar to that of the
Texas coastline north of the Bolivar Peninsula. Before the storm, dune elevations (or berms in the
absence of dunes) were low, ranging from only 1 to 2 m high. Landward of the beaches were low-lying
marshlands. The storm surge of 1 to 3 m overtopped the beach systems in many areas, and waves (figs.
19 and 20) eroded the shoreline landward. The town of Holly Beach, Louisiana, which was completely
destroyed by Hurricane Rita in 2005, was once again flooded by Hurricane Ike (fig. 21).
25Figure 19. Oblique aerial photography from Cameron Parish, Louisiana (Location 11, Figure 8), on September 9,
2008 (top) and September 15, 2008, two days after landfall of Hurricane Ike (bottom). Yellow arrows mark
features visible in each image. Widespread inundation and persistent flooding are obvious. Coastal change
includes both beach erosion and erosion of channels where water continues to flow seaward to the Gulf of
Mexico.
26Figure 20. Oblique aerial photography from Peveto Beach, Louisiana (Location 12, Figure 8), on September 9,
2008 (top) and September 15, 2008, two days after landfall of Hurricane Ike (bottom). Yellow arrows mark
features visible in each image. Evidence of widespread inundation includes erosion of the berm and channels
that drained the flooded area.
27Figure 21. Oblique aerial photography from Holly Beach, Louisiana (Location 13, Figure 8), from 2001-2008.
Yellow arrows mark features visible in each image. The first photo shows this area prior to landfall of Hurricane
Rita on September 24, 2005. Immediately after Rita's landfall, the September 28, 2005, photo shows
destruction of houses. Prior to Ike's landfall, on September 9, 2008 there is little evidence of a dune or berm on
this beach. Several houses and smaller structures have been rebuilt. On September 15, 2008, two days after
landfall of Hurricane Ike, the beach is eroded and there is evidence of overwash and persistent flooding.
4.2 Quantitative Topographic-Change Analysis
Last-return lidar data were analyzed to compare morphologic changes due to Hurricane Ike. The
morphologic analysis was optimized for identifying shorelines and dune height. The analysis required
interpolation to a gridded domain that was rotated parallel to the shoreline and had a resolution of 10 m
in the longshore direction and 2.5 m in the cross-shore direction. The interpolation method applies
spatial filtering with a Hanning window that is twice as wide as the grid resolution (Plant and others,
2002). Grids of pre- and post-storm lidar topography can be differenced over the entire overlapping
survey area to compute elevation or volume changes over various distances and to give a quick visual of
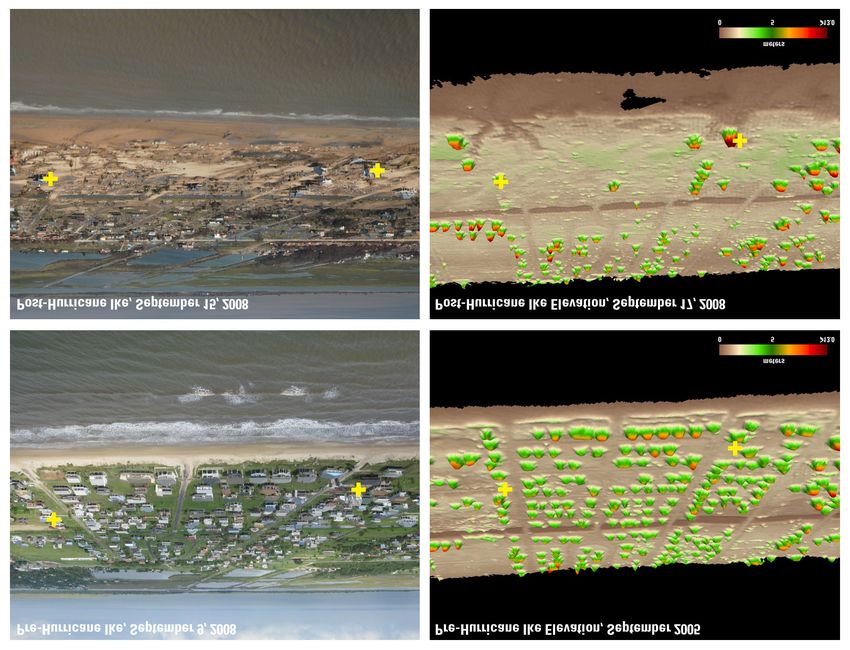
coastal change. For the town of Crystal Beach, Texas, on the Bolivar Peninsula, difference grids reveal
loss of homes, erosion of the shoreline, and reduction of dune elevations (figs. 22-24). Overwash
deposits (fig. 24) can be seen several hundred meters from the shoreline.
28Figure 22. September 2005 Experimental Advanced Airborne Research Lidar first-return lidar digital elevation
model of Crystal Beach, Texas.
29Figure 23. September 2008 Experimental Advanced Airborne Research Lidar first-return lidar digital elevation
model of Crystal Beach, Texas.
30Figure 24. Coastal Change at Crystal Beach, Texas, due to Hurricane Ike. The coastal change between the two
dates is determined from the difference between the two datasets. For the coastal-change figure, red indicates
at least 1 m of erosion and blue indicates at least 1 m of deposition. The spatial coverage of the two data sets
differs and the 2008 mission had more extensive coverage than the 2005 mission in this area.
4.2.1 Dune Elevation Change
Gridded lidar data were used to estimate changes in elevation and position of the frontal sand
dune or berm system (Stockdon and others, in press). Dune or berm-elevation change is calculated as
the difference between elevation of the pre-storm dune crest (September 2005) and the post-storm
elevation (September 2008) (fig. 25A). The elevation change is estimated at the location of the pre-
storm dune crest.
Extreme elevation changes of about 3 m were observed near Crystal Beach, Texas, which is
located on the Bolivar Peninsula and was in the right-front quadrant of the hurricane impact zone.
Dune-height changes exceeding 1 m were observed more than 60 km to the right of the landfall position.
31Dune-height changes exceeding 1 m were observed as far as 40 km to the left of landfall. In Galveston,
Texas, the seawall is considered to be the dune crest and the elevation change is roughly 30 cm,
consistent with the previously determined vertical offset.
4.2.2 Shoreline Change
From each row of the shore-parallel-oriented grids, the cross-shore position of the datum-based
shoreline was extracted (Stockdon and others, 2002). The shoreline vertical datum was defined to be
0.37 m above mean sea level, based on NAVD88 vertical datum and GEOID96 model. These shoreline
positions are compared to shorelines from the pre-storm survey, providing a quantitative description of
shoreline change. Shoreline change is calculated as the difference between the pre-storm shoreline
(September 2005) and the post-storm shoreline from the EAARL survey of September 17, 2008 (fig.
25B). Uncertainties in shoreline position vary due to data noise and beach slope, but typical errors in
shoreline position are on the order of 1-2 m (Stockdon and others, 2002). Because the surveys span 3
years, the shoreline change can be both storm-induced short-term and background long-term change.
Shoreline erosion of 150 m was observed near Gilchrist, Texas. More than 50 m of shoreline
erosion was experienced over a wide region from the seawall extending 15 km to the west. The area of
positive shoreline change at the south end of Galveston Island is related to spit formation at San Luis
Pass and may not be related to Hurricane Ike. The area of positive shoreline change 80 km to the right
of landfall is due to the seaward transport of sediment as storm water drained from the marshes (fig. 18).
4.2.3 Beach-Volume Change
Volume-change calculations were performed by contouring the topography at a fixed vertical
datum, which was set at mean high water from tidal records (Weber and others, 2005). The volume is
calculated between the cross-shore location of the pre-storm dune base and the pre-storm shoreline.
This eliminates complications from structures and vegetation, which generally are located landward of
the dune base. Beach volume change was calculated as the difference between the September 2005 and
September 2008 surveys (fig. 25C).
Volume losses typically follow the same pattern as the shoreline changes in the region to the
west of Galveston. This implies that sediment lost due to erosion was not deposited farther landward.
East of landfall, volume changes were highly variable. Some areas, such as the region between Crystal
Beach and Gilchrist, Texas, experienced substantial volume loss. However, the town of Crystal Beach,
Texas, experienced little net sediment loss. This is consistent with the appearance of overwash deposits
that presumably contain the sediment that was eroded from the shoreline and dunes (fig. 24). The
positive volume change near the San Luis Pass at the south end of Galveston Island is likely long-term
sediment accumulation at the inlet. Volume change along the seawall of Galveston is positive due to the
30-cm relative offset.
32Figure 25. Hurricane Ike (A) dune-elevation change (B) shoreline change (C) and beach-volume change. Blue
lines indicate the center of the towns of Galveston, Crystal Beach, and Gilchrist, Texas.
5. Acknowledgments
The USGS National Assessment of Coastal Change Hazards Project thanks the many scientists
and support staff who invested long hours during the 2008 hurricane season. Specifically, we thank the
EAARL research team (Wayne Wright and Richard Mitchell) and ground surveyor (B.J. Reynolds).
Colleagues at the University of New Orleans conducted the pre-storm photography mission (Karen
Westphal); colleagues in the St. Petersburg office helped with data collection (Dennis Krohn, Karen
Morgan, and Kristy Guy), processing and analysis (Charlene Sullivan, Peter Howd, Mark Hansen, Dave
Thompson, and Ann Marie Ascough), and web page development (Jolene Shirley).
33References Cited
Berg, R., 2009, Tropical cyclone report Hurricane Ike: National Oceanic and Atmospheric
Administration National Hurricane Center Report AL092008, 55 p.
Bonisteel, J., Nayegandhi, A., Brock, J.C., Wright, C.W., and Nagle, D.B., in press, Experimental
Advanced Airborne Research Lidar (EAARL) data processing manual: U.S. Geological Survey Open-
File Report 0000-0000.
Brock, J.C., Wright, C.W., Sallenger, A., Krabill, W., and Swift, R., 2002, Basis and methods of NASA
airborne topographic mapper lidar surveys for coastal studies: Journal of Coastal Research, vol. 18,
no. 1, p. 1-13.
East, J.W., Turco, M.J., and Mason, R.R., Jr., 2008, Monitoring inland storm surge flooding from
Hurricane Ike in Texas and Louisiana, September 2008: U.S. Geological Survey Open-File Report
2008-1365.
McGee, B.D., Goree, B.B., Tollett, R.W., Woodward, B.K., and Kress, W.H., 2006, Hurricane Rita
surge data, southwestern Louisiana and southeastern Texas, September to November 2005: U.S.
Geological Survey Data Series 220.
National Data Buoy Center, 2008, Reports from the National Data Buoy Center's stations during the
passage of Hurricane Ike: National Oceanic and Atmospheric Administration, Accessed at
http://www.ndbc.noaa.gov/hurricanes/2008/ike on February 10, 2009.
National Weather Service, 2008, Hurricane Ike storm surge estimates from damage surveys: National
Oceanic and Atmospheric Administration, Accessed at
http://www.srh.noaa.gov/hgx/projects/ike08/storm_surge_overview.htm on December 3, 2008.
Nayegandhi, A., Brock, J.C., and Wright, C.W., in press, Small-footprint, waveform-resolving lidar
estimation of submerged and sub-canopy topography in coastal environments: International Journal of
Remote Sensing.
Plant, N.G., Holland, K.T. and Puleo, J.A., 2002. Analysis of the scale of errors in nearshore
bathymetric data: Marine Geology, vol. 191, p. 71-86.
Powell, M.D., Houston, S.H., Amat, L.R., and Morisseau-Leroy, N., 1998, The HRD real-time
hurricane wind analysis system: Journal of Wind Engineering and Industrial Aerodynamics, vol. 77
78, p. 53-64.
Sallenger, A., Krabill, W.B., Swift, R.N., Brock, J., List, J., Hansen, M., Holman, R.A., Manizade, S.,
Sontag, J., Meredith, A., Morgan, K., Yunkel, J., Frederick, E., and Stockdon, H., 2003, Evaluation
of airborne topographic lidar for quantifying beach changes: Journal of Coastal Research, vol. 19 , no.
1, p. 125-133.
34Stockdon, H., Sallenger, A., List, J., and Holman, R., 2002, Estimation of shoreline position and change
using airborne topographic lidar data: Journal of Coastal Research, vol. 18, no. 3, p. 502-513.
Stockdon, H.F., Doran, K.S., and Sallenger, A.H., in press, Extraction of lidar-based dune-crest
elevations for use in examining the vulnerability of beaches to inundation during hurricanes: Journal
of Coastal Research Special Issue.
Weber, K.M., List, J.H., and Morgan, K.L.M., 2005, An operational mean high water datum for
determination of shoreline position from topographic lidar data: U.S. Geological Survey Open-File
Report 2005-1027.
35You can also read