COLORATION OF FLOWERS BY FLAVONOIDS AND CONSEQUENCES OF PH DEPENDENT ABSORPTION - MPG.PURE
←
→
Page content transcription
If your browser does not render page correctly, please read the page content below
ORIGINAL RESEARCH
                                                                                                                                            published: 08 January 2021
                                                                                                                                         doi: 10.3389/fpls.2020.600124

                                             Coloration of Flowers by Flavonoids
                                             and Consequences of pH Dependent
                                             Absorption
                                             Doekele G. Stavenga 1* , Hein L. Leertouwer 1 , Bettina Dudek 2 and
                                             Casper J. van der Kooi 3*
                                             1
                                              Zernike Institute for Advanced Materials, University of Groningen, Groningen, Netherlands, 2 Research Group
                                             Biosynthesis/NMR, Max Planck Institute for Chemical Ecology, Jena, Germany, 3 Groningen Institute for Evolutionary Life
                                             Sciences, University of Groningen, Groningen, Netherlands

                                             Flavonoid pigments are key determinants of flower colors. As absorption spectra of
                         Edited by:          flavonoids are known to be severely pH-dependent, cellular pH will play a crucial role
             Maria Gabriela Gutierrez
                           Camargo,          in flower coloration. The flavonoids are concentrated in the vacuoles of the flowers’
     São Paulo State University, Brazil      epidermal cells, and thus the pigments’ absorption spectra are modulated by the
                       Reviewed by:          vacuolar pH. Here we study the pH dependence of flavonoid absorption spectra in
                   Tsukasa Iwashina,
                                             extracts from flowers of two poppy species Papaver dubium (red) and Meconopsis
         National Museum of Nature
                 and Science, Japan          cambrica (orange), and a white and red Mandevilla sanderi variety. In the red poppy
                        Jair E. Garcia,      and Mandevilla flowers, absorption spectra of the cyanidin- and pelargonidin-based
           RMIT University, Australia
                        Zong-Xin Ren,        anthocyanins peak in the blue-green-wavelength range at low pH, but exhibit a distinct
   Kunming Institute of Botany (CAS),        bathochromic shift at higher pH. This shift to longer wavelengths is not found for the
                                 China
                                             blue-absorbing nudicaulin derivatives of M. cambrica, which have a similar absorption
                  *Correspondence:
                                             spectrum at low and high pH. The pH-dependent absorption changes of the white
                 Doekele G. Stavenga
                D.G.Stavenga@rug.nl          M. sanderi’s flavonoid remained restricted to the UV. An analysis of the spectra with
     orcid.org/0000-0002-2518-6177           logistic functions suggests that the pH-dependent characteristics of the basic states of
               Casper J. van der Kooi
              C.J.van.der.Kooi@rug.nl        flavonols and anthocyanins are related. The implications of tuning of pH and pigment
     orcid.org/0000-0003-0613-7633           absorption spectra for studies on flower color evolution are discussed.

                   Specialty section:        Keywords: flavonol, anthocyanin, nudicaulin, carotenoid, pollination, Papaver, Mandevilla
         This article was submitted to
    Plant Development and EvoDevo,
               a section of the journal     INTRODUCTION
            Frontiers in Plant Science
         Received: 28 August 2020           The plant kingdom harbors a remarkable diversity in flower colors. This colorful richness arose
      Accepted: 08 December 2020            mostly because their coloration aid flowers in attracting pollinators, thereby enhancing the plants’
       Published: 08 January 2021           reproductive success (van der Kooi and Ollerton, 2020). The visibility of a flower, and thus its
                             Citation:      attractiveness, is principally determined by the wavelength dependence of the fraction of incident
       Stavenga DG, Leertouwer HL,          light that is back-scattered. Whereas the backscattering is determined by the inhomogeneous
 Dudek B and van der Kooi CJ (2021)         structuring of the petals, the color of the backscattered light mainly depends on the flower’s
  Coloration of Flowers by Flavonoids
                                            pigmentation (van der Kooi et al., 2016). Presumably, the pigment type is broadly correlated with
                   and Consequences
        of pH Dependent Absorption.
                                            pollination ecology, with flower colors being tuned to the visual system of the pollinators (Harborne
         Front. Plant Sci. 11:600124.       and Smith, 1978; Chittka and Menzel, 1992; Brouillard and Dangles, 1994; de Camargo et al., 2019;
      doi: 10.3389/fpls.2020.600124         Shrestha et al., 2019; van der Kooi et al., 2019).

Frontiers in Plant Science | www.frontiersin.org                                    1                                         January 2021 | Volume 11 | Article 600124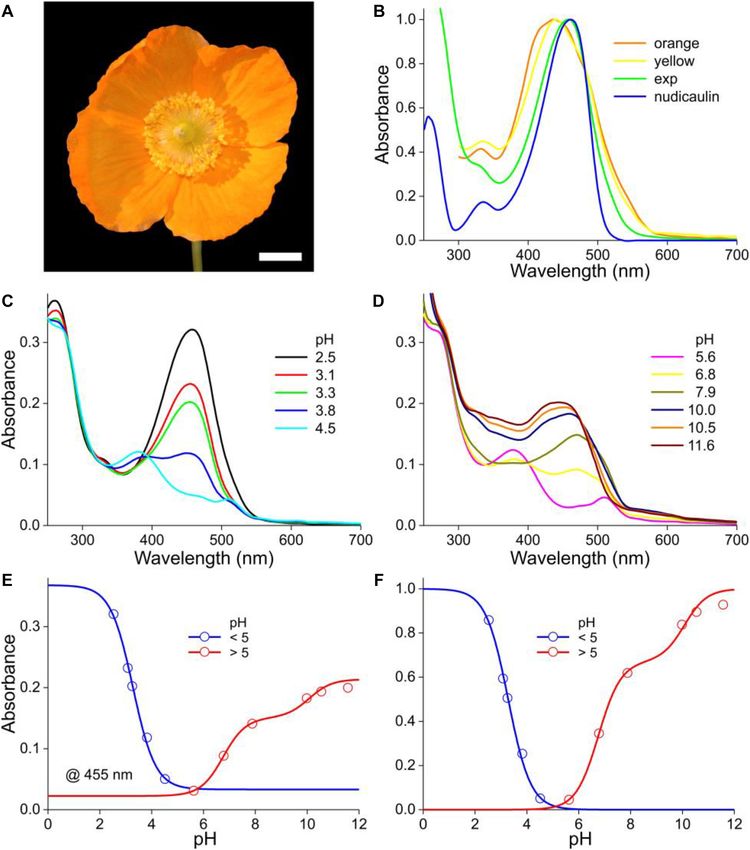
Stavenga et al.                                                                                                       pH Dependence of Floral Pigments

    The most common flower pigments are the carotenoids and                 two different-colored varieties of Mandevilla sanderi (also
flavonoids (Grotewold, 2006). The blue-absorbing carotenoids,               known as Dipladenia). We conclude that the vacuolar pH
e.g. zeaxanthin, carotene, and lutein, create yellow tissues, and the       plays a crucial role for realizing strongly colored flowers
green-absorbing astaxanthin causes a red color (Yuan et al., 2002;          with anthocyanins that are attractive for pollinators and
Grotewold, 2006; Shafaa et al., 2007; Rasmussen et al., 2012). Of           discuss how pH is important for studies on the evolution of
the flavonoids, the flavonols absorb virtually exclusively in the UV        flower coloration.
and thus cause white to pale-yellow colors. Widespread flower
pigments are the spectrally variably absorbing anthocyanins,
which can confer red, blue, or purple colors to plant tissues (e.g.,        MATERIALS AND METHODS
Markham, 1982; Brouillard and Dangles, 1994). The anthocyanin
pigments, glycosides of anthocyanidin aglycons, are secondary               Plant Material and Photography
metabolites of land plants that can be biochemically detected               Long-headed poppies, P. dubium, were collected at road sides
in species as ancient as mosses (Bendz et al., 1962; Koes et al.,           in Groningen, Netherlands. The M. sanderi plants, “Sundaville
1994; Rausher, 2006; Campanella et al., 2014). The three major              White” and “Sundaville Red,” hereafter abbreviated as White
anthocyanin pigment types that are found in terrestrial plants              and Red, were obtained from local suppliers. Welsh poppies,
are cyanidin-3-glycoside (brick red), pelargonidin-3-glycoside              M. cambrica, were taken from a local garden. Macro-photographs
(orange/red), and delphinidin-3-glycoside (blue/purple), of                 of the flowers were made with a Canon EOS 7D.
which cyanidin is more present in primitive families, while
delphinidin is restricted to the more highly evolved angiosperm             Spectrophotometry of Flower Lobes and
plant families (Harborne and Williams, 2000).                               Extracts
    Anthocyanin pigments are water soluble and concentrated                 Reflectance spectra of flower lobes were performed with a
in the epidermal cells, where the pigments are most effective               bifurcated reflection probe. The light source was a deuterium-
in creating an intense coloration (van der Kooi et al., 2016).              halogen lamp [AvaLight-D(H)-S] and the spectrometer an
Importantly, the anthocyanins occur in the vacuoles, which often            AvaSpec-2048 (Avantes, Apeldoorn, Netherlands). Pigments
have a quite acidic pH (Pourcel et al., 2010; Passeri et al.,               were extracted from 1 to 5 cm2 -sized petal or lobe pieces in
2016). The acidic vacuolar pH is probably intimately related to             a ∼40 ml solution of 50:1 methanol: 1 M hydrochloric acid
the severe pH dependence of the flavonoid absorption spectra                (MeOH and HCL purchased from Sigma Aldrich, Steinheim,
(e.g., Jurasekova et al., 2014; Tang et al., 2019). The factors and         Germany). Absorbance spectra of the extracted pigments were
mechanisms determining the vacuolar pH thus play a central role             measured immediately after the extraction in 10 mm light path
in flower coloration and are important for pollination.                     quartz cuvettes at room temperature. The pH of the extract,
    We previously investigated how pigment absorption and                   measured with a calibrated pH meter, was modified by adding
scattering together determine the colors of the flowers of a few            adequate amounts of KOH solution. The pH-dependence of
poppy species (van der Kooi and Stavenga, 2019; Dudek et al.,               the absorbance (or optical density D), was evaluated at a few
2020; Martínez-Harms et al., 2020). We thus found that the                  different wavelengths.
flowers of the common poppy (Papaver rhoeas) in the Middle                     When a medium contains more than one pigment, and the
East exhibit a low UV-reflectance due to a considerable amount              concentration of one pigment changes due to the action of
of the flavonols kaempferol and quercetin, but those in Germany             some agent (e.g., a change in pH), the different components
have much less of the flavonols and hence have a distinct UV                of the process of the pigment changes can be separated by
reflectance (Dudek et al., 2020). The anthocyanins responsible              subtracting the constant background absorbance caused by the
for the bright red colors of P. rhoeas and the related long-                other pigments. When the absorbance increased with increasing
headed poppy (Papaver dubium) are cyanidin and pelargonidin                 pH the values were approximated by
glycosides (Scott-Moncrieff, 1936; Acheson et al., 1956, 1962;
                                                                                                           n
Harborne, 1958; Dudek et al., 2020). The in situ absorbance                                                X
spectra of the red flowers of the European P. rhoeas and                                            D=          Ai Fi + B                          (1a)
P. dubium are very similar, but P. dubium appears to have a lower                                          i

concentration of pelargonidin (Figure 6A in van der Kooi and                and when the absorbance decreased with increasing pH by
Stavenga, 2019).
                                                                                                      n
    Previous investigations on the pH dependence of pigments                                          X
mostly concentrated on single anthocyanins in vitro, or                                         D=         Ai (1 − Fi ) + B                       (1b)
                                                                                                       i
studied the influence of pH on the complex mechanisms of
blue flower coloration (Mazza and Brouillard, 1987; Yoshida                 Here Fi is a logistic function, with parameter pKi
et al., 2009). Here we investigate how the absorbance spectra                                            h                i
of the flavonoid pigments depend on pH. We chose two                                             Fi = 1/ 1 + 10−(pH−pKi )                          (1c)
sets of species/varieties that are roughly similar in anatomy
and backscattering, but differ in coloration due to different               which accounts for n = 1 or 2 pH-dependent components with
pigmentation. We thus compare flowers of P. dubium (red),                   amplitude Ai and background B. We evaluated the absorbance
the related Welsh poppy Meconopsis cambrica (orange), and                   changes at those critical wavelengths where the changes of

Frontiers in Plant Science | www.frontiersin.org                        2                                      January 2021 | Volume 11 | Article 600124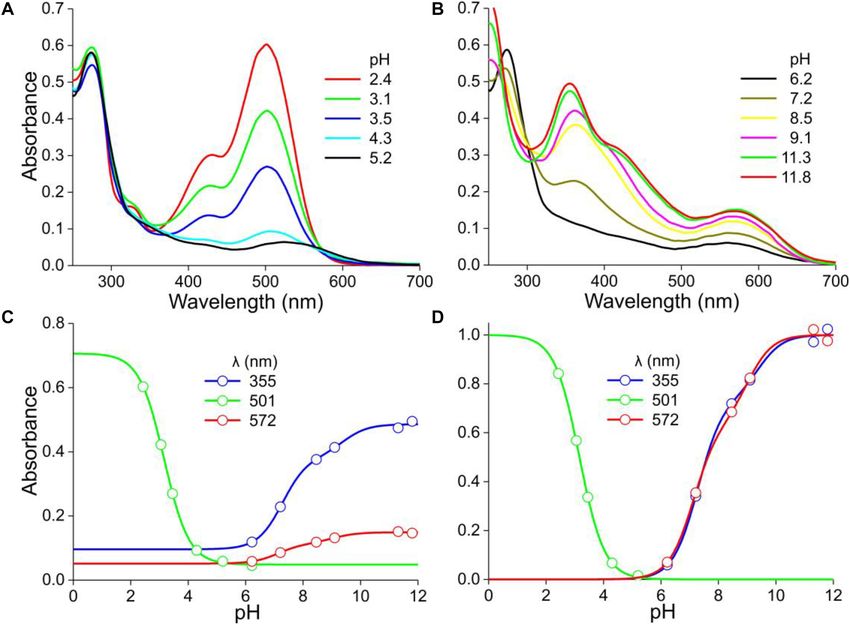
Stavenga et al.                                                                                                                  pH Dependence of Floral Pigments

pigment states were large. The pK-values of the components                              We have added to Figures 1C,D the absorption spectra
resulted from fits of Eq. 1 to the measurements.                                     of quercetin and kaempferol glycosides, because they were
                                                                                     also identified in P. rhoeas flowers (Dudek et al., 2020).
                                                                                     These flavonols have the same hydroxylation pattern and are
                                                                                     derived from the same precursor as the two anthocyanins. The
RESULTS                                                                              contribution of the two flavonols to the measured absorbance
                                                                                     spectra is clearly minor, in agreement with reflectance and
Papaver dubium                                                                       transmittance spectra measured on intact P. dubium flowers,
The flowers of the longheaded poppy, P. dubium, display an                           which also indicated that absorption in the UV is very moderate
almost homogeneous, bright-red color (Figure 1A). However,                           (see Figures 1E,F of van der Kooi and Stavenga, 2019).
absorbance spectra measured at the distal and proximal flower                           The anthocyanin spectra severely depend on pH
areas differ distinctly in amplitude as well as shape, which shows                   (Figures 2, 3). Figures 2A,B show how the absorbance
that the pigmentation causing the red color is not due to one                        spectra of a flower extract (the case of the experimental spectrum
pigment that is distributed inhomogeneously (Figure 1B).                             of Figure 1C) change when the pH gradually increases. For
   We investigated the pigments in methanol extracts from                            pH < 5, the absorbance in the blue-green wavelength range
different flowers of P. dubium, which yielded bright red solutions.                  decreases about proportionally (Figure 2A). The absorbance
Figures 1C,D show two exemplary cases where the measured                             values assessed at the peak wavelength, 512 nm, are well
absorbance spectra (exp) have rather different shapes, with peak                     approximated with a one-component logistic function (using
wavelengths at 512 and 501 nm, respectively. These experimental                      Eqs 1b,c), yielding pK = 3.1 (Figure 2C), which suggests the
spectra closely resemble the absorption spectra of cyanidin and                      pH-dependent transition of two pigment states.
pelargonidin glycosides, the two fundamental anthocyanidins                             For pH > 5, the absorbance in the ultraviolet (UV-A; peak
that were isolated from flowers of the common poppy P. rhoeas,                       wavelength ∼373 nm) as well as orange/red wavelength range
which have peak wavelengths 521 and 507 nm, respectively                             (peak wavelength ∼631 nm) steadily increases. The absorbance
(Figures 1C,D; from Dudek et al., 2020). We hence conclude                           values of the pH-dependent spectra at 373 nm approximated with
that P. dubium flowers contain variable amounts of cyanidin                          a two-component logistic function (using Eqs 1a,c) yielded pK-
and pelargonidin derivatives, in agreement with previous studies                     values of 6.6 and 9.0. The absorbance values at 631 nm could also
(Scott-Moncrieff, 1936; Acheson et al., 1956, 1962).                                 be well described by a two-component logistic function, yielding

  FIGURE 1 | Absorbance spectra of the long-headed poppy Papaver dubium. (A) A P. dubium flower; scale bar 1 cm. (B) Absorbance spectra of a proximal and distal
  petal area (from van der Kooi and Stavenga, 2019). (C) Absorbance spectrum of a flower extract (exp; normalized spectrum for pH = 2.5 of Figure 2A) compared
  with the spectrum of isolated cyanidin; the spectrum of quercetin is added. (D) Absorbance spectrum measured of another flower extract (exp; normalized spectrum
  for pH = 2.4 of Figure 3A) compared with the spectrum of isolated pelargonidin; the spectrum of kaempferol is added (flavonoid spectra from Dudek et al., 2020).

Frontiers in Plant Science | www.frontiersin.org                                 3                                        January 2021 | Volume 11 | Article 600124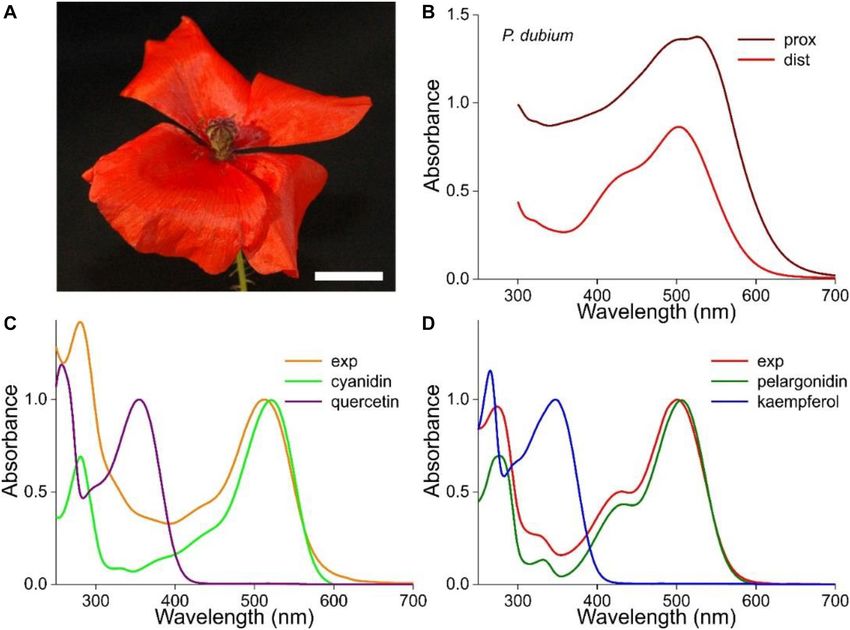
Stavenga et al. pH Dependence of Floral Pigments
FIGURE 2 | pH dependence of P. dubium pigments. (A) Absorbance spectra of extract for pH < 5. (B) Absorbance spectra for pH > 5. (C) Absorbance values
derived from (A,B) at a few wavelengths, fitted with logistic functions. (D) The data of (C) with background subtracted and normalized [green symbols in (C,D)
derived from (A), magenta symbols from another measurement series].
similar pK values: pK = 6.0 and 9.1 (Figure 2C). Subtraction throughout the visible wavelength range, but the low reflectance
of the background and subsequently normalizing the data of in the UV revealed the presence of UV-absorbing pigments; a
Figure 2C yielded Figure 2D. common feature in (to humans) white flowers (Chittka et al.,
Figures 3A,B show how the absorbance spectra of another 1994; Kevan et al., 1996). Methanol extracts of the White flower’s
flower extract (that of the experimental spectrum of Figure 1D) lobes had for pH < 5 virtually identical absorbance spectra, with
change when the pH gradually increases. For pH < 5, the peak wavelength ∼320 nm. At pH > 5, with increasing pH the
absorbance values at the peak wavelength, 501 nm, fitted with a absorbance increased and shifted bathochromically, peaking at
one-component logistic function, yielded pK = 3.2 (Figure 3C), 385 nm (Figure 4D). An isosbestic point at 337 nm suggested
very similar to the pK = 3.1 of Figure 2C. For pH > 5, fitting the existence of two pigment states with different absorption
a two-component logistic function to the absorbance values at spectra. Absorbance difference spectra calculated by subtracting
355 nm yielded pK = 7.3 and 9.4, whilst those at 572 nm produced the absorbance spectrum of pH = 2.9 from the measured spectra
pK = 7.1 and 9.0 (Figure 3C). Subtraction of the background indeed had a very similar shape (Figure 4G). Figure 4J shows
and subsequently normalizing the data of Figure 3C yielded normalized spectra of the low-pH (acid) and high-pH (alkaline)
Figure 3D. states. To further characterize this, we evaluated the absorbance
The pK-values of the logistic functions in Figures 2C,D, 3C,D spectra of Figure 4D at λ = 388 nm, the peak wavelength of the
appear to be very similar, which suggests that the same pH- difference spectra (asterisks in Figure 4M). The data could only
dependent structural changes govern the absorbance changes of be well-fitted with a two-component logistic function (Eqs 1a,c),
cyanidin and pelargonidin upon decreasing acidity or increasing which yielded pK-values 6.9 and 8.8, thus indicating that more
alkalinity (Pina et al., 2012). To further investigate this, we than two pigment states are involved.
performed the same experimental approach on extracts obtained The pigments extracted from the flower lobes of M. sanderi
from flowers of the White and Red Sundaville morphs of M. “Red Sundaville” (Figure 4B) behaved rather differently. At low
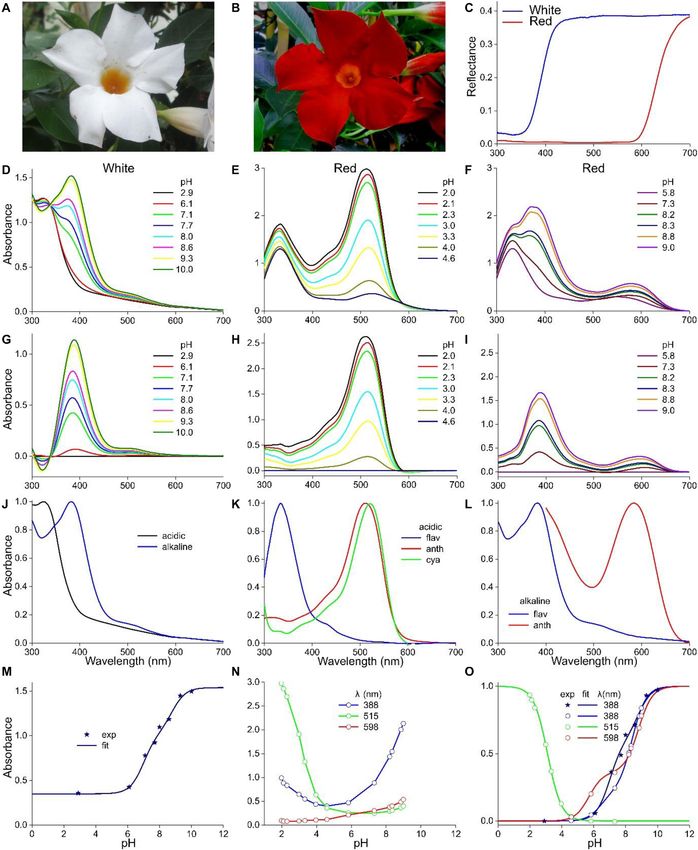
sanderi plants (Figures 4A,B). pH-values, the absorbance spectrum featured two bands, peaking
at 330 nm and 515 nm. Increasing the pH-value from 2.0 to 4.6
Mandevilla sanderi caused a severe drop of the main band in the green wavelength
The flower lobes of M. sanderi “White Sundaville” are brightly range (Figure 4E). To analyze this pH-dependent change, we
white colored (Figure 4A), which might suggest the absence of calculated again absorbance difference spectra, by subtracting the
pigments, but reflectance spectra show that this is certainly not absorbance spectrum measured at pH = 4.6 from the absorbance
the case (Figure 4C). The lobe’s reflectance was indeed high spectra measured at pH < 5. The resulting difference spectra were
Frontiers in Plant Science | www.frontiersin.org 4 January 2021 | Volume 11 | Article 600124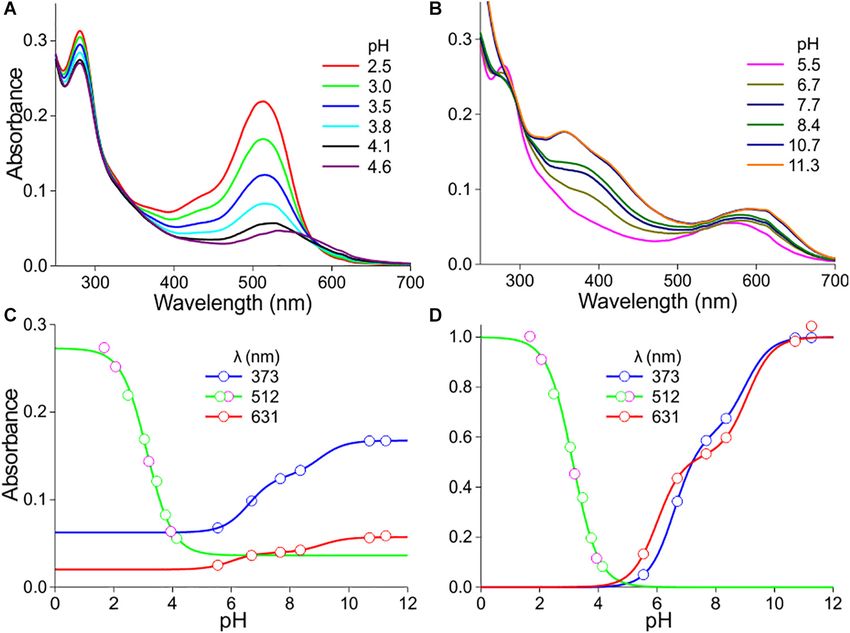
Stavenga et al.                                                                                                                     pH Dependence of Floral Pigments

  FIGURE 3 | Absorbance spectra of another P. dubium flower extract at various pH. (A) Absorbance spectra for pH < 6. (B) Absorbance spectra for pH > 6.
  (C) Absorbance values derived from (A,B) at a few wavelengths, fitted with logistic functions. (D) The data of (C) with background subtracted and normalized.

about proportional to each other, suggesting again a proportional                      the set of spectra again by subtracting the absorbance spectrum
change in a pigment state depending on the pH (Figure 4H). The                         measured at pH = 5.8 from the other spectra measured at pH > 5,
average of the spectra of Figure 4H, which is shown normalized                         which yielded absorbance difference spectra with two absorbance
in Figure 4K (anth), closely resembles the cyanidin spectrum of                        bands with peak wavelengths 388 and 598 nm (Figure 4I).
Figure 1C (Figure 4K, cya).                                                                We subsequently evaluated the absorbance spectra of
   We analyzed the pH-dependence of this pigment state by                              Figures 4E,F at these peak wavelengths (Figure 4N). The
assessing the absorbance at its peak wavelength (515 nm) as                            absorbance values at 388 nm as a function of pH showed a
a function of pH (Figure 4N). The pH-dependence could be                               biphasic behavior, with first a decline between pH = 2 and 5
well fitted with a single-component logistic function (Eqs 1b,c),                      (Figure 4N). This absorbance decline is apparently due to the fall
yielding pK = 3.1, identical to the P. dubium case of Figure 2.                        in the cyanidin concentration (Figure 4H), as the data for pH < 5
This confirms that cyanidin is the prominent anthocyanin                               were well approximated by Eqs 1b,c, using pK = 3.1. For pH > 5,
that determines the coloration of M. sanderi “Red Sundaville.”                         the 388 nm data could be well fitted with Eqs 1a,c (n = 2), yielding
Yet, Figures 4E,H clearly show that the flowers contain, in                            pK = 6.4 and 8.4.
addition to the blue-green absorbing cyanidin, a UV-absorbing                              We finally analyzed the pH dependence of the long-
pigment. We, therefore, normalized the spectra of Figure 4E,                           wavelength absorbance band by estimating the absorbance at
subtracted the average anthocyanin spectrum (Figure 4K, anth)                          598 nm as a function of pH and fitting Eqs 1a,c to the data,
and then normalized the results. This yielded an absorbance                            which yielded pK = 5.7 and 8.8 (Figure 4N). Subtracting
spectrum peaking at 325 nm, which we tentatively assume to                             the background and normalizing the data as before yielded
be due to flavonols (Figure 4K, flav). However, quite possibly                         Figure 4O. Taking the calculated pH-dependencies into account,
the pigment may actually be another flavonoid, e.g., a flavone                         we finally analyzed the difference spectra of Figure 4I, which
(Markham, 1982).                                                                       produced the normalized absorbance spectrum of a UV- and a
   When the pH increased to above five, an absorbance band                             red-absorbing pigment (Figure 4L).
peaking around 600 nm gradually emerged. In addition, the UV-
band shifted bathochromically, resulting in a prominent band                           Meconopsis cambrica
peaking at 380 nm (Figure 4F), which resembles the absorbance                          The Welsh poppy, M. cambrica, features bright yellow or orange
band peaking at 380 nm that emerged with pH > 5 in the case of                         flowers. The normalized absorbance spectra of intact yellow
the White lobe’s extract (Figure 4D). We furthermore analyzed                          and orange flowers have very similar shapes (Figures 5A,B),

Frontiers in Plant Science | www.frontiersin.org                                   5                                         January 2021 | Volume 11 | Article 600124
Stavenga et al.                                                                                                                      pH Dependence of Floral Pigments

  FIGURE 4 | Mandevilla sanderi flowers and absorbance spectra of extracted pigment at various pH values. (A) Flower of a White Sundaville morph with white lobe
  and yellow tube. (B) Flower of a Red Sundaville morph with red lobe and orange tube. (C) Reflectance spectra of the lobes of the flowers of panels (A,B).
  (D) Absorbance spectra of pigment extracted from a White lobe. (E) Absorbance spectra of pigment extracted from a Red lobe, measured at low pH values. (F) as
  (E), but spectra measured at higher pH-values. (G) Absorbance difference spectra obtained by subtracting the spectrum for pH = 2.9 from the spectra of panel (D).
  (H) Absorbance difference spectra obtained by subtracting the spectrum for pH = 4.6 from the spectra of panel (E). (I) Absorbance difference spectra obtained by
  subtracting the spectrum for pH = 5.8 from the spectra of panel (F). (J) Normalized absorbance spectra of the White lobe in the acid and alkaline state.
  (K) Normalized absorbance spectra of flavonols and anthocyanins of the Red lobe in the acid state, together with the cyanidin spectrum of Figure 1C.
  (L) Normalized absorbance spectra of the flavonols and anthocyanins of the Red lobe in the alkaline state. (M) Absorbance values at 388 nm of the spectra of panel
  (D) as a function of pH (symbols), fitted with Eq. 1 (solid line). (N) Absorbance values at 388, 515, and 598 nm of the spectra of panels (E,F) as a function of pH.
  (O) Background subtracted and normalized absorbance values of panels (M,N) together with fits.

Frontiers in Plant Science | www.frontiersin.org                                   6                                         January 2021 | Volume 11 | Article 600124
Stavenga et al.                                                                                                                   pH Dependence of Floral Pigments

  FIGURE 5 | The Welsh poppy M. cambrica and pH-dependent absorbance spectra. (A) A flower; scale bar 1 cm. (B) Normalized absorbance spectra of petals of
  orange and yellow morphs (from van der Kooi and Stavenga, 2019), the normalized spectrum of panel (C) for pH = 2.5 (exp), and that of nudicaulin (from Dudek
  et al., 2016). (C) Absorbance spectra for pH < 5. (D) Absorbance spectra for pH > 5. (E) Absorbance values derived from panels (C,D) at 455 nm (symbols), fitted
  with logistic curves. (F) The data of (E) with background subtracted and normalized.

suggesting the presence of the same pigment, but with the yellow                     wavelength range as that of the acid pigment state. The resulting
flowers having a lower concentration (Figure 6B of van der Kooi                      absorbance spectra peak in the blue wavelength range at 460 nm
and Stavenga, 2019). Yellow M. cambrica flowers are colored                          at strongly acidic pH, at 510 nm at weakly acidic and at 445 nm
by nudicaulins (Tatsis et al., 2013), and therefore Figure 5B                        at alkaline pH. To investigate the pH-dependence of the three
shows the absorption spectrum of nudicaulin glycoside isolated                       phases, we assessed the absorbance values of the spectra of both
from Papaver nudicaule (from Dudek et al., 2016). It indeed                          Figures 5C,D at 455 nm. Fitting the pH < 5 data with a one-
closely resembles the absorbance spectrum of methanol extracts                       component logistic function yielded pK = 3.3, and fitting the
of orange flowers at low pH (Figure 5B, exp).                                        pH > 5 data with a two-component logistic function yielded
   As in the previous cases, the absorbance of M. cambrica                           pK = 6.6 and 10.0. The absorbance spectra (or their difference
flower extracts decreases steadily with increasing pH (Figure 5C).                   spectra) could not be approximated with a restricted set of
Similar as in P. nudicaule petal extracts, between pH = 4 and                        absorbance spectra similar to the cases treated above. A separate,
7 a minor absorbance band at 510 nm arises (Dudek et al.,                            more extensive approach will be necessary to unravel the multiple
2018). However, with increasing alkaline pH the absorbance band                      participating components. We also analyzed the yellow form of
shifts again to lower wavelengths and rises in about the same                        M. cambrica. It suffices to note here that the absorbance spectra

Frontiers in Plant Science | www.frontiersin.org                                 7                                         January 2021 | Volume 11 | Article 600124
Stavenga et al.                                                                                                          pH Dependence of Floral Pigments

of extracts of yellow flowers showed a similar pH-dependence as            Rakić et al., 2015; Dangles and Fenger, 2018; Sigurdson et al.,
that of the orange form, with only very slight spectral differences.       2018), which process can be approximated with a two-component
                                                                           logistic function. The differences in the absorbance spectra of
                                                                           Figures 2, 3 in the long-wavelength range suggest that the
DISCUSSION                                                                 absorption spectra of the quinonoidal bases depend on being
                                                                           cyanidin- or pelargonidin-based derivatives.
We have studied how floral pigment absorbance depends on                       The absorbance spectra of the M. sanderi “Red Sundaville”
pH in a few flowers with flavonoid and flavonoid-derived                   flower extracts show in the visible wavelength range a similar
pigments. We chose two different poppy species that have                   pH-dependence as that of the cyanidin-dominated P. dubium
a largely similar anatomy and backscattering but differ in                 (Figures 3A,B, 4E,F), but the spectra in the UV-wavelength range
pigmentation and coloration (van der Kooi and Stavenga,                    differ considerably. We, therefore, investigated the flowers of
2019). We furthermore investigated two Mandevilla varieties.               the M. sanderi “White Sundaville,” because they contain only
Interpreting studies on cultivated plants from an ecological and           UV-absorbing pigment (Figures 4A,D), having at low pH an
evolutionary point of view needs caution, because it is hard to            absorbance peak wavelength of 325 nm and at high pH 382 nm
know what phenotypic traits have arisen in nature and have                 (Figure 4J). We tentatively attribute this to flavonol, because
been selected by plant breeders. Nevertheless, cultivated plants           its pH-dependence follows a two-component logistic function
can be useful to study specific optical properties, particularly           that is very similar to that of the anthocyanin. The same (or
when cultivated lines greatly vary in one specific trait. In the           very similar) flavonoid pigment appears to exist in the Red
case of the studied Mandevilla plants, cultivation resulted in             Sundaville (Figure 4O).
flowers of similar thickness and backscattering (two important                 Flavonoids have been identified as colorants in numerous
aspects of flower coloration; van der Kooi et al., 2016), but with         flowers (Iwashina, 2003; Zhao and Tao, 2015). For instance, in
highly different types of pigmentation (Figure 4C). The two                methanol extracts of Dipladenia martiana flowers, the flavonols
poppy species and the two Mandevilla varieties thus provide a              quercetin and kaempferol and several related components were
valuable resource for studies on the fundamental pigmentation              identified (de Carvalho et al., 2001). The spectral analysis of the
properties of flowers.                                                     investigated Mandevilla (Dipladenia) flowers suggests that the
   Absorbance spectra of methanol extracts generally                       different types of pigment (flavonols in the White morph versus
corresponded well with absorbance spectra measured from                    flavonols and anthocyanins in the Red morph) behave similarly
intact petals, although slight differences in spectral shape were          with regard to pH changes.
encountered in all studied cases. Detailed chemical analyses                   The Welsh poppy, M. cambrica, is a special case as its flowers
revealed that flowers contain a multitude of flavonoids. For               are colored by nudicaulins, an unusual group of indole alkaloids,
instance, the flowers of the common corn poppy, P. rhoeas,                 which are generated by combining anthocyanins with an indole
contain several glycosides of the flavonols kaempferol and                 (Tatsis et al., 2013; Dudek et al., 2016, 2018; Devlin and Sperry,
quercetin as well as of the anthocyanidins cyanidin and                    2020). We note that the pH-dependent processes of M. cambrica‘s
pelargonidin (Dudek et al., 2020). The diversity in the absorbance         nudicaulin can be described by logistic functions with very
spectra thus is not surprising, as extracts differ in solvent and          similar pK-values as those of the anthocyanins (Table 1). The
concentration from the vacuolar conditions and may thus alter              nudicaulin pigments were analyzed in great detail in the Iceland
associative effects between pigments and solvent. Glycosylation            poppy, P. nudicaule (Tatsis et al., 2013; Dudek et al., 2016, 2018).
as well as acylation can distinctly modify the absorption                  Interestingly, the yellow stamens of the yellow flowers contained
spectrum of the flavonoids (Giusti et al., 1999; Dudek et al.,             carotenoids and not nudicaulins (Dudek et al., 2016). Yellow
2016). Furthermore, substantial spectral shifts can be exerted by          flowers generally contain carotenoids, which is also the case with
co-pigmentation (Mazza and Brouillard, 1990).                              the M. sanderi flowers, where carotenoids are expressed in the
   Considerable insight has been assembled concerning the                  flower tube (see Figures 4A,B). In the yellow/orange-colored
biosynthesis, the genetics, and the evolution of flower pigments,
especially of the carotenoids and anthocyanins (Koes et al., 1994;
Mol et al., 1998; Grotewold, 2006; Rausher, 2006; Glover and
                                                                           TABLE 1 | Summary of the pK-values obtained for the pH-dependent processes
Martin, 2012; Campanella et al., 2014), but detailed studies on            in the studied flower extracts.
the pH dependence of pigment absorbance spectra, especially
of complex pigment compositions, are scarce. The absorbance                Flower                         pH < 5             pH > 5             pH > 5
                                                                                                                          (λ < 500 nm)       (λ > 500 nm)
spectra of the cyanidin and pelargonidin derivatives encountered
in the extracts of P. dubium flowers severely depend on pH. For            P. dubium 1 (Figure 2)           3.1              6.6/9.0            6.0/9.1
pH < 5, the pH dependence is well described by a declining,                P. dubium 2 (Figure 3)           3.2              7.3/9.4            7.1/9.0
single-component logistic function with pK ∼ 3. This conforms              White M. sanderi (Figure 4)       –               6.9/8.8                –
to the general characteristic of flavylium compounds, where                Red M. sanderi (Figure 4)        3.1              6.4/8.4            5.7/8.8
the distinctly absorbing cation converts into colorless hemiketal          M. cambrica (Figure 5)           3.3             6.6/10.0                –
and cis- and trans-chalcone forms (Mazza and Brouillard, 1990;
                                                                           For pH < 5, a one-component logistic function was fitted to the absorbance
Pina et al., 2012). At higher pH various anionic quinonoidal               changes, while for pH > 5 in both the short- and long-wavelength ranges a
bases are created (Mazza and Brouillard, 1990; Pina et al., 2012;          two-component logistic function was used.

Frontiers in Plant Science | www.frontiersin.org                       8                                          January 2021 | Volume 11 | Article 600124
Stavenga et al. pH Dependence of Floral Pigments
flowers of M. cambrica we did not obtain convincing evidence modify the coloration, and that scattering and pigmentation
for anthocyanins. properties may be tuned for visual signaling to pollinators (van
The absorption spectra of floral pigments strongly depend on der Kooi et al., 2016, 2019; Stavenga et al., 2020). The emerging
pH, which has severe consequences for flower coloration. The picture is that flowers have a wide gamut of possibilities to tune
important question then is to know the vacuolar conditions in their coloration. A simple possibility is demonstrated by the
the flowers. Measurements of the pH of flower epidermal cells yellow and orange flowers of M. cambrica that merely differ
yielded values varying between 2.5 in a begonia cultivar and 7.5 in in concentration of essentially the same pigment (Figure 6B
morning glory cv. Heavenly Blue (Stewart et al., 1975). Curiously, of van der Kooi and Stavenga, 2019). That subtle pH changes
in the epidermal cells of flowers whose only anthocyanins were can greatly change the absorption spectrum of common flower
cyanidin glycosides, the associated colors widely varied, between pigments is important for studies on flower color evolution. The
strong pink, deep red, purple, and even moderate blue, whereas flower’s absorbance can be further modified by other factors as
the pH ranged from 3.1 to 5.5 (Stewart et al., 1975). In this pH co-pigmentation, self-association, and metal complexation. As
range, the anthocyanins’ absorption spectra have similar shapes. flowers are the advertisement flags for pollinators, the spectral
The absorption amplitude is at most half of the maximal value, properties of the floral pigments are presumably tuned to
and at higher pH-values it further diminishes. A solution to the optimize visibility. In comparison, the photoreceptor spectral
loss in absorption upon increasing pH is co-pigmentation, which sensitivities of the color vision systems of bees and birds are
stabilizes the acidic pigment state and can modify the spectral highly constrained to virtually fixed spectral values (Hart and
absorption (Mazza and Brouillard, 1990). Vorobyev, 2005; van der Kooi et al., 2021). Plants thus have
The anthocyanins are concentrated in the epidermal cells’ evolved a much greater flexibility in tuning the display of their
vacuoles, and therefore a crucial factor determining the flower’s flowers than the flexibility their pollinators have in adjusting their
color is the vacuole’s pH, which is highly dependent on an H+ - color discrimination system.
ATPase (Verweij et al., 2008; Yoshida et al., 2009). Minor changes
in pH can cause major changes in coloration. Indeed, a pH
change from 3.3 to 4.0 in the vacuoles in Hydrangea macrophylla DATA AVAILABILITY STATEMENT
sepals makes the color shift from blue to red (Yoshida et al.,
2003). A similar color change occurs in the morning glory cv. The original contributions presented in the study are included
Heavenly Blue during the flower-opening period, but it is here in the article/supplementary material, further inquiries can be
due to an unusual increase in vacuolar pH from 6.6 to 7.7 acting directed to the corresponding author/s.
on a tricaffeoylated anthocyanin, the heavenly blue anthocyanin
(Yoshida et al., 2009). We conclude that for the flowers studied in
the present paper, and probably for anthocyanin- and flavonol- AUTHOR CONTRIBUTIONS
based colors more broadly, vacuolar pH crucially determines the
pigment absorbance spectrum. DS performed the analysis, made figures, and wrote the
An intriguing question is how vacuolar pH, pigment manuscript. HL executed the chemical analysis. BD and CK gave
absorbance spectra, and structural aspects of flowers are tuned crucial input to the final manuscript. All authors contributed to
to optimize visibility to (local) pollinators. Previous studies the article and approved the submitted version.
demonstrated that regional differences exist in the coloration
of P. rhoeas, which can be linked to the color vision of local
pollinators, beetles in the Middle East, and bees in Europe (Dudek FUNDING
et al., 2020; Martínez-Harms et al., 2020). Also, Mandevilla
flowers are pollinated by different groups of pollinators, including This study was financially supported by the AFOSR/EOARD
bees, butterflies, and moths (De Araújo et al., 2014; Rubini Pisano (grant FA9550-15-1-0068, to DS) and NWO (Veni grant number
et al., 2019), which have different visual systems (van der Kooi 016.Veni.181.025, to CK).
et al., 2021). When considering the ultimate question of how
flower colors are tuned to the visual system of their pollinators,
disentangling the different structural as well as pigmentary ACKNOWLEDGMENTS
aspects that create the flower’s coloration is important.
We previously showed that in addition to pigments, the We thank Drs. J. Broos, J. Douglass, B. Schneider, and B. D. Wilts
reflection and scattering properties of the flower structures also for constructive comments at an early manuscript version.
REFERENCES genus. New Phytol. 61, 256–260. doi: 10.1111/j.1469-8137.1962.tb06
294.x
Acheson, R., Harper, J., and McNaughton, I. (1956). Distribution of Bendz, G., Martensson, O., and Terenius, L. (1962). Moss pigments. Acta Chem.
anthocyanin pigments in poppies. Nature 178, 1283–1284. doi: 10.1038/178 Scand. 16, 1183–1190. doi: 10.3891/acta.chem.scand.16-1183
1283a0 Brouillard, R., and Dangles, O. (1994). “Flavonoids and flower colour,” in The
Acheson, R., Jenkins, C., Harper, J. L., and McNaughton, I. (1962). Floral Flavonoids, ed. J. B. Harborne (London: Chapman and Hall), 565–588. doi:
pigments in Papaver and their significance in the systematics of the 10.1007/978-1-4899-2911-2_13
Frontiers in Plant Science | www.frontiersin.org 9 January 2021 | Volume 11 | Article 600124Stavenga et al. pH Dependence of Floral Pigments Campanella, J. J., Smalley, J. V., and Dempsey, M. E. (2014). A phylogenetic Martínez-Harms, J., Hadar, R., Márquez, N., Menzel, R., Shmida, A., Stavenga, examination of the primary anthocyanin production pathway of the plantae. D. G., et al. (2020). Enhanced UV-reflection facilitated a shift in the pollination Bot. Stud. 55:10. system of the red poppy, Papaver rhoeas (Papaveraceae). Plants 9:927. doi: Chittka, L., and Menzel, R. (1992). The evolutionary adaptation of flower 10.3390/plants9080927 colours and the insect pollinators’ colour vision. J. Comp. Physiol. A 171, Mazza, G., and Brouillard, R. (1987). Color stability and structural 171–181. transformations of cyanidin 3,5-diglucoside and four 3-deoxyanthocyanins Chittka, L., Shmida, A., Troje, N., and Menzel, R. (1994). Ultraviolet as a in aqueous solutions. J. Agric. Food Chem. 35, 422–426. doi: 10.1021/jf00075 component of flower reflections, and the colour perception of Hymenoptera. a034 Vision Res. 34, 1489–1508. doi: 10.1016/0042-6989(94)90151-1 Mazza, G., and Brouillard, R. (1990). The mechanism of co-pigmentation of Dangles, O., and Fenger, J. (2018). The chemical reactivity of anthocyanins and its anthocyanins in aqueous solutions. Phytochemistry 29, 1097–1102. doi: 10. consequences in food science and nutrition. Molecules 23:1970. doi: 10.3390/ 1016/0031-9422(90)85411-8 molecules23081970 Mol, J., Grotewold, E., and Koes, R. (1998). How genes paint flowers and seeds. De Araújo, L., Quirino, Z., and Machado, I. (2014). High specialisation in Trends Plant Sci. 3, 212–217. doi: 10.1016/s1360-1385(98)01242-4 the pollination system of Mandevilla tenuifolia (J.C. Mikan) Woodson Passeri, V., Koes, R., and Quattrocchio, F. M. (2016). New challenges for the design (Apocynaceae) drives the effectiveness of butterflies as pollinators. Plant Biol. of high value plant products: stabilization of anthocyanins in plant vacuoles. 16, 947–955. doi: 10.1111/plb.12152 Front. Plant Sci. 7:153. doi: 10.3389/fpls.2016.00153 de Camargo, M. G. G., Lunau, K., Batalha, M. A., Brings, S., de Brito, V. L. G., Pina, F., Melo, M. J., Laia, C. A., Parola, A. J., and Lima, J. C. (2012). Chemistry and and Morellato, L. P. C. (2019). How flower colour signals allure bees and applications of flavylium compounds: a handful of colours. Chem. Soc. Rev. 41, hummingbirds: a community-level test of the bee avoidance hypothesis. New 869–908. doi: 10.1039/c1cs15126f Phytol. 222, 1112–1122. doi: 10.1111/nph.15594 Pourcel, L., Irani, N. G., Lu, Y., Riedl, K., Schwartz, S., and Grotewold, E. (2010). de Carvalho, M. G., Carvalho Cranchi, D., Kingston, D. G., and Werle, A. A. The formation of anthocyanic vacuolar inclusions in Arabidopsis thaliana and (2001). Proposed active constituents of Dipladenia martiana. Phytother. Res. implications for the sequestration of anthocyanin pigments. Mol. Plant 3, 15, 715–717. doi: 10.1002/ptr.865 78–90. doi: 10.1093/mp/ssp071 Devlin, R., and Sperry, J. (2020). The curious yellow colouring matter of the Iceland Rakić, V. P., Ota, A. M., Skrt, M. A., Miljković, M. N., Kostić, D. A., Sokolović, poppy. Org. Biomol. Chem. 18, 5278–5286. doi: 10.1039/d0ob01162b D. T., et al. (2015). Investigation of fluorescence properties of cyanidin Dudek, B., Schneider, B., Hilger, H. H., Stavenga, D. G., and Martínez-Harms, and cyanidin 3-O-β-glucopyranoside. Hem. Ind. 69, 155–163. doi: 10.2298/ J. (2020). Highly different flavonol content explains geographic variations in hemind140203030r the UV reflecting properties of flowers of the corn poppy, Papaver rhoeas Rasmussen, H. M., Muzhingi, T., Eggert, E. M., and Johnson, E. J. (2012). (Papaveraceae). Phytochemistry 178:112457. doi: 10.1016/j.phytochem.2020. Lutein, zeaxanthin, meso-zeaxanthin content in egg yolk and their absence in 112457 fish and seafood. J. Food Comp. Anal. 27, 139–144. doi: 10.1016/j.jfca.2012. Dudek, B., Schnurrer, F., Dahse, H., Paetz, C., Warskulat, A., Weigel, C., et al. 04.009 (2018). Formation of nudicaulins in vivo and in vitro and the biomimetic Rausher, M. D. (2006). “The evolution of flavonoids and their genes,” in The synthesis and bioactivity of O-methylated nudicaulin derivatives. Molecules Science of Flavonoids, ed. E. Grotewold (New York, NY: Springer), 175–211. 23:3357. doi: 10.3390/molecules23123357 doi: 10.1007/0-387-28822-8_7 Dudek, B., Warskulat, A., and Schneider, B. (2016). The occurrence of flavonoids Rubini Pisano, A., Moré, M., Cisternas, M. A., Raguso, R. A., and Benitez-Vieyra, and related compounds in flower sections of Papaver nudicaule. Plants 5:28. S. (2019). Breakdown of species boundaries in Mandevilla: floral morphological doi: 10.3390/plants5020028 intermediacy, novel fragrances and asymmetric pollen flow. Plant Biol. 21, Giusti, M. M., Rodríguez-Saona, L. E., and Wrolstad, R. E. (1999). Molar 206–215. doi: 10.1111/plb.12924 absorptivity and color characteristics of acylated and non-acylated Scott-Moncrieff, R. (1936). A biochemical survey of some Mendelian factors for pelargonidin-based anthocyanins. J. Agric. Food Chem. 47, 4631–4637. flower colour. J. Genet. 32, 117–170. doi: 10.1007/bf02982506 doi: 10.1021/jf981271k Shafaa, M. W. I., Diehl, H. A., and Socaciu, C. (2007). The solubilisation pattern Glover, B. J., and Martin, C. (2012). Anthocyanins. Curr. Biol. 22, R147–R150. of lutein, zeaxanthin, canthaxanthin and β-carotene differ characteristically in Grotewold, E. (2006). The genetics and biochemistry of floral pigments. Annu. Rev. liposomes, liver microsomes and retinal epithelial cells. Biophys. Chem. 129, Plant Biol. 57, 761–780. doi: 10.1146/annurev.arplant.57.032905.105248 111–119. doi: 10.1016/j.bpc.2007.05.007 Harborne, J. B. (1958). Spectral methods of characterizing anthocyanins. Biochem. Shrestha, M., Burd, M., Garcia, J. E., Dorin, A., and Dyer, A. G. (2019). Colour J. 70, 22–28. doi: 10.1042/bj0700022 evolution within orchids depends on whether the pollinator is a bee or a fly. Harborne, J. B., and Smith, D. M. (1978). Correlations between anthocyanin Plant Biol. 21, 745–752. doi: 10.1111/plb.12968 chemistry and pollination ecology in the Polemoniaceae. Biochem. Syst. Ecol. Sigurdson, G. T., Tang, P., and Giusti, M. M. (2018). Cis–trans configuration 6, 127–130. doi: 10.1016/0305-1978(78)90038-8 of coumaric acid acylation affects the spectral and colorimetric properties of Harborne, J. B., and Williams, C. A. (2000). Advances in flavonoid research since anthocyanins. Molecules 23:598. doi: 10.3390/molecules23030598 1992. Phytochemistry 55, 481–504. doi: 10.1016/s0031-9422(00)00235-1 Stavenga, D. G., Staal, M., and van der Kooi, C. J. (2020). Conical epidermal Hart, N. S., and Vorobyev, M. (2005). Modelling oil droplet absorption spectra cells cause reduced velvety colouration and enhanced patterning in Mandevilla and spectral sensitivities of bird cone photoreceptors. J. Comp. Physiol. A 191, flowers. Faraday Discuss. 223, 98–106. doi: 10.1039/d0fd00055h 381–392. doi: 10.1007/s00359-004-0595-3 Stewart, R. N., Norris, K. H., and Asen, S. (1975). Microspectrophotometric Iwashina, T. (2003). Flavonoid function and activity to plants and other organisms. measurement of pH and pH effect on color of petal epidermal cells. Biol. Sci. Space 17, 24–44. doi: 10.2187/bss.17.24 Phytochemistry 14, 937–942. doi: 10.1016/0031-9422(75)85162-4 Jurasekova, Z. C., Domingo, C., Garcia-Ramos, J. V., and Sanchez-Cortes, S. (2014). Tang, B., He, Y., Liu, J., Zhang, J., Li, J., Zhou, J., et al. (2019). Kinetic investigation Effect of pH on the chemical modification of quercetin and structurally related into pH-dependent color of anthocyanin and its sensing performance. Dyes flavonoids characterized by optical (UV-visible and Raman) spectroscopy. Phys. Pigm. 170:107643. doi: 10.1016/j.dyepig.2019.107643 Chem. Chem. Phys. 16:12802. doi: 10.1039/c4cp00864b Tatsis, E. C., Böhm, H., and Schneider, B. (2013). Occurrence of nudicaulin Kevan, P., Giurfa, M., and Chittka, L. (1996). Why are there so many and so structural variants in flowers of papaveraceous species. Phytochemistry 92, few white flowers? Trends Plant Sci. 1:252. doi: 10.1016/1360-1385(96)20 105–112. doi: 10.1016/j.phytochem.2013.04.011 008-1 van der Kooi, C. J., Dyer, A. G., Kevan, P. G., and Lunau, K. (2019). Functional Koes, R. E., Quattrocchio, F., and Mol, J. N. (1994). The flavonoid biosynthetic significance of the optical properties of flowers for visual signalling. Ann. Bot. pathway in plants: function and evolution. Bioessays 16, 123–132. doi: 10.1002/ 123, 263–276. doi: 10.1093/aob/mcy119 bies.950160209 van der Kooi, C. J., Elzenga, J. T. M., Staal, M., and Stavenga, D. G. (2016). How Markham, K. R. (1982). Techniques of Flavonoid Identification. London: Academic to colour a flower: on the optical principles of flower coloration. Proc. R. Soc. B Press. 283:20160429. doi: 10.1098/rspb.2016.0429 Frontiers in Plant Science | www.frontiersin.org 10 January 2021 | Volume 11 | Article 600124
Stavenga et al.                                                                                                                                   pH Dependence of Floral Pigments

van der Kooi, C. J., and Ollerton, J. (2020). The origins of flowering plants and                 Yuan, J., Chen, F., Liu, X., and Li, X. (2002). Carotenoid composition in the
   pollinators. Science 368, 1306–1308. doi: 10.1126/science.aay3662                                green microalga Chlorococcum. Food Chem. 76, 319–325. doi: 10.1016/s0308-
van der Kooi, C. J., and Stavenga, D. G. (2019). Vividly coloured poppy flowers due                 8146(01)00279-5
   to dense pigmentation and strong scattering in thin petals. J. Comp. Physiol. A                Zhao, D., and Tao, J. (2015). Recent advances on the development and regulation
   205, 363–372. doi: 10.1007/s00359-018-01313-1                                                    of flower color in ornamental plants. Front. Plant Sci. 6:261. doi: 10.3389/fpls.
van der Kooi, C. J., Stavenga, D. G., Arikawa, K., Belusic, G., and Kelber, A. (2021).              2015.00261
   Evolution of insect colour vision – from spectral sensitivity to visual ecology.
   Ann. Rev. Entomol. in press                                                                    Conflict of Interest: The authors declare that the research was conducted in the
Verweij, W., Spelt, C., Di Sansebastiano, G., Vermeer, J., Reale, L., Ferranti, F., et al.        absence of any commercial or financial relationships that could be construed as a
   (2008). An H+ P-ATPase on the tonoplast determines vacuolar pH and flower                      potential conflict of interest.
   colour. Nat. Cell Biol. 10, 1456–1462. doi: 10.1038/ncb1805
Yoshida, K., Mori, M., and Kondo, T. (2009). Blue flower color development by                     Copyright © 2021 Stavenga, Leertouwer, Dudek and van der Kooi. This is an open-
   anthocyanins: from chemical structure to cell physiology. Nat. Prod. Rep. 26,                  access article distributed under the terms of the Creative Commons Attribution
   884–915. doi: 10.1039/b800165k                                                                 License (CC BY). The use, distribution or reproduction in other forums is permitted,
Yoshida, K., Toyama-Kato, Y., Kameda, K., and Kondo, T. (2003). Sepal color                       provided the original author(s) and the copyright owner(s) are credited and that the
   variation of Hydrangea macrophylla and vacuolar pH measured with a proton-                     original publication in this journal is cited, in accordance with accepted academic
   selective microelectrode. Plant Cell Physiol. 44, 262–268. doi: 10.1093/pcp/                   practice. No use, distribution or reproduction is permitted which does not comply
   pcg033                                                                                         with these terms.

Frontiers in Plant Science | www.frontiersin.org                                             11                                           January 2021 | Volume 11 | Article 600124
You can also read