London Legacy Corporation - Assessing the Legacy Corporation's Housing Needs Report of Findings - Queen Elizabeth Olympic Park
←
→
Page content transcription
If your browser does not render page correctly, please read the page content below
London Legacy
                Corporation
                Assessing the Legacy
                Corporation’s Housing Needs

                Report of Findings
                November 2013

Opinion Research Services   |   The Strand • Swansea • SA1 1AF   |   01792 535300   |   www.ors.org.uk   |   info@ors.org.uk
Opinion Research Services   |   London Legacy Corporation– Assessing Housing Needs                           November 2013

                                            Opinion Research Services The Strand, Swansea SA1 1AF
                                            Jonathan Lee | David Harrison | Nigel Moore
                                            enquiries: 01792 535300 · info@ors.org.uk · www.ors.org.uk

                                            © Copyright November 2013

                                            This project was carried out in compliance with ISO 20252:2012

                                                                        2
Opinion Research Services     |    London Legacy Corporation– Assessing Housing Needs                                                                         November 2013

        Contents
        1. Introducing the Study..................................................................................... 5
            Background to the project and wider policy context
             Project Overview ................................................................................................................................... 5

        2. London Legacy Corporation Area ................................................................... 6
            Background Information on the Overall Area
             Geography ............................................................................................................................................. 6
             Housing Affordability ............................................................................................................................. 8
             Turnover of Private Housing for Sale ...................................................................................................... 8
             Meeting Housing Need in the Private Rented Sector: Housing Benefit ................................................... 9

        3. The Greater London SHMA 2008.................................................................. 14
            Overall Needs for London
             Introduction..........................................................................................................................................14
             ORS Housing Markets Model.................................................................................................................14
             Future Housing Requirements from April 2007 to March 2017 ..............................................................15
             Breakdown of Housing Requirements 2007-17 by Housing Type ...........................................................16

        4. East London SHMA 2010 .............................................................................. 18
            Sub-regional position
             Introduction..........................................................................................................................................18
             Additional Housing Requirement ..........................................................................................................18
             Borough level tenure and size mix estimates.........................................................................................19

        5. Individual Borough Studies........................................................................... 22
            Borough level SHMAs
             Hackney ................................................................................................................................................22
             Newham ...............................................................................................................................................23
             Tower Hamlets .....................................................................................................................................24
             Waltham Forest ....................................................................................................................................25

        6. Future Planned Consents, Dwelling Size Mix and Population Projections .... 27
            Consents, Size Mix and Population
             Planning Consents Granted ...................................................................................................................27
             Size and Tenure Mix of Dwellings ..........................................................................................................29
             Age Profile of the Population ................................................................................................................30

                                                                                      3
Opinion Research Services     |   London Legacy Corporation– Assessing Housing Needs                                                                          November 2013

        7. Key Findings and Conclusions....................................................................... 33
            Future policy implications for London Legacy Corporation to consider
             Introduction..........................................................................................................................................33
             The Story of London Legacy Corporation Area .......................................................................................33
             Future Housing Requirements...............................................................................................................33
                  Size Mix ..........................................................................................................................................34
             Age Profile of the Population ................................................................................................................35

        Appendix A....................................................................................................... 37
            Table of figures

                                                                                      4
Opinion Research Services    |   London Legacy Corporation– Assessing Housing Needs                             November 2013

         1. Introducing the Study
         Background to the project and wider policy context

         Project Overview
   1.1
         Opinion Research Services (ORS) were commissioned by London Legacy Corporation to assess the
         Corporation’s housing needs to assist the Councils in the preparation of its Local Development Framework
         documents, Land Use Planning and Development Control functions, Housing Strategy and other service
         planning issues.
   1.2
         The Legacy Corporation covers planning authority areas previously part of the four Olympic Boroughs
         including Newham, Tower Hamlets, Hackney and Waltham Forest. Although London is considered as a
         single housing market area, at the local and sub-regional level, the housing markets of each borough are
         very distinct.
   1.3
         This research provides background information capable of being used as an analytical evidence base for the
         Legacy Corporation Local Plan.
   1.4
         In line with the requirements of the project brief, the proposed work will:
             »   Provide an overview of the existing market analysis of housing need and demand and supply, in
                 order to establish evidence of the likely future requirement for market and affordable housing
                 for the Legacy Corporation area.
             »   Inform the assessment of housing need and demand in relation to future proposed
                 development and will inform negotiations with developers on levels of affordable housing
                 required.
             »   Review how overall levels of housing need have been translated into requirements for different
                 types and sizes of accommodation across tenures so appropriate mixes can be sought.
             »   Provides officers with the most up to date information on which to base policy decisions and
                 responses
   1.5
         This study is based on a wide range of information collated from many sources, including:
                  »         Greater London SHMA 2008;
                  »         East London SHMA 2010
                  »         Individual borough SHMAs.

         Methodology
   1.6
         This document firstly provides some background information on the London Legacy area before reviewing
         all housing needs related documents covering the area.

                                                                        5
Opinion Research Services | London Legacy Corporation– Assessing Housing Needs November 2013
2. London Legacy Corporation Area
Background Information on the Overall Area
Geography
2.1
The London Legacy Corporation covers planning authority areas previously part of the four Olympic
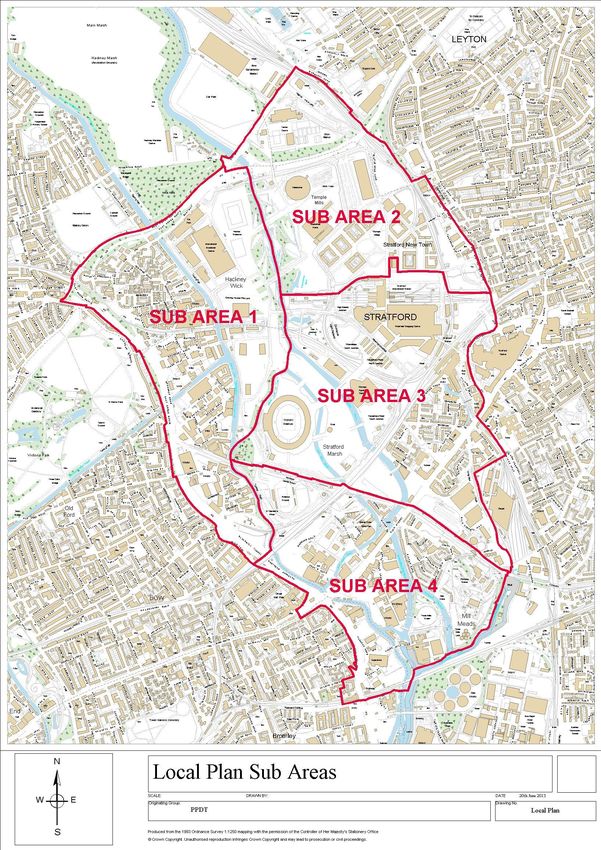
Boroughs including Newham, Tower Hamlets, Hackney and Waltham Forest. Figure 1 below shows the
distribution of land covered by the Legacy Corporation by Borough, while Figure 2, overleaf, shows the 4
sub-areas covered by the London Legacy Corporation.
Figure 1: Area Covered by London Legacy Corporation
London Borough Area in sq kms Percentage of London Legacy
Area
Hackney 0.78 16%
Newham 3.05 63%
Tower Hamlets 0.77 16%
Waltham Forest 0.24 5%
6
Opinion Research Services   |   London Legacy Corporation– Assessing Housing Needs   November 2013

        Figure 2:   Map of Sub-areas for London Legacy Corporation

                                                                       7
Opinion Research Services                    |   London Legacy Corporation– Assessing Housing Needs                                                November 2013

   2.2
         The area covered by Legacy Corporation has seen extensive development in recent years. A measure of
         new development is how many new postcode sectors have been allocated to an area. Additional postcodes
         are typically only added to cover areas with high levels of development. Between 1981 and 2010 a total of
         168 additional postcode sectors were created in the study area. However, in 2012 alone a further 110 were
         added, reflecting the high level of new development which had occurred in the area.

         Figure 3:                    Additional Postcode Sectors by Year (Source: Royal Mail)

                                120

                                100
          Number of Postcodes

                                80

                                60

                                40

                                20

                                 0
                                      1981             1986              1991             1996               2001            2006               2011

         Housing Affordability
   2.3
         Figure 4 shows the average house prices in the Legacy Corporation area between 1999 and 2012. The
         highest average price occurred in 2007 with the impact of the recession appearing to slightly reduce prices
         after this time.

         Figure 4:                    Average property Price in London Legacy Corporation Area 1999-2012 (Source: HM Land Registry)

                                300,000

                                250,000

                                200,000

                                150,000

                                100,000

                                 50,000

                                        0
                                             1999   2000    2001    2002   2003    2004       2005   2006   2007    2008   2009   2010   2011    2012

         Turnover of Private Housing for Sale
   2.4
         The impact of the post 2007/08 housing market downturn can be seen by considering market transactions
         since the 2006 peak (Figure 5). The level of transactions beyond 2010 was lower than in previous years.

                                                                                          8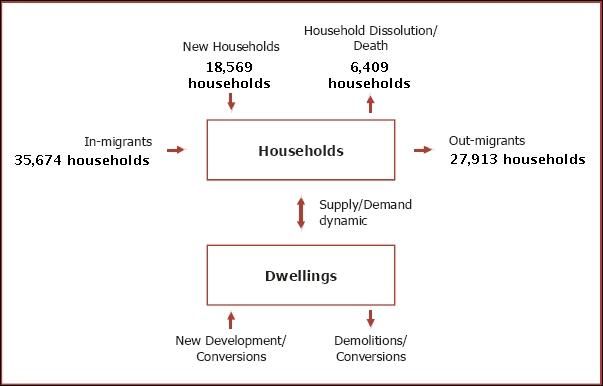
Opinion Research Services                                     |   London Legacy Corporation– Assessing Housing Needs                                            November 2013

         Note: The new developments granted postcodes in 2012 are yet to appear as transactions as they were not
         occupied at this time.

         Figure 5:                                   Volume of Properties Sold Across London Legacy Corporation Area: 1999- 2012 (Source: HM Land Registry)

                                               350

                                               300
             Annual Number of Property Sales

                                               250

                                               200

                                               150

                                               100

                                                50

                                                 0
                                                       1999       2000   2001    2002    2003    2004   2005    2006   2007   2008   2009    2010    2011     2012

         Meeting Housing Need in the Private Rented Sector: Housing Benefit
   2.5
         Many households in both the social and private rented sectors are able to claim support with rental costs in
         the form of housing benefit.
   2.6
         The Department of Work and Pensions (DWP) publishes quarterly statistics for Housing Benefit recipients.
         Figure 6 shows those households in London which claim housing benefit while living in the private rented
         sector as a share of all dwellings for each borough. Clearly the number of claimants in Newham, Waltham
         Forest and Hackney are well above both the national and London averages.

                                                                                                         9
Opinion Research Services | London Legacy Corporation– Assessing Housing Needs November 2013
Figure 6: Housing Benefit in Private Rented Sector as a Share of Total Dwellings (Source: CLG Live Table 100 March 2012; DWP
April 2013)
England 6.3%
London 8.3%
Brent
Enfield
Newham
Haringey
Croydon
Harrow
Ealing
Barnet
Waltham Forest
Barking and Dagenham
Redbridge
Hackney
Merton
Lewisham
Hillingdon
Hounslow
Lambeth
Sutton
Kingston upon Thames
Greenwich
Wandsworth
Bexley
Westminster
Havering
Hammersmith and Fulham
Tower Hamlets
Camden
Bromley
Southwark
Kensington and Chelsea
Islington
Richmond upon Thames
City of London
0% 2% 4% 6% 8% 10% 12% 14% 16% 18%
2.7
The importance of the private rented sector in accommodating households in need in London has been
thrown into sharp relief by welfare reforms as discussed below.
Calculation of Local Housing Allowances
2.8
Local housing allowance (LHA) rates are now capped and set at the 30th percentile of local rents (previously
the 50th percentile). The change from using the 50th percentile to the lower 30th percentile for calculating
local housing allowance rates has had a significant impact on the central London housing market as
households who would previously have been able to obtain housing benefit to cover their private rents find
that they have been forced to move to outer London to find suitable properties.
Under-occupation – Social Tenants
2.9
The Government estimates that nearly a third of working-age social housing tenants on housing benefit are
living in accommodation which is too big for their needs. The Act includes provision for reducing the benefit
paid to social housing tenants of working age if they are assessed as having spare room(s). In England, the
policy is estimated to affect 660,000 households, who will lose £14 a week on average. £430 million of
savings are forecast to result.
10Opinion Research Services | London Legacy Corporation– Assessing Housing Needs November 2013
2.10
There are a range of possible implications arising from such a change (Note: we have excluded the ethical
implications of the change):
» More households may downsize from family sized social rented dwellings into smaller
units, if available;
» Some larger properties may become available for overcrowded households with children;
» There may be or may not be a corresponding ‘balancing effect’, as larger homes and
smaller homes are vacated;
» Adult children may subsidise their parents to allow them to remain in the larger family
home;
» Rent arrears levels may rise, leading to increased numbers of evictions.
Extending the Limit for a Single Person Receiving a Bedsit Allowance to 35 Years of Age
2.11
Any single person aged 34 years or younger is entitled to only the Shared Accommodation Rate (SAR) LHA,
rather than the allowance for a self-contained dwelling. The SAR LHA will enable the single person only to
occupy a part of a dwelling as part of a shared household.
2.12
A major impact of this change is likely to be a rise in the demand for shared accommodation within HMOs.
More single persons will need to share accommodation for longer. More of the existing housing stock
seems likely to be converted into HMOs. HMO data (see Chapter 4) indicates a significant increase in the
number of HMOs within Wycombe 2001-11 and benefit changes seem likely to drive further conversions.
Non-dependants
2.13
Deductions for non-dependants are now up rated on the basis of prices, which could increase pressure for
non-dependants to move out.
2.14
The policy impact is that the financial incentive is for the adult children of pensioner couples to leave home
and seek their own independent accommodation, meaning the rate of household formation could rise,
leaving the pensioner parents under-occupying their accommodation.
2.15
In October 2013, with the new Universal Credit rules, non-dependant deductions will no longer be based on
earnings, there will be a flat rate deduction of £68 per month. Further, it will for the first time apply to 21-
24 year olds claiming Jobseekers Allowance. As JSA for 21-24 year olds is lower than for older claimants,
this group will find it very difficult to contribute towards the rent of the household.
Capping of Total Household Benefits at £500 per Week
2.16
The total level of benefit received by any household is to be capped at £500 per week for a family, £350 for
a single person with no children. The amount of Housing Benefit any household can receive will be assessed
after any Jobseeker’s Allowance, Income Support, Council Tax Benefit, Child Tax Credit and Child Benefit
have been deducted from the cap
Potential Impact of Benefit Reform on the Private Rented Sector
2.17
Changes to the LHA may mean considerable changes in the supply of dwellings available for households
who require financial support in the private rented sector. The changes are not likely to reduce the number
of households seeking Affordable Rent/Social Rent housing. However, it may increase the demand on local
authorities to find housing solutions for these households.
11Opinion Research Services | London Legacy Corporation– Assessing Housing Needs November 2013
2.18
The ability of authorities to meet housing need is dependent upon many issues. For example, how will
private landlords respond over time? Will they be less likely to accept those households in receipt of
housing benefit at the new reduced levels? Possible scenarios which may arise include:
» Market rent levels fall as landlords accept lower rent on their properties.
» If the new rent thresholds are too low then some landlords may simply not be willing to
accept housing benefit dependent households.
» This in turn may see house prices and rents fall as more housing becomes available to buy
or rent, so more households may be able to meet their housing requirements in the open
market.
2.19
However, if landlords are not prepared to accept households in receipt of housing benefit, where will these
households live? Social housing has limited supply; other tenure alternatives are inaccessible. Therefore,
the number of homelessness presentations may increase and overcrowding might rise. The percentage of
disposable income paid to rent may also rise in households seeking housing in the private sector.
Overall Impact
2.20
The overall impact of the welfare reforms is still difficult to assess because many have only recently been
implemented. However, one measure of the impact is shown below in Figure 7 overleaf which shows the
change in housing benefit claimant numbers in the private rented sector between 2010 and 2013 in the
context of all local authorities across London. This clearly shows a number of central London boroughs
have seen a reductions in the number of housing benefit claimants in the private rented sector, presumably
due to a lack of properties being available under the new benefit thresholds. Meanwhile, outer London
boroughs have seen a rapid growth in the number of claimants. Changes in the London Legacy Corporation
area, however, have been relatively modest, but the on-going impact of welfare reform will need to be
monitored in assessing how and where needs can be met.
12Opinion Research Services | London Legacy Corporation– Assessing Housing Needs November 2013
Figure 7: Growth in Housing Benefit Claimants in the Private Rented Sector April 2010-Janaury 2013 for Local Authorities in
London (Source: DWP)
Enfield
Brent
Merton
Ealing
Barnet
Croydon
Haringey
Barking and Dagenham
Lewisham
Hillingdon
Harrow
Greenwich
Newham
Hackney
Havering
Bexley
Redbridge
Hounslow
Waltham Forest
Sutton
Bromley
Kingston upon Thames
Lambeth
Southwark
Wandsworth
Richmond upon Thames
City of London
Tower Hamlets
Hammersmith and Fulham
Islington
Kensington and Chelsea
Camden
Westminster
-2,000 -1,000 0 1,000 2,000 3,000 4,000
13Opinion Research Services | London Legacy Corporation– Assessing Housing Needs November 2013
3. The Greater London SHMA 2008
Overall Needs for London
Introduction
3.1
ORS was commissioned by the Greater London Authority to undertake a comprehensive and integrated
strategic housing market assessment for the Greater London region. The study was undertaken to inform
the Mayor’s roles in setting strategic direction for London planning and housing policy through the London
Plan (Spatial Development Strategy) and the London Housing Strategy. The ORS report was published in
2008 and was used as part of the evidence base for the London Plan, 2011.
3.2
The research was based on an extensive range of secondary data sources including the UK Census, Housing
Corporation, HM Land Registry, Office for National Statistics and a range of other data and also drew on
data gathered through the London Household Survey 2002.
3.3
The study was prepared with a reference date of March 2007 due to time lags in data availability; it does
not take into account the falls in house prices and supply starting in late 2007 or other developments since
March 2007.
3.4
We would note that the final study contained a wide range of scenarios and sensitivity testing and that we
are only concentrating on one main set of results for this study.
ORS Housing Markets Model
3.5
Understanding the dynamics of the housing market is critical to providing reliable information to inform
many of the Core Outputs required of Strategic Housing Market Assessments. Some of the key or core
issues include:
How many additional dwellings are required?
How many additional dwellings should be affordable homes?
For what type of open-market housing is there demand?
How will ‘demand’ and ‘need’ change under different assumptions?
3.6
The ORS Housing Market Model addresses these issues by analysing the whole housing market. Instead of
focusing only, or primarily, upon poorer households and social sector need, it interprets the interaction of
requirement and supply across all sectors of the housing market.
3.7
Social sector needs are interpreted within the context of market housing demands. This approach takes
account of the interaction of effective and ineffective demands and needs, and the likely supply from the
range of properties vacated within the existing stock.
3.8
The key stages of the model and the main modelling assumptions can be summarised as follows:
14Opinion Research Services | London Legacy Corporation– Assessing Housing Needs November 2013
Gross Housing Requirement = Established Households +
New Households +
In-migrant Households
Housing Supply = Established Households +
Household Dissolution +
Out-migrant Households
Net Housing Requirement = Gross Housing Requirement -
Housing Supply
3.9
In seeking to understand the required housing mix, household affordability was grouped into three
classifications. In allocating households to specific types of housing, the determining factor is affordability:
Social rented housing – for those households unable to afford any more than target social
rents;
Intermediate housing – for those households able to afford more than target social rents, but
unable to afford to buy owner-occupied housing or to rent privately at the market rent
threshold; and
Market housing – for those households able to afford to buy owner-occupied housing or able
to afford to rent privately at rents at or above the market rent threshold.
3.10
When considering the appropriate housing supply, the following sources of supply are considered:
Social rented housing – social housing provided to rent from local authorities and Registered
Providers;
Intermediate housing – dedicated intermediate housing products (such as shared ownership,
discount market sale, sub-market rent) and a proportion of housing in the private rented sector
where rents are below the market rent threshold (i.e. within the lowest rental quartile); and
Market housing – owner-occupied housing and other housing in the private rented sector.
3.11
We would note that the study was produced before the introduction of the affordable rent housing product
by the current government in 2010. However, we agree with the position of the GLA which is that
effectively social rent and affordable rent can be used interchangeably because the costs of affordable rent
can be covered by housing benefit for those unable to meet their own housing costs.
3.12
Using these definitions in relation to the range of housing types, it is possible to consider the housing
market as a matrix of housing ‘origins and destinations’.
Future Housing Requirements from April 2007 to March 2017
3.13
Figure 8 shows the individual inward and outward flows of households to and from the region which when
considered together yield the overall requirement for an additional 349,400 homes for the period 2007-17
to balance the existing patterns of supply and demand.
15Opinion Research Services | London Legacy Corporation– Assessing Housing Needs November 2013
Figure 8: 10-Year Requirement/Supply Flow Analysis, April 2007-March 2017 (Source: ORS Housing Market Model March 2007
based analysis)
Household Dissolution/
New Households Death
912,200 250,700
households households
In-migrants from UK Out-migrants to UK
556,500 households 1,046,500 households
International in-migrants Households International out-migrants
564,800 households 386,900 households
Supply/Demand
dynamic
Dwellings
New Development/ Demolitions/
Conversions Conversions
3.14
If this number of homes is not provided, one or more flows will have to change. The change in flows could
include fewer new households forming, no resolution of overcrowding issues or households leaving the
area due to a lack of suitable available housing.
Breakdown of Housing Requirements 2007-17 by Housing Type
3.15
Figure 9 (below) details the size mix in terms of both gross requirement (i.e. all households seeking
housing) and net requirement (i.e. additional housing provision required) on the presumption that the
proportion of all households in receipt of housing benefit to enable them to live in the private rented sector
remains at the 2007 level, and that existing need is addressed over a 10-year period.
Figure 9: 10-year Housing Requirement by Housing Type and Size, retaining 2007-based Housing Benefit in the private rented
sector (Source: ORS Housing Market Model March 2007 based analysis. Note: Figures may not sum due to rounding)
Housing Type of Housing All Sectors
Requirement
Market Intermediate Social
Net Requirement
1 bedroom 128,400 (54,000) (500) 74,000
2 bedrooms 66,300 6,400 124,000 196,700
3 bedrooms 16,400 16,800 (25,400) 7,900
4 bedrooms (22,600) (4,700) 58,300 31,000
5+ bedrooms (10,100) 28,000 22,000 39,800
Total 178,400 (7,500) 178,500 349,400
16Opinion Research Services | London Legacy Corporation– Assessing Housing Needs November 2013
3.16
On the basis of these figures, it is apparent that there remains clear demand for additional 1- and 2-bed
owner occupied market housing across the region, but this is in the context of an apparent surplus of larger
owner occupied properties. In reality, this imbalance is likely to result in continued conversion of larger
homes into smaller units rather than homes standing empty in large numbers.
3.17
Nevertheless, the supply of smaller 1-bed intermediate properties (mainly within the lowest quartile of the
private rented sector) is projected to be higher than the number of households requiring such housing. It is
likely, however, that this relatively cheap private rented housing will provide accommodation to some
households currently allocated 1-bed market homes. Offsetting the surplus of 54,000 1-bed intermediate
homes against the requirement for 128,400 1-bed market homes yields an adjusted requirement for 74,400
units. This means the actual balance between 1- and 2-bed market homes is likely to be far more even than
suggested by the raw outputs.
3.18
The apparent surplus of larger market housing could provide opportunities for sub-dividing existing
properties to supply some of the smaller housing units that are required – though given the apparent
surplus of very cheap 1-bed stock within the lowest quartile of the private rented sector, it may be
appropriate to favour self-contained 1- and 2-bed flats rather than a dominance of additional bedsit
accommodation.
3.19
When we consider the remaining requirements for intermediate housing, properties with 2 bedrooms or
more are needed for households able to afford more than social rents, but unable to afford market prices.
In particular, there is a significant shortfall of intermediate housing with 5 bedrooms or more. In this
context it should be noted that the property size is allocated based on the bedroom standard applied to
individual household circumstances, rather than being based on household preferences. It should also be
noted again that households in the intermediate affordability band are not limited to ‘key worker’
households, whose requirements may be for smaller units.
3.20
The need for large affordable housing is also apparent in the social housing sector, with a required
provision of 58,300 4-bed homes and a further 22,000 homes with 5 bedrooms or more identified by the
model. Many of the households allocated to large social housing are currently occupying smaller homes in
the social sector and the projected surplus of 3-bed social housing would only be realised if all of the larger
affordable homes were successfully delivered.
17Opinion Research Services | London Legacy Corporation– Assessing Housing Needs November 2013
4. East London SHMA 2010
Sub-regional position
Introduction
4.1
In 2008, ORS was commissioned by the East London Housing Partnership to undertake a comprehensive
and integrated strategic housing market assessment for the East London sub-region. The final report was
published in 2010 with a baseline period for the findings of March 2009.
4.2
The East London housing sub-region is made up of eight local authorities; Barking & Dagenham, the City of
London Corporation, Hackney, Havering, Newham, Redbridge, Tower Hamlets and Waltham Forest.
4.3
The modelled housing requirements for the area were based on an extensive range of secondary data
sources including the UK Census, Housing Corporation, HM Land Registry, Office for National Statistics and
a range of other data. The requirements also drew on data gathered through the most recent household
survey undertaken in each of the boroughs.
Additional Housing Requirement
4.4
The underlying model used for the assessment replicated that used for the Greater London SHMA 2008
(see Chapter 3) and therefore is not repeated here. Again, the results were derived before the introduction
of affordable rent.
4.5
Various local authority level estimates of overall requirements, tenure and size mix were also provided;
these were based upon i) different methodologies for estimating the proportion of the sub-regional levels
of housing need to each Borough, and ii) a further estimate based upon the minimum delivery of additional
housing envisaged by the consultation draft replacement London Plan.
4.6
The estimated requirement for additional housing is dependent upon a number of variables, i.e. the nature
of supply and what future households are likely to be able to afford. Since there is no single ‘correct’
estimate the SHMA considered six scenarios. Testing a wide number of scenarios improves the
understanding of the dynamics of the housing market and re-enforces the understanding of the links
between the tenures. However, for this report we have only concentrated upon one of these scenarios
where the modelling outputs can be directly compared to those from the Greater London SHMA 2008.
4.7
Figure 10 (below) details the size mix in terms of both gross requirement and net requirement using two
assumptions. Firstly that the proportion of all households in receipt of housing benefit to enable them to
live in the private rented sector remains at the current level; and, secondly, that the existing backlog of
housing need is addressed over a 10-year period.
18Opinion Research Services | London Legacy Corporation– Assessing Housing Needs November 2013
Figure 10: 5-year housing requirement by housing tenure and size, (Source: ORS Housing Market Model, East London Housing
Requirement Assessment 2010. Note: Figures may not sum due to rounding)
Housing Type of Housing All Sectors
Requirement
Market Intermediate Social
Net Requirement (Surplus)
1 bedroom 15,068 15,157 7,213 37,438
2 bedrooms 17,102 (402) 4,501 21,201
3 bedrooms (4,395) 6,017 8,272 9,894
4+ bedrooms 852 6,424 8,701 15,977
Total
28,627 27,196 28,747 84,570
4.8
The apparent surplus of certain tenure and sizes need further explanation.
»
3 bedroom market housing forms the greater majority of the stock; predominately terraced and semi-
detached housing in the outer London Boroughs.
»
The apparent surplus is due to demographic trends and the affordability of these larger homes relative
to the additional households.
»
Such additional households will follow a trend of being smaller and less likely to have children.
»
The income profile of these additional households suggests that many would be unable to afford
outright home ownership if they were first time buyers.
»
A large amount of such housing will have been transferred from social rented to market housing
(whether owner occupied or the private rented sector) over time.
4.9
These issues account for an imbalance between the household and supply profiles which show a surplus of
market and a shortage of social rented 3 bedroom housing. Market forces are working to restore this
balance with owners of 3 bedroom market housing in the private rented sector either being sub-divided or
multi-occupied. The private rented sector is also housing households who require social housing as it is in
short supply.
Borough level tenure and size mix estimates
4.10
The above estimates reflect the overall position for the sub-region. Figure 11 overleaf shows the housing
requirement by tenure and size mix for each borough covered by the London Legacy Corporation based
upon projected household growth, while Figure 12 shows the housing requirements constrained to planned
dwelling delivery targets as were set out in the then Draft Replacement London Plan.
4.11
The apparent surplus of 3 bedroom market dwellings in many Boroughs is noteworthy. Estimates compare
future additional housing requirements to likely future supply, and trends indicate that fewer households
will require (or can afford) 3 bedroom homes. In reality this housing will be under-occupied by smaller
households or subdivided or shared by smaller households. Another factor is the effect of the right to buy
in reducing the supply of 3 bedroom homes in the social rented sector and increasing it in the market
sector adding to the estimated shortage in the social rented sector;
19Opinion Research Services | London Legacy Corporation– Assessing Housing Needs November 2013
4.12
The high proportion of additional one bedroom dwellings required is due to the large number of older
single person households either in housing need (and/or wishing to downsize) together with the
demographic trend of growth in the proportion of all single person households and childless couples.
4.13
The apparent surplus of most sizes of market housing in Hackney is likely to be due to the affordability of
the stock.
Figure 11: 5 year housing requirement by tenure and size by borough using London Councils’ HNI, (Source: ORS Housing Market
Model, East London Housing Requirement Assessment 2010. Note: Figures may not sum due to rounding)
Housing Type of Housing All Sectors
Requirement
Market Intermediate Social
Hackney 1 bedroom (1,671) 3,252 1,483 3,065
2 bedrooms (2,195) (490) 633 (2,051)
3 bedrooms 334 1,353 1,933 3,620
4+ bedrooms (270) 1,482 1,869 3,081
Total (3,801) 5,598 5,918 7,715
Newham 1 bedroom 3,337 4,234 3,146 10,716
2 bedrooms 3,290 628 1,368 5,286
3 bedrooms (1,134) 1,334 1,670 1,870
4+ bedrooms (123) 1,827 2,299 4,003
Total 5,370 8,023 8,483 21,876
Tower Hamlets 1 bedroom 4,967 2,603 1,567 9,136
2 bedrooms 6,364 (49) 436 6,752
3 bedrooms 1,251 985 1,455 3,691
4+ bedrooms 977 1,235 1,589 3,801
Total 13,559 4,774 5,047 23,380
Waltham Forest 1 bedroom 1,534 2,401 964 4,899
2 bedrooms 1,662 (180) 644 2,126
3 bedrooms (1,095) 939 1,412 1,257
4+ bedrooms (46) 997 1,376 2,328
Total 2,056 4,158 4,396 10,610
20Opinion Research Services | London Legacy Corporation– Assessing Housing Needs November 2013
Figure 12: :5 year housing requirement by tenure and size for minimum Draft Replacement London Plan delivery and London
Councils’ HNI, (Source: ORS Housing Market Model, East London Housing Requirement Assessment 2010)
Housing Type of Housing All Sectors
Requirement
Market Intermediate Social
Hackney 1 bedroom (1,251) 2,312 1,054 2,116
2 bedrooms (1,673) (348) 450 (1,570)
3 bedrooms 635 962 1,375 2,971
4+ bedrooms (123) 1,054 1,329 2,260
Total (2,412) 3,980 4,208 5,775
Newham 1 bedroom 1,661 5,633 4,186 11,480
2 bedrooms 287 836 1,820 2,942
3 bedrooms (8,699) 1,775 2,223 (4,701)
4+ bedrooms (2,714) 2,430 3,060 2,776
Total (9,466) 10,674 11,288 12,495
Tower Hamlets 1 bedroom (980) 3,677 2,214 4,910
2 bedrooms (1,332) (69) 616 (785)
3 bedrooms 845 1,392 2,056 4,293
4+ bedrooms 118 1,744 2,245 4,107
Total (1,349) 6,744 7,131 12,525
Waltham Forest 1 bedroom (21) 1,138 457 1,574
2 bedrooms (34) (85) 305 186
3 bedrooms (168) 445 669 947
4+ bedrooms (46) 473 653 1,080
Total (269) 1,971 2,084 3,785
21Opinion Research Services | London Legacy Corporation– Assessing Housing Needs November 2013
5. Individual Borough Studies
Borough level SHMAs
Hackney
5.1
The original Hackney SHMA was produced by Fordham Research in 2008. However, ORS was commissioned
to undertake Strategic Housing Market Assessments (SHMA) by the North London sub-regional partnership
(published 2011), and the East London sub-regional partnership (published 2010). The London Borough of
Hackney was in the unique position of falling within both the East London sub-region and North London
housing sub-region and, therefore, appears within both sub-regional studies.
5.1
In 2011 ORS updated the findings of the Hackney SHMA and this section draws on the findings of that
update, which in turn draw on the results of the North London SHM. We would note that at the time of
writing, Hackney are undertaking procurement for a new SHMA.
5.2
The modelled housing requirements for Hackney as part of the East London SHMA have been reproduced
above (Chapter 4).
5.3
For the North London SHMA, when using more recent migration, household formation and dissolution
rates, the housing requirements for Hackney are 10,988.
5.4
A total housing requirement of nearly 11,000 units is significantly above both the recent dwelling delivery
completion figures for Hackney and also planned future dwelling delivery.
5.5
However, it is possible for household growth to outstrip dwelling growth if households occupy Houses in
Multiple Occupation (HMOs - where more than one household occupy a single dwelling). In 2010, the
Hackney Private Sector Stock Condition Survey estimated that there are approximately 15,000 HMOs in
Hackney, so there are clearly far more households than dwellings in the borough. This in turn made a
figure for household growth of 11,000 over the period 2005-2010, which is extrapolated forward in the
housing requirements, very plausible.
5.6
Figure 13 below shows the modelled results in this scenario.
Figure 13: Hackney Unconstrained 5 year Housing Requirement by Tenure and Size (Source: ORS Housing Market Model, North
London Housing Requirement Assessment 2010)
Housing Type of Housing All Sectors
Requirement
Market Intermediate/ Social / Affordable
Affordable Rent Rent’ with HB
without HB
Hackney
1 bedroom 677 1,673 1,685 4,035
2 bedrooms 6,043 -79 164 6,127
3 bedrooms 346 -1,684 610 -728
4+ bedrooms 761 512 281 1,338
Total 7,827 422 2,739 10,988
22Opinion Research Services | London Legacy Corporation– Assessing Housing Needs November 2013
5.7
If the housing needs and requirements for Hackney are constrained to delivery equivalent to that in the
replacement London Plan annual monitoring target, the housing mix shown in Figure 14 is obtained as part
of the North London total housing requirements.
Figure 14: Hackney 5-year Housing Requirement by Housing Type and Size Replacement London Plan Delivery, (Source: ORS
Housing Market Model, North London Housing Requirement Assessment 2010. Note: Figures may not sum due to
rounding)
Housing Type of Housing All Sectors
Requirement
Market Intermediate/ Social / Affordable
Affordable Rent Rent’ with HB
without HB
Hackney
1 bedroom (671) 1,735 2,352 3,417
2 bedrooms 2,134 (77) 228 2,286
3 bedrooms (343) (1,626) 851 (1,119)
4+ bedrooms 242 556 392 1,190
Total
1,362 589 3,824 5,775
5.8
We would note that while the total dwelling constrained figures for Hackney were 5,775 over 5 years in the
East and North London SHMAs, the associated tenure and size mix was different. This is because the
models work from the sub-region downwards; so, in the North London SHMA, the requirements for
Hackney represent its role in meeting the needs of the North London sub-region, while those in the East
London SHMA represent the potential role of Hackney towards meeting East London’s needs.
Newham
5.9
Opinion Research Services (ORS) was commissioned by The London Borough of Newham in 2009 to
undertake a comprehensive and integrated Strategic Housing Market Assessment for the local authority.
The research was based on the analysis of 1,800 interviews conducted with households from October 2009
to November 2009 (the Household Survey, which primarily underwrote the housing needs and requirement
modelling) coupled with secondary data from the UK Census, Housing Corporation, HM Land Registry,
Office for National Statistics and a range of other sources along with a qualitative consultation programme
with a wide range of stakeholders. The baseline period for results was November 2009.
5.10
The projected flows of housing need, demand and supply derived from the Housing Market Model are
summarised below. In considering this combination of inward and outward household flows, we can
determine the likely pressure placed upon the dwelling stock – and the implicit requirement for additional
housing provision.
23Opinion Research Services | London Legacy Corporation– Assessing Housing Needs November 2013
Figure 15: 5-Year Requirement/Supply Flow Analysis (Source: ORS Housing Market Model, Newham Housing Market
Assessment 2009)
5.11
Figure 16 details the net requirement for additional housing after the model has taken account of vacancies
arising within the existing stock. The model shows an overall requirement for 19,921 additional dwellings
over the 5-year period.
Figure 16: 5-year Net Housing Requirement by Housing Type and Size (Source: ORS Housing Market Model, Newham Housing
Market Assessment 2010. Note: Figures may not sum due to rounding)
Housing Type of Housing Total
Requirement
Market Housing Intermediate Housing Social Rented Housing
5-year Net Requirement
1 bedroom 517 6,521 6,660 13,699
2 bedrooms 662 239 (2,333) (1,432)
3 bedrooms 651 1,712 791 3,155
4 bedrooms 1,028 1,346 257 2,632
5+ bedrooms 159 506 1,202 1,867
Total
3,018 10,325 6,577 19,921
Tower Hamlets
5.12
The Tower Hamlets SHMA was the only SHMA in the London Legacy Corporation area not undertaken by
ORS. The study was undertaken by DCA who were commissioned in March 2009 by the London Borough of
Tower Hamlets Council to carry out its SHMA. This included a local Housing Survey consisting of face to face
interviews with 1,700 households in the Borough.
24Opinion Research Services | London Legacy Corporation– Assessing Housing Needs November 2013
5.13
While the study was undertaken in accordance with SHMA Practice Guidance, the underlying model used
by DCA is different to that used by ORS. In particular, ORS assume that existing levels of renting and
housing benefit support in the private sector continue, while DCA assume that the private rented sector
plays no role in meeting housing need. This almost inevitably leads to housing needs figures from the DCA
study to be higher than those in ORS studies. Therefore, we would highlight that the levels of need
identified in the Tower Hamlets SHMA are almost certainly much higher than if a comparable model to the
other boroughs in the area had been used.
5.14
For this study, DCA obtained an annual affordable housing of 2,700 units per annum in Tower Hamlets,
which represents nearly 3 times the projected dwelling delivery target for the borough. The study
recommends an overall affordable housing target of 40%, with 70% being social rent and 30% intermediate.
The study also identified the dwelling size requirements by tenure as shown in Figure 17.
Figure 17: Net Housing Requirement by Housing Type and Size (Source: Tower Hamlets Strategic Housing Market Assessment
2009.)
Housing Type of Housing
Requirement
Market Housing Intermediate Housing Social Rented Housing
5-year Net Requirement
1 bedroom 50% 25% 30%
2 bedrooms 30% 50% 25%
3 bedrooms 10% 25% 30%
4+ bedrooms 10% 0% 15%
Total
100% 100% 100%
Waltham Forest
5.15
The Waltham Forest Strategic Housing Market Assessment 2011/12 was conducted by ORS. Whilst the
study sought to draw on a wide range of secondary data sources, primary data was also collected through a
household survey conducted between July and August 2011. 1,100 interviews were conducted as a
random sample of households across Waltham Forest, while 150 interviews were conducted in each of the
4 regeneration areas in the Borough (Walthamstow Town Centre, Black Horse Lane, Wood Street and the
Northern Olympic Fringe) giving a total sample size of 1,700 interviews. The baseline period for results was
March 2010.
5.16
The overall housing tenure mix required for Waltham Forest can be summarised as in the following figure.
Recent years have seen a high level of conversion of private sector housing In Waltham Forest to cheaper
private rent, or housing benefit supported private rent, to accommodate lower income households. The
model assumes that this process continues into the future. Hence a substantial affordable housing
requirement has been identified.
25Opinion Research Services | London Legacy Corporation– Assessing Housing Needs November 2013
Figure 18: Overall Housing 2010-2031 (Source: ORS Housing Market Model, Waltham Forest Housing Market Assessment
2011/12. Note: Figures may not sum due to rounding)
Tenure Requirement %
2010-2031 Housing Requirements
Market Housing 2,900 18.3%
Intermediate Affordable Housing 5,700 35.8%
Social Rented Housing
7,300 45.9%
Overall Housing Requirement
15,900 100.0%
5.17
The findings for housing requirements identify a total affordable housing requirement of over 80% of the
total planned dwelling delivery in Waltham Forest. Therefore, from a housing need perspective, there is
clear support for a position seeking a high level of affordable housing on qualifying sites.
5.18
The modelled size mix requirements indicate that in the market nearly 50% of households are seeking 3
bedrooms or more, with 80% seeking at least 2 bedrooms. The model also identifies a high requirement for
larger affordable units. Within the social rent requirement, these will typically be used for households in
greatest needs. It can be argued that the needs of larger households are more pressing than those of
smaller ones, so a potential policy response to this is the prioritisation of building affordable dwellings.
Overall, the findings show that a range of dwelling sizes, including 50% with 3 bedrooms or more, are
required in Waltham Forest to meet the needs of all households.
Figure 19: Size mix of the Housing Requirement 2010-2031 (Notes: All figures rounded to the nearest 100. Figures represented by
“-“ show any shortfall or surplus which is less than 50, although this will normally be greater than 0. Figures may not sum due to
rounding)
Tenure and Size Market Housing Intermediate Housing Social Rented Housing
1 bedroom 600 1,700 2,300
2 bedrooms 850 2,350 2,050
3 bedrooms 1,200 1,500 2,650
4+ bedrooms 250 150 300
2,900
Sub-total 5,700 7,300
5.19
The modelled findings identify a high requirement for 1 bed social rented dwellings which is driven by a
projected growth in single person households in Waltham Forest. The model is stock, rather than flow,
based so it compares the number of households likely to require a particular size of dwelling with the
number of dwellings of that size which currently exist. Therefore, it does not directly account for turnover
in smaller social rent units being much higher than in larger units, so more become available each year to
let.
5.20
It should be noted that the 1 bed social requirements includes many single people aged under 35 years.
Under new Local Housing Allowance rules, under 35s will receive only the Shared Accommodation Rate
allowance which will enable the single person only to occupy a share of a dwelling, rather than receiving an
allowance for a self-contained dwelling. Therefore, a major impact of this change is likely to be a rise in the
demand for shared accommodation within HMOs rather than for self-contained dwellings.
26Opinion Research Services | London Legacy Corporation– Assessing Housing Needs November 2013
6. Future Planned Consents,
Dwelling Size Mix and Population
Projections
Consents, Size Mix and Population
Planning Consents Granted
6.1
A key issue is assessing housing needs is how future dwelling delivery will match with the needs of the
households in the area. Currently nearly 20,000 dwellings have been granted planning consent within the
London Legacy area, while there is estimated capacity for over 4,000 more which do not currently have
consent. It should be noted that the near 20,000 consents in the London Legacy area will play a significant
role in meeting the total housing requirements of the 4 boroughs in the area.
27Opinion Research Services | London Legacy Corporation– Assessing Housing Needs November 2013
Figure 20: Dwelling Consents and Potential Additional Capacity 2013-2035 (Source: London Legacy Corporation Records)
Site details 2013/14- 2015/16 - 2020/21- 2025/26- 2030/31- Total
2014/15 2019/20 2024/25 2029/30 2034/35
CONSENTED SCHEMES (OUTLINE OR FULL)
St Mary of Eton Church 0 27 0 0 0 27
complex, Eastway
Eastwick (part of - 1), Queen 0 241 240 0 0 481
Elizabeth Olympic Park
Eastwick (part of - 2), Queen 0 205 204 0 0 409
Elizabeth Olympic Park
Sweetwater, Queen Elizabeth 0 380 380 0 0 760
Olympic Park
Chobham Manor, Queen 0 425 425 0 0 850
Elizabeth Olympic Park
Stratford City (north of the 2782 1036 818 818 0 5454
International Station)
Chobham Farm, Leyton Road 176 622 238 0 0 1036
Queen Elizabeth Olympic Park, 0 0 786 786 0 1572
North of Aquatics
Queen Elizabeth Olympic Park, 0 0 133 0 0 133
south of Aquatics
Queen Elizabeth Olympic Park, 0 0 480 479 0 959
South of the ArcelorMittal Orbit
The International Quarter, 0 0 0 334 0 334
Stratford City
Cherry Park, Stratford City 0 276 453 376 0 1105
(including
Site bordering Great Eastern 0 931 128 0 0 1059
759 student
Road and Angel Lane *
bedspaces)
Land at Pudding Mill Lane 0 0 630 630 0 1260
Rick Roberts Way, Stratford 0 0 200 200 0 400
High Street
Strand East (Sugar House Lane) 0 852 348 0 0 1200
Bromley by Bow North Site 0 371 370 0 0 741
Bromley By Bow South Site 0 0 150 150 155 455
68-70 High Street, Stratford 0 87 86 0 0 173
Corner of Westfield Avenue, 0 951 0 0 0 951
Stratford City*
Subtotal 1 2958 6404 6069 3773 155 19359
ADDITIONAL ESTIMATED CAPACITY BY SUB AREA -WITHOUT ANY CONSENT
Sub Area 1 0 367 878 857 713 2815
Sub Area 2 0 0 0 0 0 0
Sub Area 3 0 150 72 239 168 629
Sub Area 4 0 0 439 207 105 751
Subtotal 2 0 517 1389 1303 986 4195
Total 2958 6921 7458 5076 1141 23554
28Opinion Research Services | London Legacy Corporation– Assessing Housing Needs November 2013
Size and Tenure Mix of Dwellings
6.2
Given that over 80% of all future dwellings in the area already have planning consent, it is possible to
compare how the planned developments for the area will mirror the needs of the area. For tenure across
the study area, there is a consistent mix of 70% private dwelling, 12% intermediate and 18% social rented.
Therefore, 30% of all future dwellings will be affordable.
6.3
For size mix, the pattern varies across the schemes outlined above. The table below (Figure 21) shows the
physical number and percentage of dwellings by tenure which will be delivered by each number of
bedrooms. This shows that over 40% of all planned social rented dwelling delivery is for units of 3
bedrooms of more. Meanwhile, intermediate and market housing delivery is concentrated towards smaller
dwelling. The pattern of development, with a requirement for more, larger social units (compared to
market and intermediate) is consistent with the Greater London SHMA and also many of the studies for the
individual boroughs.
Figure 21: Size and tenure Mix of Dwellings with Planning Consent (Source: London Legacy Corporation Records. Note: Figure
rounded to the nearest 10)
Site details Studio 1 Bed 2 bed 3 bed 4 bed 5 bed Total
Number of Dwellings
Private 250 5,100 3,950 4,070 740 170 14,290
Intermediate 20 940 790 590 50 10 2,450
Social 30 1,090 970 1,210 330 40 3,670
Total 300 7,130 5,710 5,870 1,120 220 20,410
Percentage of Dwellings by Tenure
Private 2% 36% 28% 28% 5% 1% 100%
Intermediate 1% 38% 32% 24% 2% 0% 100%
Social 1% 30% 26% 33% 9% 1% 100%
Total 1% 35% 28% 29% 5% 1% 100%
6.4
The pattern of development will not see sufficient affordable housing being developed to meet all housing
need in the London Legacy Area. However, it is likely that, even if almost 100% of development was
affordable, it would still not be enough to meet need. The implication is, therefore, for a continued rise in
the number of households in receipt of housing benefit in the private rented sector, or a displacement of
households to cheaper areas due to the impact of welfare reform. However, as noted, the overall pattern
of development in terms of the size mix is consistent with needs; therefore, the dwellings with planning
consents are likely to meet as much need as is possible within the overall tenure constraints.
29Opinion Research Services | London Legacy Corporation– Assessing Housing Needs November 2013
Age Profile of the Population
6.5
Linked to the planned development of dwellings in the London legacy area, the GLA have produced
population projections for the area until 2041. Using data from the 2011 Census at postcode level, the GLA
estimate the population of the London Legacy area in 2011 as being 10,273 people with a total of 4,533
households at an average household size of 2.27.
6.6
However, using data from Census Output Areas indicates a population, including those areas partially inside
the London Legacy area, of 22,208. However, the boundary of the London Legacy area does not correspond
with Output Area boundaries so a number of people not in the London Legacy area will have been counted
in the figure of 22,208 and the figure is therefore an overestimate.
6.7
The GLA population projections are based upon Output Area boundaries because there is insufficient
information at postcode level to use for projections. These show that by 2041 there will be a projected
55,668 residents in the London Legacy area. Again it should be noted that this is likely to overestimate the
true population of the area.
6.8
Figure 22 shows the age profile of the projected population in 2011, 2021, 2031 and 2041. These figures
contain a circularity in that they are constrained to the total planned dwelling delivery and therefore
cannot be used to assess the total need for dwellings. However, they show the population in 2011 was
predominantly young, but by 2041 the resident population is projected to age with 15% being over 60 years
of age. Further, all population cohorts over 45 years are projected to increase to 2041, while those aged
under 39 will increase to 2021 but then decrease to 2041. Children under 15 years of age are projected to
form 20% of the population by 2041.
30Opinion Research Services | London Legacy Corporation– Assessing Housing Needs November 2013
Figure 22
Age Profile for London legacy Area in 2011, 2021, 2031 and 2041 (Source: GLA DMAG unit)
20%
18%
16%
14%
12%
10%
8%
6%
4%
2%
0%
85+
25-29
0-4
10-14
15-19
20-24
30-34
35-39
40-44
45-49
50-54
55-59
60-64
65-69
70-74
75-79
80-84
5-9
Age Group
2011 2021 2031 2041
6.9
The growth in population and change in its age structure has a number of implications:
» Children: While the proportion of children in the population is projected to fall, the actual
number will grow rapidly. This is likely to place additional pressures on local school places. Such
pressure has direct implications for housing policy particularly in terms of funding any new
school provision from planning ’gain’. For example, funding for new schools can come from
Section 106 agreements, the Community Infrastructure Levy, or from the New Homes Bonus
(which provides funding for each new dwelling completed or vacant property returned to use).
However, these funding sources often also subsidise Affordable housing. Implicit in this
competition for resources is the trade-off between social infrastructure and affordable housing;
» Older People: The growth in older population will also need careful consideration. The UK faces
a significant challenge as people live longer. ‘Living Well At Home - 2011’ (All Party
Parliamentary Group on Housing and Care For Older People) identified that the older population
will grow from 10.1m to 16.7m by 2036 for the over 65s, and from 1.3m to 3.3m by 2033 for the
over 85s. Already over half of NHS spending is on people over 65. NPPF contains a useful
definition of older people and the range of housing provision required in its glossary:
‘People over retirement age, including the active, newly-retired through to the very frail
elderly, whose housing needs can encompass accessible, adaptable general needs housing
for those looking to downsize from family housing and the full range of retirement and
specialised housing for those with support or care needs’.
31You can also read


