Stock market returns and liquidity during the COVID-19 outbreak
←
→
Page content transcription
If your browser does not render page correctly, please read the page content below
The current issue and full text archive of this journal is available on Emerald Insight at:
                          https://www.emerald.com/insight/2615-9821.htm

Stock market returns and liquidity                                                                                       Stock market
                                                                                                                          returns and
  during the COVID-19 outbreak:                                                                                              liquidity

    evidence from the financial
    services sector in Vietnam
                                      Cuong Thanh Nguyen                                                                     Received 1 June 2021
                                                                                                                              Revised 4 July 2021
 Faculty of Accounting and Finance, Nha Trang University, Nha Trang, Vietnam                                                Accepted 23 July 2021
                                           Phan Thanh Hai
  Faculty of Accounting, School of Business and Economics, Duy Tan University,
                             Da Nang, Vietnam, and
                                      Huyen Khanh Nguyen
        Department of Academic Affairs, Research and International Relations,
                Nha Trang Tourism College, Nha Trang, Vietnam

Abstract
Purpose – This paper aims to explore the influence of the COVID-19 outbreak and the Government’s disease
control measures on the stock returns and liquidity of Vietnam-listed companies in the financial services sector.
Design/methodology/approach – The authors have conducted a panel data regression analysis using data
from 50 banking, insurance and finance companies listed in Vietnam’s two biggest stock exchanges (HNX and
HOSE) within the period from January 30th, 2020 to May 15th, 2021.
Findings – The regression results indicate that the daily growth in the total number of confirmed cases caused
by COVID-19 has significant negative effects on the stock market returns and liquidity. Nevertheless, the
Government’s imposition of lockdown yields significant and positive outcomes on stock performance. In
addition, the study reveals remarkable differences in returns of large-cap and small-cap stocks under the
impact of the COVID-19 pandemic.
Research limitations/implications – The study indicates government and regulators should act more
actively to limit the outbreak of the virus, improve investor confidence as well to support the financial services
industry and deal with the outbreak of the pandemic later.
Originality/value – This is the first study to explore the influence of the COVID-19 outbreak and the
Government’s disease control measures on the stock returns and liquidity of Vietnam-listed companies in the
financial services industry.
Keywords COVID-19, Daily stock returns, Liquidity, Financial services industry, Vietnam
Paper type Research paper

1. Introduction
Since early 2020, the COVID-19 pandemic has become a “hot topic” evoking great interest
across boundaries. The illness onset was on December 31st, 2019 with dozens of mysterious
pneumonia cases emerged in Wuhan City, Hubei Province, China (Sohrabi et al., 2020). In
less than 3 months, the outbreak has spanned rapidly to every corner of the globe. Millions

JEL Classification — C23, G10, G14, G15
    © Cuong Thanh Nguyen, Phan Thanh Hai and Huyen Khanh Nguyen. Published in Asian Journal of
Economics and Banking. Published by Emerald Publishing Limited. This article is published under the
Creative Commons Attribution (CC BY 4.0) licence. Anyone may reproduce, distribute, translate and
                                                                                                                        Asian Journal of Economics and
create derivative works of this article (for both commercial and non-commercial purposes), subject to full                                    Banking
attribution to the original publication and authors. The full terms of this licence may be seen at http://                 Emerald Publishing Limited
                                                                                                                                             2615-9821
creativecommons.org/licences/by/4.0/legalcode                                                                           DOI 10.1108/AJEB-06-2021-0070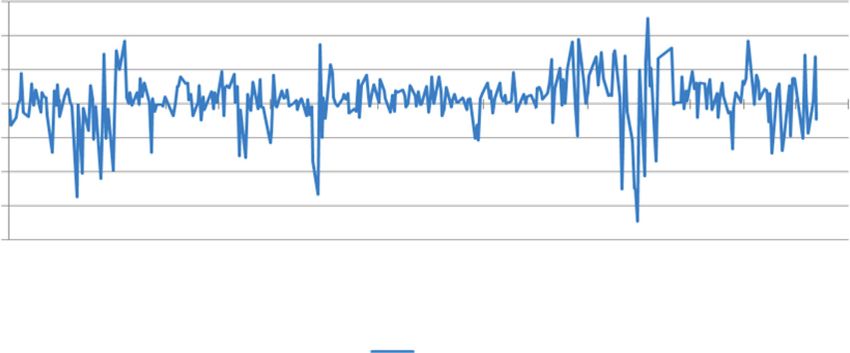
AJEB   of infections and deaths attributed to the COVID-19 have been reported in more than 200
       countries wherein Vietnam’s first confirmed case was on January 23rd, 2020. On March
       11th, 2020, the World Health Organization has declared the COVID-19 “a global pandemic”
       (WHO, 2020). The COVID-19 pandemic has tremendously affected the socioeconomy of
       almost all nations in the world, and the scenario looks even more complicated and
       unpredictable that may push many governments to the threat of so-called dual economic
       and public health crisis. Regarding economic aspect, the stock market is one of the most
       vulnerable sectors.
           The impact of the worldwide COVID-19 pandemic on the stock market seemingly remains
       inconclusive in the least near future. Such inconclusiveness creates ground for an in-depth
       investigation of the stock market’s liquidity and profitability in response to the pandemic
       outbreak and the disease control policies imposed by the Government.
           Although extensive studies have been carried out to address the interest in this research
       area (Al-Awadhi et al., 2020; Alfaro et al., 2020; Baig et al., 2021; Eleftheriou and Patsoulis,
       2020; He et al., 2020; Liu et al., 2020; Mdaghri et al., 2021; Zhang et al., 2020), most of them are
       limited to such countries as the USA, China, France, Germany, Italy, Japan, Korea and Spain,
       and not concentrated in any one industry, for instance, banking and finance.
           Banking and finance sector plays a vital role in the stock market of most nations including
       Vietnam. Research by the World Bank (2019) has claimed a strong tie between GDP per capita
       growth and credit growth in Vietnam. By the end of 2019, the market capitalization of the
       financial services sector was 29.08%, which accounted for the highest share of the total stock
       market. Therefore, a study on the influence of the COVID-19 pandemic on the stock
       profitability and liquidity of listed companies in this sector is undoubtedly crucial to the
       development of Vietnam’s stock market.
           In Vietnam particularly, there is a study by Anh and Gan (2021) investigating the effects of
       the COVID-19 outbreak and its following lockdown on daily stock returns of companies listed
       in Vietnam’s stock exchanges over the period from January 30th, 2020 to May 30th, 2020. The
       study, however, is carried out when there was no death related to the coronavirus yet reported
       in Vietnam. Also, the researchers focus on stock returns associated with five industries
       (finance, consumer goods, industrial goods, energy and utilities). Another more recent study
       by Phuong (2021) evaluates the impact of the COVID-19 on the performance of Vietnam’s
       banking industry during the three nationwide lockdowns imposed in 2020. Yet, its emphasis
       is solely on the stock returns of banking firms.
           Unlike the two aforementioned studies, our research intends to establish the provable link
       concerning the stock returns and liquidity of Vietnamese-listed banking, finance and
       insurance companies in response to the COVID-19 outbreak and the stringent imposition of
       nationwide lockdown. Simultaneously, the research assesses the influence of the COVID-19
       surges on the profitability and liquidity of large-cap and small-cap companies. We extend the
       period of observations from January 30th, 2020 to May 15th, 2021.
           The rest of this paper is organized as follows: The next section provides the background
       and overview. Section 3 presents the data and research methodology. Section 4 presents the
       empirical tests and further analysis. Section 5 presents conclusions and implications.

       2. Background and overview
       2.1 The Black Swan theory and COVID-19 pandemic
       The Black Swan theory was developed by Nassim Nicholas Taleb, the Lebanese-American
       scholar, who made the concept famous in his 2007 book “The Black Swan: The Impact of the
       Highly Improbable” (Taleb, 2007). He describes a Black Swan event to have the following
       three distinguishing characteristics: (1) It must be unexpected. This is an a priori unlikely
       event, where there is no evidence that it will happen, and therefore it is a surprise to analysts
       and the market. (2) They have an outsized impact. These are events that significantly affect
the economy or world politics. (3) Events and their causality that we tend to explain after the Stock market
event. In other words, once they have happened, and only then, there is evidence that such an returns and
event could have been avoided, and theories are created that explain why it came to be. The
COVID-19 pandemic currently affecting the world has all the characteristics that define a
liquidity
black swan case. This event appeared to be a Black Swan event (Mishra, 2020).
According to the black swan theory, the consequences of Black Swan event is one of the
risks that has to be faced when operating in the stocks markets. Therefore, although these are
events with a low probability of occurring, it would be a serious mistake to ignore them. This
implies that investors need to have a diversified and structured portfolio with different asset
types so that they can act as counterweights in the event of having to respond to varying
economic or financial circumstances. In other words, black swans, whose occurrence, as the
world has become more complex and globalised, is more common and to which investors are
beginning to become accustomed.
2.2 An overview of COVID-19 pandemic in Vietnam
According to the report of the Ministry of Health of Vietnam available on its official website
(https://ncov.vncdc.gov.vn/), the timeline of the COVID-19 pandemic from January 23rd, 2020
to May 15th, 2021 has unfolded as follows:
2.2.1 The first 16 confirmed cases. On January 23rd, 2020, Vietnam announced the first
two confirmed cases admitted to Cho Ray Hospital who were a Chinese man and his son from
Wuhan, China. On February 1st, 2020, a 25-year-old woman who worked as a receptionist at a
hotel in Khanh Hoa Province where the two Chinese men had stayed was tested positive for
the virus. It was considered the first locally transmitted case in Vietnam. Since then, the local
transmission began to develop with a cluster of cases detected in several Northern provinces.
On February 12th, 2020, the local authorities imposed quarantine and self-isolation
restrictions on the whole Son Loi Commune, Binh Xuyen District, Vinh Phuc Province to limit
the spread of the disease.
2.2.2 A fleet of cases imported from abroad. On March 6th, 2020, Hanoi announced the first
case of the city, also known as the 17th confirmed patient in Vietnam. On March 10th, 2020,
Binh Thuan Province reported a “super infectious case” named the 34th COVID-19 patient.
This patient returned to Vietnam from the USA via Tan Son Nhat International Airport, then
visited Phan Thiet where she was in close proximity with a number of people. Soon after she
was tested positive for the virus, as many as 11 people were found to get infected from her,
making her the greatest source of contagion at the time. On March 17th, 2020, the
Government suspended the issuance of visas for foreigners entering Vietnam.
2.2.3 A threat of community transmission. On March 20th, 2020, the Ministry of Health
announced the 86th and 87th COVID-19 patients who were two female nurses working at the
Tropical Diseases Center of Bach Mai Hospital (Hanoi). As of March 21st, 2020, Vietnam
declared a temporary suspension of entry for all foreigners. As of April 1st, 2020, a
nationwide lockdown for 15 days was effective as a drastic epidemic control measure. On
April 15th, 2020, the lockdown was announced to be extended in Hanoi, Ho Chi Minh City and
some high-risk provinces. As of April 23rd, 2020, the restrictions on nationwide lockdown
were lifted while other prevention and control measures remained in effect. On April 25th,
2020, Prime Minister Nguyen Xuan Phuc issued Directive 19 to maintain pandemic
prevention and control measures in the New Normal state.
2.2.4 A rediscovery of community-acquired infections. On July 25th, 2020, the Ministry of
Health announced the 416th confirmed case in Da Nang City, which was the first case with
untraceable source of infection. A ban on entry into and exit from Hospital C was immediately
imposed. On July 26th, 2020, the 418th COVID-19 patient was reported, followed by the
blockage of Da Nang Hospital. On July 27th, 2020, 11 infected cases were furthermoreAJEB recorded. In response to this surge, the authority of Da Nang enacted lockdown and social
distancing restrictions on the entire city by July 28th, 2020. Still, the first death attributed to
the COVID-19 in Vietnam was reported on July 31st, 2020.
2.2.5 Long-term pandemic control alongside socioeconomic development practices. As of
September 7th, 2020, Vietnam witnessed some positive signals in containing the epidemic.
The situation began to be largely under control as almost all economic activities, including
transportation services by plane, train or coach from and to Da Nang, resumed. Da Nang
authorities decided to ease the social distancing restrictions from September 11th, 2020.
Following that, Vietnam officially has resumed international commercial flights effective
September 15th, 2020 until further notice. On September 24th, 2020, Prime Minister Nguyen
Xuan Phuc issued Telegram No.1300/CÐ-TTg requesting heads of units under the Ministry
of Health as well as of local authorities to strictly follow the directive on strengthening the
prevention and control measures of the COVID-19. It is to maintain Vietnam’s notable
achievements in battling the COVID-19, which will help facilitate the recovery and
development of the whole socioeconomy.
2.2.6 Continued restrictions on social distancing in the COVID-19 epicenter. On January 1st,
2021, a new, highly infectious variant of the COVID-19 originated from the United Kingdom
was discovered in a Vietnamese 45-year-old female patient. By the noon of January 28th, 2021,
Hai Duong Province implemented social distancing after 75 community transmission cases
being recorded within the day, leading to an end of 55 coronavirus-free days in Vietnam. On
April 27th, 2021, a hotel receptionist was diagnosed with the virus as being in close contact
with some experts from India, named as 2857th patient. Since then, Vietnam has experienced
a rapid-spreading outbreak both in quarantine camps and in the community. With this
stance, the Government of Vietnam has tightened the COVID-19 restrictions to curb a new
wave of infections. In the afternoon of May 15th, 2021, the Ministry of Health announced the
36th COVID-19-related death, also known as the 3839th confirmed patient in Bac Ninh
Province. This event has remarked the most severe outbreak since the onset of the COVID-19
epidemic in Vietnam so far.
2.3 Impact of the COVID-19 outbreak on stock returns and market liquidity
Extensive past studies have established the potential impact of pandemics on the stock
market. For instance, Chen et al. (2007, 2009) investigate the effect of the SARS outbreak on
the performance of Taiwan’s stock market. The findings reveal that SARS has a significant
and negative impact on the stock returns of businesses in hospitability and tourism as well as
retail and wholesale sectors. In contrast, a positive relationship is found between the epidemic
and the returns on biotech stocks. Similar findings are concurred in research by Jiang et al.
(2017), which reports an unfavorable nexus between the H7N9 outbreak and China stock
indices. Likewise, Ichev and Marinc (2018) assess the extent to which the Ebola epidemic
surging in 2014–2016 influenced US stock prices at the time. They claim that such disease
yields the most significant effect on American companies that have businesses in West Africa
and the USA; also, stock returns of small-sized companies are seemingly more sensitive and
vulnerable to the epidemic as compared to those of the bigger ones.
Since the outbreak of the COVID-19 spanning on a global scale, its negative impact on
stock returns has prevailed in a bulk of studies. Al-Awadhi et al. (2020) claim that the increase
in daily inbound confirmed cases and deaths in China tremendously affects the returns of all
stock types in the capital market. This conclusion is supported by a research of Ashraf (2020),
using data observations from 64 stock markets over the globe. In addition, findings from
study by Zhang et al. (2020) on the link between the COVID-19 pandemic and market risk in 12
countries reveal a considerable increase in the risk level of the global financial market in
consequence of the disease. The uncertainties in the pandemic outlook and its related
economic losses also worsen the market volatility. He et al. (2020) evaluate the marketperformance of eight nations and explore that besides unfavorable influence on stock returns, Stock market
there exists a spillover effect among Asian, European and American countries. Liu et al. returns and
(2020) explore the short-term impact of the COVID-19 outbreak on the top 21 stock markets in
pandemic-most-affected countries. When using the case-study method, it has witnessed a
liquidity
rapid and significant decrease in the profitability of these stock markets due to the outbreak.
Goodell (2020) argues that the financial services sector, including banks and other financial
institutions, is heavily affected by the COVID-19 due to increasing bad debts resulting from
deteriorating incomes and escalating deposit withdrawals. Mdaghri et al. (2021) investigate
how the COVID-19 impacts the liquidity of stock markets in the Middle East and North Africa
(MENA) countries, taking into account the market depth and tightness. The study shows that
the increasing number of confirmed cases and deaths positively impact the market liquidity,
although there exist differences in liquidity dynamics between small-caps and large-caps.
Nevertheless, the results on industry-level and country-level conclude a negative and
significant relation between the COVID-19 epidemic and the stock market liquidity.
Although the impact of the COVID-19 outbreak focusing on the Vietnam market is still
sparsely investigated, some researchers have shown their interest in the topic. Anh and Gan
(2021) deployed panel regression analysis to examine the influence of the COVID-19 before and
after the imposition of pandemic restrictions on the stock returns of listed companies on
Vietnam’s stock exchanges. Their findings confirm a negative nexus between the increase in the
daily number of confirmed cases and the stock returns, in which the worst-affected sector is
banking and finance. Notwithstanding such negative impact, the research indicates that the
stock market as well as other businesses have experienced a noticeable upward trend after the
Government enacted epidemic control programs. Phuong (2021) utilizes the case-study method
to examine the influence of the COVID-19 on the Vietnam banking sector in particular and
explores that Vietnamese investors have different reactions during the three waves of the
COVID-19, reflecting on the stock prices of listed banks on the exchanges in 2020.
2.4 The impact of the COVID-19 lockdown on stock returns and market liquidity
In response to the COVID-19 outbreak, authorities worldwide have conducted a broad range
of pandemic prevention and control measures to ensure public health, including but not
limited to travel restrictions, declaration of national health emergency, provincial and
national curfews, social distancing, cancelation of public events, temporary closures of
educational institutions as well as nonessential businesses, self-raising awareness of disease
prevention (wearing face masks, hand washing, etc.) and digital transformation in business
and education operation from offline to virtual. According to Van Hoof (2020), the COVID-19
pandemic is an unprecedented event that forces one-third of the world’s population to these
experiences.
To date, there exists a considerable amount of studies on the impact of the COVID-19
lockdown on stock returns and market liquidity. A study by Eleftheriou and Patsoulis (2020)
sampling the stock market indices of 45 countries is an instance wherein its findings suggest
a significantly negative relation between the pandemic restriction policies and the global
stock market performance. It is congruent with research by Baig et al. (2021), which finds that
the COVID-19-related lockdown reduces the stability and liquidity of the US stock market.
Anh and Gan (2021), however, draw an opposite conclusion when examining the performance
of the Vietnam stock market. They argue that the epidemic preventive measures, including
lockdown, create a significant positive effect on the stock returns of all businesses.
All in all, extensive research on the COVID-19 outbreak and its following lockdown
influencing the global stock market returns and liquidity has been widely carried out. Yet, at
least to the extent of our knowledge, there is a dearth of such studies in Vietnam, particularly
in the banking, finance and insurance industry. Therefore, this study intends to extend the
past findings concerning the response of Vietnamese banks and other financial institutions toAJEB the COVID-19 outbreak. The paper would provide substantial empirical knowledge to
academic researchers, the Government, local authorities and investors in forecasting stock
returns and liquidity of banking, finance and insurance companies in dealing with future
pandemics.
3. Data and methodology
3.1 Data
This study focuses on investigating the influence of the COVID-19 outbreak and the
epidemic-related restrictions on the stock returns and liquidity of 50 banking, finance and
insurance companies listed in Vietnam’s stock exchanges (HOSE and HNX). Daily stock data,
including share prices, market capitalization and market-to-book ratio are obtained from
Vietnam Stock’s website (https://vietstock.vn/). The period of data sampling starts from
January 30th, 2020, which is the first trading day after Lunar New Year and also a remarked
day of the first Vietnamese national confirmed case. The final data collection date is May
15th, 2021, which is the 15th day after a four-day holiday for Reunification Day and
International Workers’ Day. Data of daily confirmed cases and deaths in Vietnam are
collected from the official website of the Ministry of Health (https://ncov.vncdc.gov.vn/).
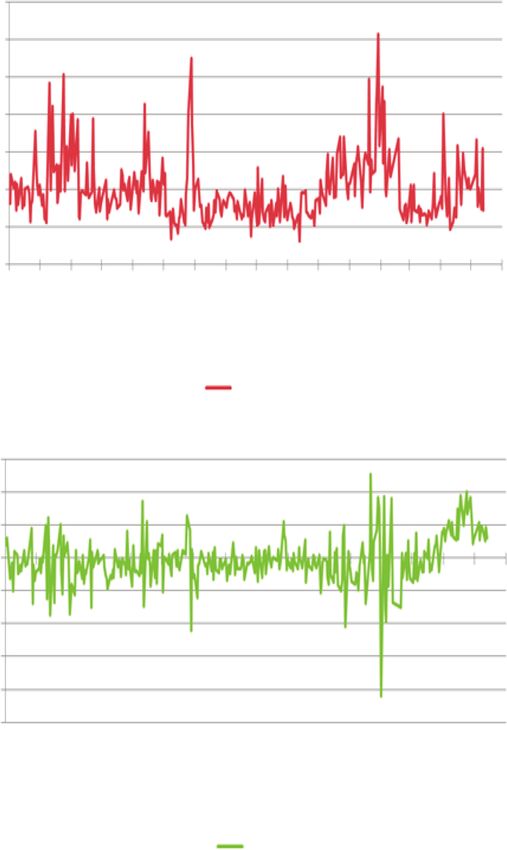
Figures 1 and 2 show aggregate daily stock returns and liquidity, on average, of 50 financial
institutions listed on the Vietnam stock exchanges wherein the period of data observations
spans from January 30th, 2020 to May 15th, 2021. Figure 3 indicates the daily confirmed patients
and deaths related to the COVID-19 epidemic. The authors expect an inverse relationship
between the severity of the pandemic situation and the stock profitability and liquidity of
companies in the sample, especially for the period from July 31st, 2020 onward.
3.2 Methodology
3.2.1 Research model. Based on past studies conducted by Al-Awadhi et al. (2020), Anh and
Gan (2021) and Mdaghri et al. (2021), a model to explore the influence of the COVID-19
outbreak and the disease-related control measures on stock returns and liquidity of Vietnam-
listed banking, finance and insurance companies is developed. Specifically,
Models (1–3) examine the impact of the COVID-19 outbreak on stock returns and liquidity:
DSRi;t ¼ α01 þ α02 CASE Gt−1 þ α03 DEATH Gt−1 þ α04 MARCAPi;t−1 þ α05 MTBi;t−1 þ e0i;t
(1)
AMIHUDi;t ¼ α11 þ α12 CASE Gt−1 þ α13 DEATH Gt−1 þ α14 MARCAPi;t−1 þ α15 MTBi;t−1
þ e1i;t
(2)
0.06
0.04
0.02
0.00
–0.02
–0.04
Figure 1. –0.06
Cumulative average –0.08
daily returns of 20 20 0 0 20 0 0 20 0 0 0 21 21 21 1
n- b- 20 r-2 -2 n- l-2 -2 p- t-2 -2 -2 n- b- ar- r-2
Vietnam-listed -Ja -Fe ar- Ap M
ay
-Ju -Ju Aug
-Se -Oc Nov Dec
-Ja -Fe M Ap
M - 31 1- 0- 1- 1- -
banking, finance and 30 29 31- 30 3 1- 30 3 30 31 3 3 31 28 3 30
insurance companies
DSR0.0035 Stock market
returns and
0.0030
liquidity
0.0025
0.0020
0.0015
0.0010
0.0005
0.0000
20 20 20 20 20 20 20 20 20 20 20 20 21 21 21 21
n- b- r- r- y- n- l- g- p- t- v- c- n- b- r- r-
- Ja -Fe -Ma -Ap Ma -Ju 1-Ju -Au -Se -Oc -No -De -Ja -Fe -Ma -Ap
30 29 31 30 31- 30 3 31 30 31 30 31 31 28 31 30
AMIHUD
0.06
0.04
0.02
0.00
–0.02
–0.04
–0.06
–0.08
–0.10
20 20 20 20 20 20 20 20 20 20 20 20 21 21 21 21
a n- eb- ar- pr- ay- un- Jul- ug- ep- ct- ov- ec- an- eb- ar- pr- Figure 2.
- J -F M -A M -J - A -S -O N D -J -F M -A Cumulative average
30 29 31- 30 31- 30 31 31- 30 31 30- 31- 31 28 31- 30 daily stock liquidity of
Vietnam-listed
banking, finance and
insurance companies
CPQSAJEB 4000.00
3500.00
3000.00
2500.00
2000.00
1500.00
1000.00
500.00
0.00
20 -20 r-20 r-20 -20 -20 l-20 -20 -20 t-20 -20 -20 -21 -21 r-21 r-21
n- eb a p ay un u ug ep c ov ec an eb a p
-Ja -F 1-M 0-A -M 0-J 31-J 1-A 0-S 1-O 0-N 1-D 1-J 8-F 1-M 0-A
30 2 9 3 3 3 1 3 3 3 3 3 3 3 2 3 3
CASES
40.00
35.00
30.00
25.00
20.00
15.00
10.00
5.00
0.00
20 -20 r-20 r-20 -20 -20 l-20 -20 -20 t-20 -20 -20 -21 -21 r-21 r-21
n- b y n g p v c n b
Figure 3. - Ja -Fe -Ma -Ap Ma -Ju 1-Ju -Au -Se -Oc -No -De -Ja -Fe -Ma -Ap
Number of daily 30 29 31 30 31- 30 3 31 30 3
1
30 31 3
1 28
31 30
COVID-19 confirmed
cases and deaths in
Vietnam
DEATHSCPQSi;t ¼ α21 þ α22 CASE Gt−1 þ α23 DEATH Gt−1 þ α24 MARCAPi;t−1 þ α25 MTBi;t−1 Stock market
þ e2i;t (3) returns and
liquidity
Models (4–6) assess the impact of the COVID-19 outbreak on stock returns and liquidity
before the imposition of lockdown:
DSRi;t ¼ β01 þ β02 CASE Gt−1 þ β03 DEATH Gt−1 þ β04 MARCAPi;t−1 þ β05 MTBi;t−1
þ β06 D BFLOCKi;t þ θ0i;t (4)
AMIHUDi;t ¼ β11 þ β12 CASE Gt−1 þ β13 DEATH Gt−1 þ β14 MARCAPi;t−1 þ β15 MTBi;t−1
þ β16 D BFLOCKi;t þ θ1i;t
(5)
CPQSi;t ¼ β21 þ β22 CASE Gt−1 þ β23 DEATH Gt−1 þ β24 MARCAPi;t−1 þ β25 MTBi;t−1
þ β26 D BFLOCKi;t þ θ2i;t (6)
Models (7–9) investigate the impact of the COVID-19 outbreak on stock returns and liquidity
after the imposition of lockdown:
DSRi;t ¼ ω01 þ ω02 CASE Gt−1 þ ω03 DEATH Gt−1 þ ω04 MARCAPi;t−1 þ ω05 MTBi;t−1
þ ω06 D LOCKi;t þ ω0i;t (7)
AMIHUDi;t ¼ ω11 þ ω12 CASE Gt−1 þ ω13 DEATH Gt−1 þ ω14 MARCAPi;t−1 þ ω15 MTBi;t−1
þ ω16 D LOCKi;t þ ω1i;t
(8)
CPQSi;t ¼ ω21 þ ω22 CASE Gt−1 þ ω23 DEATH Gt−1 þ ω24 MARCAPi;t−1 þ ω25 MTBi;t−1
þ ω26 D LOCKi;t þ ω2i;t
(9)
Models (10–12) explore the impact of the COVID-19 outbreak on stock returns and market
liquidity of large and small market capitalization stocks:
DSRi;t ¼ w01 þ w02 CASE Gt−1 þ w03 DEATH Gt−1 þ w04 MARCAPi;t−1 þ w05 MTBi;t−1
þ w06 D MRKi;t−1 þ e0i;t
(10)
AMIHUDi;t ¼ w11 þ w12 CASE Gt−1 þ w13 DEATH Gt−1 þ w14 MARCAPi;t−1 þ w15 MTBi;t−1
þ w16 D MRKi;t−1 þ e1i;t
(11)
CPQSi;t ¼ w21 þ w22 CASE Gt−1 þ w23 DEATH Gt−1 þ w24 MARCAPi;t−1 þ w25 MTBi;t−1
þ w26 D MRKi;t−1 þ e2i;t
(12)AJEB 3.2.2 Measurement of variables. DSRi;t indicates the return of stock i on day t. The daily return
of a stock measures the changes in the stock’s closing prices for any two consecutive trading
days (Keythman, 2018). The formula of daily stock return used in many previous studies such
as Al-Awadhi et al. (2020), Anh and Gan (2021) and Keythman (2018) is as follows:
DSRi;t ¼ lnðPi;t Pi;t−1 Þ
where Pi;t and Pi;t−1 are the closing prices of stock i on day t and t 1, respectively.
AMIHUDi;t is a liquidity ratio that reflects the market depth, as proposed by Amihud
(2002). AMIHUDi;t represents the price shock resulting from the volume of shares traded in
the day. The higher value of the indicator, the less liquid the market is. According to Amihud
(2002), this variable can be calculated as follows:
jDSRi;t j
AMIHUDi;t ¼
LnðVolumei;t Þ
where Volumei;t represents the dollar volume of stock i at day t.
CPQSi;t is another liquidity ratio that measures the market tightness, as also developed by
Chung and Zhang (2014). CPQSi;t reflects the difference between the ask and bid prices of a
stock on the day. The higher value of the indicator, the higher the transaction cost incurred.
According to studies of Gao et al. (2020) and Mdaghri et al. (2021), this variable is calculated
using the following equation:
Aski;t Bidi;t
CPQSi;t ¼
ðAski;t þ Bidi;t Þ 2
where Aski;t and Bidi;t are, respectively, the ask and the bid closing prices of stock i at day t.
CASE Gi;t is the growth rate of confirmed COVID-19 cases on day t. The indicator can be
determined as suggested by Al-Awadhi et al. (2020) as follows:
CASEi;t CASEi;t−1
CASE Gi;t ¼
CASEi;t−1
where CASE Gi;t and CASEi;t−1 are the number of confirmed COVID-19 cases on day t and
t 1, respectively.
DEATH Gi;t is the growth rate of COVID-19-related deaths reported on day t. The formula
computing this variable (Al-Awadhi et al., 2020) is:
DEATHi;t DEATHi;t−1
DEATH Gi;t ¼
DEATHi;t−1
where DEATHi;t and DEATHi;t−1 are the number of reported COVID-19-related deaths on day
t and t1, respectively.
MARCAPi;t represents the market capitalization of company i on day t. It is the total
market value of all outstanding shares of the listed company and hereby is considered a valid
measurement of firm size. In such research as by Al-Awadhi et al. (2020) and Anh and Gan
(2021), the equation of market cap can be computed as:
MARCAPi;t ¼ Lnðmarket capitalization of company i on day tÞ
MTBi;t is the market-to-book ratio of a company on day t. Market value is a determinant of
investor expectation toward the company’s future cash flows; meanwhile, book value is the
actual amount spent on the business operation to generate profit for the company in specific
and added value for the economy in general. Market-to-book ratio reflects the return on eachunit of currency invested relative to the coexpected book value. Following the previous studies Stock market
of Al-Awadhi et al. (2020) and Anh and Gan (2021), this ratio can be calculated as below: returns and
Market value of company i on day t liquidity
MTBi;t ¼
Book value of company i on day t
D MRKi;t is a dummy variable whose value equals 1 if market capitalization of a stock is in
large 50th percentile; and zero otherwise.
D BFLOCK ji;t is a dummy variable representing different periods before the
Government imposed lockdown, which has four variants as follows:
D BFLOCK 1i;t equals 1 if the day is before April 1st, 2020; and zero otherwise.
D BFLOCK 2i;t equals 1 if the day is during the period from April 16th, 2020 to July 27th,
2020; and zero otherwise.
D BFLOCK 3i;t equals 1 if the day is during the period from September 11th, 2020 to
January 27th, 2021; and zero otherwise.
D BFLOCK 4i;t equals 1 if the day is during the period from March 3rd, 2021 to May 3rd,
2021; and zero otherwise.
D LOCK ji;t is a dummy variable representing different periods after the Government
imposed lockdown, which has four variants as follows:
D LOCK 1i;t equals 1 if the day is during the period from April 1st, 2020 to April 15th,
2020; and zero otherwise.
D BFLOCK 2i;t equals 1 if the day is during the period from July 28th, 2020 to September
10th, 2020; and zero otherwise.
D BFLOCK 3i;t equals 1 if the day is during the period from January 28th, 2021 to March
2nd, 2021; and zero otherwise.
D BFLOCK 4i;t equals 1 if the day is during the period from May 4th, 2021 onward; and
zero otherwise.
3.2.3 Estimation method. Panel data regression helps to minimize issues regarding estimation
biases, multicollinearity and individual heterogeneity and also to detect how the relationship
between dependent and independent variables changes over time (Baltagi, 2008; Hsiao, 2014).
According to Bell and Jones (2015), the random-effects model is more appropriate and
provides more explanatory power than the fixed one. As advocated by past studies of
Al-Awadhi et al. (2020) and Anh and Gan (2021), a panel data regression model with random
effects is developed in this paper.
4. Empirical results
4.1 Summary of descriptive statistics and multicollinearity test
Table 1 provides the summary statistics of the variables under consideration, including average
value, minimum value, maximum value and SD. Notably, the average daily stock returns (DSR)
of Vietnamese-listed companies in the financial services sector are 0.184%. Liquidity ratios
indicated by AMIHUD and CPQS have respective mean values of 0.098 and 0.014%. The
average growth rates of daily confirmed cases and deaths are equivalent to 3.027 and 1.545%,
respectively. The natural logarithm of daily market capitalization is approximately 28.68. Last
but not least, the average market-to-book ratio takes a value of 1.01.
Table 2 represents the correlation matrix and the VIF coefficients of the independent
variables. The correlation among the independents is found weak, except for the one betweenAJEB MARCAP and MTB variables. Nevertheless, the VIF values of all independent variables in
the model are smaller than 3, implying no multicollinearity detected in the model.
4.2 Regression results
4.2.1 Impact of the COVID-19 outbreak on stock returns and market liquidity. Table 3 provides
the results of panel data regression with random effects in Models (1–3).
The results of Model (1) suggest that the growth rate of daily confirmed cases in Vietnam
has a negative and significant effect on the stock returns of Vietnamese-listed companies
operating in the banking, finance and insurance industry. It is consistent with the research
findings of Al-Awadhi et al. (2020) and Anh and Gan (2021), which claim that the COVID-19
outbreak has deteriorated the stock returns of most companies in the market. The negative
nexus between the increasing number of daily deaths and the returns on stock, however, is
found statistically insignificant. It is due to the characteristics of the data used in the model.
That is, the COVID-19-related deaths recorded in Vietnam are relatively low, and most of
them occurred in the elderly or those with preexisting morbidity.
In Models (2) and (3), there exists a significantly positive nexus between the two liquidity
ratios, AMIHUD and CPQS, and the growth rate of daily COVID-19 infections in Vietnam.
These findings confirm that the worsening severity of the COVID-19 hinders the depth of
Vietnam’s stock market and soars the transaction cost incurred. However, the daily increase in
COVID-19 deaths in Vietnam does not appear to have a significant impact on market tightness
and depth. This finding is consistent with the empirical results of Mdaghri et al. (2021).
Regarding company-related characteristics, under the impact of the COVID-19 pandemic,
market capitalization has a significant and positive correlation to stock returns. Meanwhile,
market-to-book ratio is found significantly negatively correlated with stock profits. These
results imply that Vietnam-listed banking, insurance and financial companies with
overvalued stocks yet low market capitalization tend to yield lower stock returns amid the
pandemic outbreak, which is congruent with previous studies of Al-Awadhi et al. (2020) and
Anh and Gan (2021). Yet, market-to-book ratio has a significant and positive nexus with
market depth and tightness. Nevertheless, the regression results of the two models show a
significantly negative correlation between market capitalization and both market depth and
tightness as advocated by a study of Mdaghri et al. (2021).
4.2.2 Impact of the COVID-19 pandemic on stock returns and market liquidity before and
after the imposition of lockdown. Table 4 indicates the results of panel data regression with
random effects applied for Models (4) and (7). Specifically, the regression coefficients of
dummy variables D_BFLOCK_1 and D_BFLOCK_2 are both negative and significant at 1%
level. This suggests a negative impact of the COVID-19 pandemic on the stock returns of
banking, finance and insurance companies in Vietnam before the first two nationwide
lockdowns (before April 1st, 2020 and from April 16th to July 27th, 2020). It may be attributed
to investor anxiety over the prospect of the COVID-19 outbreak plunging into chaos on
Vietnam’s stock market. Yet, the coefficients of two dummy variables D_BFLOCK_3 and
Variable N Mean SD Min Max
AMIHUD 16,100 0.00098 0.00129 0.00000 0.02667
CPQS 16,100 0.00140 0.03136 0.22222 0.20000
DSR 16,100 0.00184 0.03338 0.23889 0.47000
CASES_G 16,100 0.03027 0.12073 0.00000 1.50000
DEATHS_G 16,100 0.01545 0.13001 0.00000 2.00000
MARCAP 16,100 28.67908 2.24604 17.59970 33.62249
Table 1. MTB 16,100 1.00935 0.64396 0.00000 4.01000
Descriptive statistics Source(s): Authors’ calculationsAMIHUD CPQS DSR CASES_G DEATHS_G MARCAP MTB
Stock market
returns and
AMIHUD 1.0000 liquidity
CPQS 0.0496 1.0000
DSR 0.0416 0.6259 1.0000
CASES_G 0.0589 0.0338 0.0958 1.0000
DEATHS_G 0.0044 0.0447 0.0271 0.0917 1.0000
MARCAP 0.1985 0.0361 0.0020 0.0171 0.0127 1.0000
MTB 0.1217 0.0561 0.0160 0.0432 0.0383 0.7805 1.0000
VIF (mean 5 1.79) 1.01 1.01 2.56 2.57 Table 2.
Source(s): Authors’ calculations Correlation matrix
Variable Model (1) Model (2) Model (3)
CASES_G 0.01585 (0.00361)
*** **
0.00036 (0.00016) 0.00795** (0.00386)
DEATHS_G 0.00450 (0.00369) 0.00014 (0.00015) 0.00556 (0.00349)
MARCAP 0.00038*** (0.00014) 0.00009** (0.00005) 0.00132*** (0.00035)
MTB 0.00231*** (0.00058) 0.00017** (0.00007) 0.00940*** (0.00184) Table 3.
_CONS 0.00560 (0.00370) 0.00332** (0.00131) 0.02576*** (0.00902) Regression results of
Note(s): Robust SEs are in parentheses. ***p < 0.01; **p < 0.05 Models (1–3)
D_BFLOCK_4, despite being consistent with expected negative signs, are statistically
insignificant. This result implies that investor sentiment in the two periods from September
11th, 2020 to January 27th, 2021 and from March 3rd to May 3rd, 2021 appeared to be less
concerned about the influence of the COVID-19 outbreak as in previous periods.
It is worth noting that the regression coefficients of all dummy variables for D_LOCK_J
are positive and significant at 1% or 5% level. The result indicates a positive impact of the
lockdown measures on stock returns of the banking, finance and insurance companies listed
on Vietnam’s stock exchanges, which is also consistent with past research of Anh and Gan
(2021). One of the reasons for this is an increase in investor confidence toward the
Government’s well-organized pandemic control programs and policies.
Table 5 displays the results of panel data regression with random effects conducted in
Models (4) and (7). As shown, the coefficients of dummy variables D_BFLOCK_1 and
D_BFLOCK_2 are positive, whereas it is found negative for D_BFLOCK_3, although all of them
are not statistically significant. Meanwhile, the coefficient of the dummy variable D_BFLOCK_4
is negative and significant at 1% level, implying that the COVID-19 outbreak seemingly does not
hamper the depth of the stock market during the fourth nonlockdown period.
The coefficient of dummy variable D_LOCK_1 is found positive yet statistically
insignificant; meanwhile, the one of D_LOCK_2 is negative and significant at 1% level. It
suggests that the market depth appears not to be affected during the first two lockdowns.
Nevertheless, the coefficients of D_LOCK_3 and D_LOCK_4 yield positive values and are all
significant at 1 and 10% level, respectively, showing that the COVID-19 outbreak greatly
influences the stock markets during the more recent lockdown periods.
Table 6 represents the results of panel data regression with random effects from Models
(6) and (9). The coefficient of D_BFLOCK_1 is negative at 1% level of significance, implying a
drop in transaction costs of the stock market attributed to the COVID-19 during the period
before the first lockdown. The coefficients of two dummy variables D_BFLOCK_2 and
D_BFLOCK_3, despite their opposite signs, are both statistically insignificant, indicating
that the epidemic outbreak does not have any significant effect on the tightness of the stock
market during the next two periods. A contrasting result, however, is found for the coefficientAJEB
Table 4.
Models (4) and (7)
Regression results of
Model (4) Model (7)
Variable (DSR) (1) (2) (3) (4) (5) (6) (7) (8)
*** *** *** *** *** *** *** ***
CASES_G 0.01241 (0.00363) 0.01606 (0.00365) 0.01494 (0.00354) 0.01525 (0.00360) 0.01508 (0.00354) 0.01500 (0.00356) 0.01502 (0.00359) 0.01518 (0.00357)
DEATHS_G 0.00429 (0.00369) 0.00433 (0.00371) 0.00307 (0.00370) 0.00334 (0.00368) 0.00297 (0.00371) 0.00663 (0.00446) 0.00288 (0.00367) 0.00318 (0.00368)
MARCAP 0.00069*** (0.00021) 0.00064*** (0.00021) 0.00072*** (0.00022) 0.00074*** (0.00023) 0.00075*** (0.00022) 0.00075*** (0.00022) 0.00068*** (0.00021) 0.00070*** (0.00021)
MTB 0.00245*** (0.00085) 0.00214*** (0.00079) 0.00261*** (0.00087) 0.00273*** (0.00099) 0.00279*** (0.00092) 0.00278*** (0.00091) 0.00234*** (0.00083) 0.00250*** (0.00085)
(1) D_BFLOCK_1 0.00246*** (0.00072)
(2) D_BFLOCK_2 0.00270*** (0.00073)
(3) D_BFLOCK_3 0.00044 (0.00054)
(4) D_BFLOCK_4 0.00047 (0.00120)
(5) D_LOCK_1 0.00558** (0.00249)
(6) D_LOCK_2 0.00217** (0.00088)
(7) D_LOCK_3 0.00518*** (0.00099)
(8) D_LOCK_4 0.00375*** (0.00026)
*** *** *** *** *** ***
_CONS 0.02066 (0.00548) 0.01971 (0.00537) 0.02079 (0.00556) 0.02147 (0.00593) 0.02147 (0.00574) 0.02141 (0.00570) 0.01961*** (0.00550) 0.02045*** (0.00557)
Note(s): Robust SEs are in parentheses. ***p < 0.01; **p < 0.05Model (5) Model (8)
Variable (AMIHUD) (1) (2) (3) (4) (5) (6) (7) (8)
* ** ** ** ** ** ** **
CASES_G 0.00030 (0.00016) 0.00037 (0.00016) 0.00035 (0.00016) 0.00035 (0.00016) 0.00037 (0.00016) 0.00035 (0.00016) 0.00037 (0.00016) 0.00036 (0.00016)
DEATHS_G 0.00011 (0.00014) 0.00013 (0.00015) 0.00015 (0.00015) 0.00014 (0.00015) 0.00013 (0.00015) 0.00006 (0.00015) 0.00013 (0.00015) 0.00014 (0.00015)
MARCAP 0.00009* (0.00005) 0.00009* (0.00005) 0.00009* (0.00005) 0.00009* (0.00005) 0.00009* (0.00005) 0.00009* (0.00005) 0.00009* (0.00005) 0.00009* (0.00005)
MTB 0.00018** (0.00007) 0.00017** (0.00007) 0.00017** (0.00007) 0.00023*** (0.00009) 0.00018** (0.00007) 0.00015** (0.00007) 0.00015** (0.00007) 0.00016** (0.00007)
(1) D_BFLOCK_1 0.00006 (0.00005)
(2) D_BFLOCK_2 0.00002 (0.00003)
(3) D_BFLOCK_3 0.00002 (0.00003)
(4) D_BFLOCK_4 0.00014** (0.00005)
(5) D_LOCK_1 0.00014 (0.00010)
(6) D_LOCK_2 0.00013*** (0.00005)
(7) D_LOCK_3 0.00020*** (0.00005)
(8) D_LOCK_4 0.00018* (0.00010)
_CONS 0.00327** (0.00130) 0.00332** (0.00131) 0.00332** (0.00131) 0.00334** (0.00132) 0.00331** (0.00130) 0.00331** (0.00131) 0.00334** (0.00132) 0.00334*** (0.00130)
Note(s): Robust SEs are in parentheses. ***p < 0.01; **p < 0.05; *p < 0.01
returns and
Stock market
Regression results of
liquidity
Models (5) and (8)
Table 5.AJEB
Table 6.
Models (6) and (9)
Regression results of
Model (6) Model (9)
Variable (CPQS) (1) (2) (3) (4) (5) (6) (7) (8)
*** ** ** *** ** ** ** **
CASES_G 0.01177 (0.00357) 0.00823 (0.00388) 0.00758 (0.00379) 0.00978 (0.00381) 0.00786 (0.00386) 0.00780 (0.00388) 0.00758 (0.00387) 0.00784 (0.00385)
DEATHS_G 0.00702** (0.00345) 0.00521 (0.00351) 0.00588* (0.00356) 0.00435 (0.00342) 0.00586* (0.00352) 0.00272 (0.00364) 0.00660* (0.00351) 0.00525 (0.00348)
MARCAP 0.00126*** (0.00034) 0.00136*** (0.00035) 0.00133*** (0.00035) 0.00069** (0.00031) 0.00128*** (0.00035) 0.00129*** (0.00035) 0.00152*** (0.00036) 0.00119*** (0.00034)
MTB 0.00902*** (0.00178) 0.00963*** (0.00196) 0.00946*** (0.00185) 0.00556*** (0.00136) 0.00917*** (0.00183) 0.00920*** (0.00184) 0.01075*** (0.00207) 0.00858*** (0.00171)
(1) D_BFLOCK_1 0.00344*** (0.00107)
(2) D_BFLOCK_2 0.00083 (0.00074)
(3) D_BFLOCK_3 0.00073 (0.00062)
(4) D_BFLOCK_4 0.01175*** (0.00101)
(5) D_LOCK_1 0.00504** (0.00241)
(6) D_LOCK_2 0.00184** (0.00094)
(7) D_LOCK_3 0.01551*** (0.00152)
(8) D_LOCK_4 0.01544*** (0.00162)
_CONS 0.02500*** (0.00887) 0.02643*** (0.00911) 0.02619*** (0.00907) 0.01019 (0.00813) 0.02510*** (0.00899) 0.02519*** (0.00899) 0.03120*** (0.00943) 0.02266*** (0.00873)
Note(s): Robust SEs are in parentheses. ***p < 0.01; **p < 0.05; *p < 0.01of D_BFLOCK_4 in which it is positive at 1% level of significance, meaning that transaction Stock market
costs in the stock market rise under the impact of the COVID-19 over the most recent before- returns and
lockdown period.
When examining the effect of lockdowns in Models (6) and (9), it is shown that the
liquidity
coefficients of such dummy variables as D_LOCK_1, D_LOCK_2 and D_LOCK_3 are all
positive and significant at 1% or 5% level, indicating there exists a drop in the transaction
costs incurred during these periods. Nevertheless, the coefficient of the last dummy variable
D_LOCK_4 is positive at 1% level of significance, implying increasing costs in the stock
market during the latest lockdown period
4.2.3 Market capitalization analysis. Table 7 displays the regression results with random
effects from Models (10–12) that examine the performance of large-cap and small-cap stocks
of Vietnam-listed banking, finance and insurance companies. During the COVID-19 surges,
large-cap stocks have a notable impact in terms of returns as compared to small-caps. This
means firms with smaller market capitalization tend to yield lower returns than those with
higher market cap amid the pandemic outbreak in Vietnam, which is against Al-Awadhi et al.
(2020). Notwithstanding such contrasting arguments, the results show no difference in
market liquidity among firms with varied market capitalization.
5. Conclusion and implication
This paper examines the impact of the COVID-19 outbreak and the imposition of pandemic-
related lockdown on the stock returns and liquidity of 50 financial services companies listed
on Vietnam’s stock market from January 30th, 2020 to May 15th, 2021. By constructing panel
data regression models with random effects, the study confirms a significantly negative
impact of worsening COVID-19 situation on the stock returns and market liquidity. To put it
another way, the COVID-19 pandemic has tremendously affected the performance of the
financial services industry in Vietnam. This can be attributed to the industry’s sensibility and
vulnerability toward the risk of increasing bad debts and unusually large-scale deposit
withdrawals (Goodell, 2020). The study also reports a significant and negative nexus between
the growth rate of daily COVID-19-related cases and stock returns during before-lockdown
periods. Yet, the effect on market liquidity in such periods seems inconsiderable.
One notable finding in this study is the significant and positive influence of COVID-19
lockdown on the stock returns and liquidity of Vietnamese banking, finance and insurance
firms. The rationale behind this is a boost to investor confidence toward the Government’s
timely and effective containment strategies in response to the pandemic, especially during the
lockdown periods.
The study also investigates the impact of the COVID-19 epidemic on financial services
institutions with different sizes of market capitalization. We conclude that small-cap firms
tend to have lower returns on stocks as compared to larger firms during the pandemic
outbreak. Yet again, there is no difference in stock liquidity regarding company size.
Variable Model (10) Model (11) Model (12)
CASES_G 0.01583*** (0.00361) 0.00036** (0.00016) 0.00790** (0.00386)
DEATHS_G 0.00443 (0.00368) 0.00014 (0.00015) 0.00571 (0.00348)
MARCAP 0.00010 (0.00017) 0.00009 (0.00006) 0.00087** (0.00044)
MTB 0.00217*** (0.00059) 0.00017** (0.00007) 0.00909*** (0.00187)
D_MRK 0.00137** (0.00068) 0.00001 (0.00011) 0.00218 (0.00171) Table 7.
_CONS 0.00158 (0.00435) 0.00322** (0.00153) 0.01440 (0.01149) Regression results of
Note(s): Robust SEs are in parentheses. ***p < 0.01; **p < 0.05 Models (10–12)AJEB On the basis of empirical results, this paper proposes several implications for the
Government and investors. Firstly, to help the stock market overcome the crisis and recover
sustainably, the policymakers and local authorities need to proactively implement stringent
containment measures in a timely fashion to enhance investor confidence and be well-
prepared for the future waves of the pandemic. Secondly, investors should be self-informed
with the latest updates on the epidemic developments and their potential influence on both
the economy in general and the stock market in specific based on which a proper analysis for
effective and fast fashion response strategies can be carried out. In addition, investors need to
carefully consider whether a company has sustainable business performance and corporate
governance in the long term to avoid or minimize the impact of a new outbreak and other
unforeseeable events. This would also help investors seize investment opportunities that
optimize profits or mitigate losses.
References
Al-Awadhi, A.M., Alsaifi, K., Al-Awadhi, A. and Alhammadi, S. (2020), “Death and contagious
infectious diseases: impact of the COVID-19 virus on stock market returns”, Journal of
Behavioral and Experimental Finance, Vol. 27, p. 100326.
Alfaro, L., Chari, A., Greenland, A.N. and Schott, P.K. (2020), “Aggregate and firm-level stock returns
during pandemics, in real time”, Working Paper No. w26950, National Bureau of Economic
Research, Massachusetts.
Amihud, Y. (2002), “Illiquidity and stock returns: cross-section and time-series effects$”, Journal of
Financial Markets, Vol. 5, pp. 31-56.
Anh, D.L.T. and Gan, C. (2021), “The impact of the COVID-19 lockdown on stock market performance:
evidence from Vietnam”, Journal of Economic Studies, Vol. 48 No. 4, pp. 836-851.
Ashraf, B.N. (2020), “Stock markets’ reaction to COVID-19: cases or fatalities?”, Research in
International Business and Finance, Vol. 54, p. 101249.
Baig, A.S., Butt, H.A., Haroon, O. and Rizvi, S.A.R. (2021), “Deaths, panic, lockdowns and US equity
markets: the case of COVID-19 pandemic”, Finance Research Letters, Vol. 38, p. 101701.
Baltagi, B.H. (2008), Econometric Analysis of Panel Data, John Wiley & Sons, New York.
Bell, A. and Jones, K. (2015), “Explaining fixed effects: random effects modeling of time-series
cross-sectional and panel data”, Political Science Research and Methods, Vol. 3 No. 1,
pp. 133-153.
Chen, M.-H., Jang, S.S. and Kim, W.G. (2007), “The impact of the SARS outbreak on Taiwanese hotel
stock performance: an event-study approach”, International Journal of Hospitality Management,
Vol. 26 No. 1, pp. 200-212.
Chen, C.D., Chen, C.C., Tang, W.W. and Huang, B.Y. (2009), “The positive and negative impacts of the
SARS outbreak: a case of the Taiwan industries”, The Journal of Developing Areas, Vol. 43 No. 1,
pp. 281-293.
Chung, K.H. and Zhang, H. (2014), “A simple approximation of intraday spreads using daily data”,
Journal of Financial Markets, Vol. 17, pp. 94-120.
Eleftheriou, K. and Patsoulis, P. (2020), “COVID-19 lockdown intensity and stock market returns: a
spatial econometrics approach”, Working Paper No. 100662, University Library of Munich,
Munich.
Gao, Y., Zhao, W. and Wang, M. (2020), “The comparison study of liquidity measurements on the
Chinese stock markets”, Emerging Markets Finance and Trade, pp. 1-29, doi: 10.1080/1540496X.
2019.1709819.
Goodell, J.W. (2020), “COVID-19 and finance: agendas for future research”, Finance Research Letters,
Vol. 35, p. 101512.He, Q., Liu, J., Wang, S. and Yu, J. (2020), “The impact of COVID-19 on stock markets”, Economic and Stock market
Political Studies, Vol. 8 No. 3, pp. 275-288.
returns and
Hsiao, C. (2014), Analysis of Panel Data, Cambridge University Press, Cambridge.
liquidity
Ichev, R. and Marinc, M. (2018), “Stock prices and geographic proximity of information: evidence from
the Ebola outbreak”, International Review of Financial Analysis, Vol. 56, pp. 153-166.
Jiang, Y., Zhang, Y., Ma, C., Wang, Q., Xu, C., Donovan, C. and Sun, W. (2017), “H7N9 not only
endanger human health but also hit stock marketing”, Advances in Disease Control and
Prevention, Vol. 2 No. 1, p. 1.
Keythman, B. (2018), “How to calculate daily stock return”, available at: https://pocketsense.com/
calculate-daily-stock-return-5138.html (accessed 17 November 2018).
Liu, H., Manzoor, A., Wang, C., Zhang, L. and Manzoor, Z. (2020), “The COVID-19 outbreak and
affected countries stock markets response”, International Journal of Environmental Research
and Public Health, Vol. 17 No. 8, p. 2800.
Mdaghri, A.A., Raghibi, A., Thanh, C.N. and Oubdi, L. (2021), “Stock market liquidity, the great lockdown
and the COVID-19 global pandemic nexus in MENA countries”, Review of Behavioral Finance,
Vol. 13 No. 1, pp. 51-68.
Mishra, P.K. (2020), “COVID-19, Black Swan events and the future of disaster risk management in
India”, Progress in Disaster Science, Vol. 8, p. 100137.
Phuong, L.C.M. (2021), “How COVID-19 impacts Vietnam’s banking stocks: event study method”,
Banks and Bank Systems, Vol. 16 No. 1, pp. 92-102.
Sohrabi, C., Alsafi, Z., O’Neill, N., Khan, M., Kerwan, A., Al-Jabir, A. and Agha, R. (2020), “World
Health Organization declares global emergency: a review of the 2019 novel coronavirus
(COVID-19)”, International Journal of Surgery, Vol. 76, pp. 71-76.
Taleb, N.N. (2007), The black Swan: The Impact of the Highly Improbable, Random House, New
York, Vol. 2.
Van Hoof, E. (2020). “Lockdown is the world’s biggest psychological experiment-and we will pay the
price”, Paper Presented at the World Economic Forum.
WHO (2020), “Coronavirus disease 2019 (COVID-19)”, available at: https://covid19.who.int/ (accessed
21 September 2020).
Zhang, D., Hu, M. and Ji, Q. (2020), “Financial markets under the global pandemic of COVID-19”,
Finance Research Letters, Vol. 36, p. 101528.
Corresponding author
Cuong Thanh Nguyen can be contacted at: cuongnt@ntu.edu.vn
For instructions on how to order reprints of this article, please visit our website:
www.emeraldgrouppublishing.com/licensing/reprints.htm
Or contact us for further details: permissions@emeraldinsight.comYou can also read