SOCIAL CIRCLE: Housing Market Analysis + Policy Recommendations - SOCIAL CIRCLE, GEORGIA - City of ...
←
→
Page content transcription
If your browser does not render page correctly, please read the page content below
SOCIAL CIRCLE:
              Housing Market Analysis +
               Policy Recommendations

                               Prepared for
                SOCIAL CIRCLE, GEORGIA

                                 June 2021

Prepared by
Informed, Insightful, Innovative
Grounded in Real-World Conditions, Backed up by Insightful Research and Analysis
For the past 20 years, KB Advisory Group has focused on helping clients understand how market and
economic forces impact their real estate development aspirations. Our advice is grounded in our teams’
deep experience in consulting and implementing for hundreds of satisfied clients. We understand what
it takes to create a feasible development project and turn it into reality.
KB Advisory Group provides advice to developers, landowners, investors, corporations, non-profits,
public authorities, and governments dealing with a wide range of real estate-related issues. We take
pride in providing our clients insightful, objective analyses based on a thorough understanding of market
trends and their financial implications. We are a trusted advisor and determined to go the extra mile
in helping our clients achieve their objectives; more than 50% of our assignments are from returning
                                                                                                                       KB Advisory Group
clients who recognize the value of our expertise.
                                                                                                                   focuses on the ideas that
We focus on the ideas that fall within the overlap of three drivers that shape our world: land and buildings,   fall within the overlap of three
                                                                                                                 drivers that shape our world:
public policy, and money and finance. Our goal is to help clients maximize the benefits of their
                                                                                                                        land + buildings,
economic development and real estate activities within five core capability areas:                                      public policy, and
                                                                                                                        money + finance.
Real Estate Markets: Thorough analysis of the economic and demographic drivers of real estate
markets and their potential, always seeking the best-fitting land use alternatives for a site or project.
Development Economics: Customized pro formas based on a flexible proprietary model to help
determine the most financially-feasible real estate development path.
Public Financing/Tax Increment Financing: Effective public financing plans and strategies to                    www.kbagroup.com
support clients’ complex projects, including assistance in creating and utilizing Tax Allocation Districts
(TAD), Georgia’s version of tax increment financing.
                                                                                                                       404.845.3550
Economic Impacts: Extensive experience preparing economic impact analyses for real estate
development, transportation, and major infrastructure to help make a case for moving a project forward.
Local Housing Analysis and Policy:We understand the complexities of affordable and market-rate
housing, and the policies, economics, and market forces define them.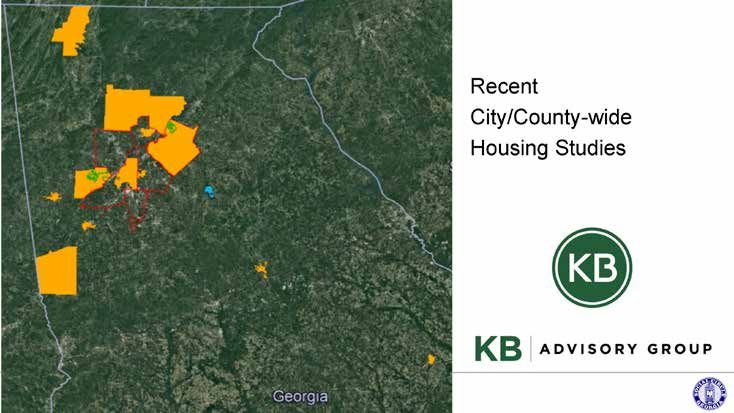
Table of Contents
                    04   Introduction

                    07   Recommendations

                    15   Geographic Context

                    17   Housing Demand Drivers

                    32   Residential Supply Assessment

                    41   Public Input

                    48   Appendix

                                                         Photo from Google Earth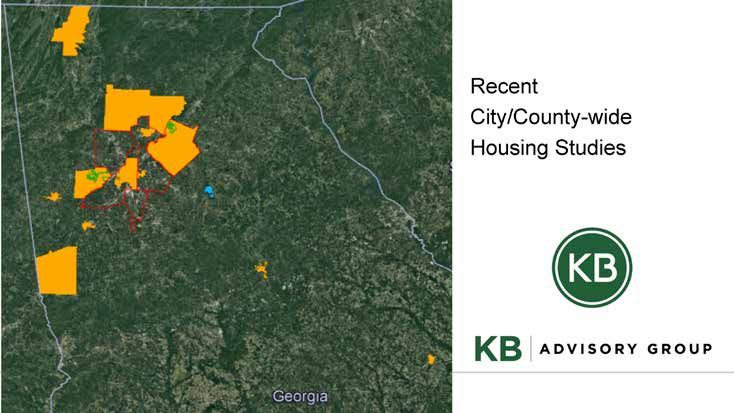
Introduction

               Housing Market Analysis + Policy Recommendations   4
introduction
                                              Purpose of this Analysis
                                                The City of Social Circle GA engaged KB Advisory Group, Inc. (KBA) to conduct a Housing
                                                Market Study in the spring of 2021.

                                                The assessment provides the City of Social Circle with a perspective on how current and
                                                future residential market trends will impact the city over the coming years. The research,
                                                analysis, and conclusions provide vital inputs for making future land use, planning, and real
                                                estate development policy decisions. The housing assessment has dual purposes: first is
                                                the technical analysis, which provides abundant data points and interesting insights into the
                                                local residential marketplace, which can inform and enhance decision-making processes
                                                for housing locally. The second is the communication aspect, which gives staff and elected
                                                officials the tools and information they need to communicate to constituents the rationale for
                                                crucial policies related to land use and housing.

                                                This Citywide Housing Study and Needs Analysis focuses on data analysis of the housing
                                                supply and demand drivers in Social Circle and housing discussion facilitation with the
                                                Planning Commission. The study examines the trends in the performance of the housing
                                                market in Social Circle and the broader regional market to define the current inventory and
                                                set of new developments, for-sale and rental communities, etc. It also assess the housing
                                                demand drivers in Social Circle by examining key local economic and demographic trends.

 Photo from Social Circle Facebook Timeline     The following report highlights the research, analysis, and conclusions of KB Advisory Group’s
                                                Social Circle Housing Market Study. This report was prepared by KB Advisory Group, Inc. on
                                                behalf of the City of Social Circle, GA. KB Advisory Group President Geoff Koski directed and
                                                managed the engagement.

                                                KB Advisory Group, Inc.
                                                1447 Peachtree St. NE
                                                Suite 610
                                                Atlanta, GA 30309
                                                404.845.3550
                                                www.kbagroup.com

                                                                                       Housing Market Analysis + Policy Recommendations       5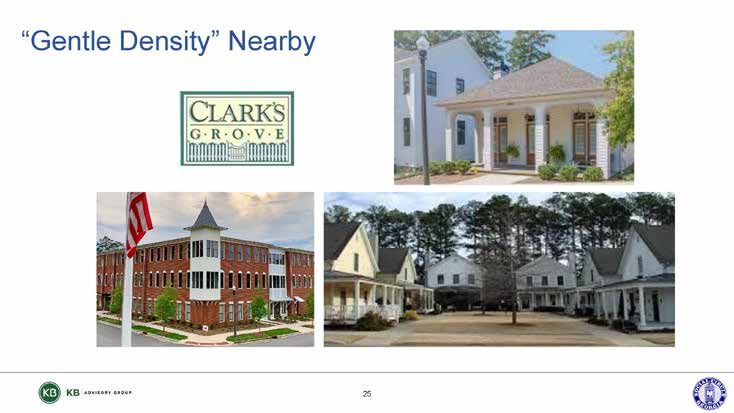
introduction
Social Circle Housing Supply and Demand
Analysis Highlights:
  J   71% homeownership rate.
                                                     Social Circle is a small city of roughly 1,500 homes. As the
      New constructions usually cost < $300,000.
                                                     Atlanta region continues pushing eastward on Interstate 20,
  J

  J   Lot prices have doubled in the last 5 years.   Social Circle faces the possibility of strong growth in the
                                                     decades to come.
  J   86% of housing is detached single-family.
                                                     The great challenge for the Social Circle will be the
  J   Multifamily housing is nearly nonexistent.     responsible management of its growth in the context of the
                                                     existing small-town charm.

Survey Highlights:                                   Neighboring cities are experiencing population booms,
                                                     bringing growth pressures, and expanded real estate markets,
  J   New constructions usually cost < $300,000.     meaning Social Circle is also prone to expansion pressure.

  J   Lot prices have doubled in the last 5 years.   In this current era of higher demand for increasing demand
                                                     for housing, how can Social Circle accept growth and
  J   86% of housing is detached single-family.      increase its tax base while continuing to offer residents and
  J   Multifamily housing is nearly nonexistent.     visitors a unique setting?

                                                     This study intends to help inform the local housing policy that
                                                     can help answer this essential question about homes.

                                                                 Housing Market Analysis + Policy Recommendations      6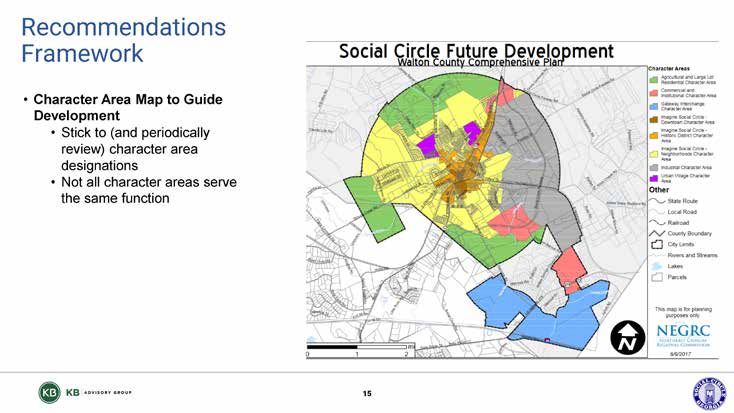
Recommendations

                  Housing Market Analysis + Policy Recommendations   7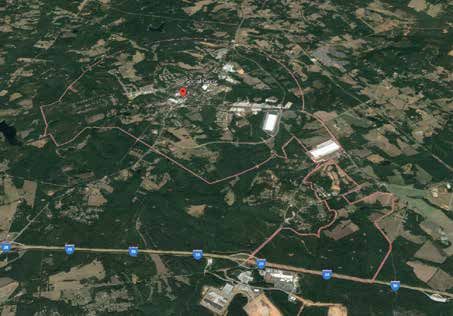
recommendations

 J   The recommendations detailed herein are based upon
     an examination of the local Social Circle housing
     dynamic, as part of this study, as well as knowledge
     and experience gained working to assist community
                                                                  Promote Neighborhood and Housing
     and economic development efforts in communities              Stability
     throughout Georgia.
 J   Each recommendation has been carefully offered
     and has the potential for success based on our                   Character Area Map to Guide
     understanding of the issues.
                                                                      Development
 J   Upon evaluation, the leadership of Social Circle may
     determine that one or more of the recommendations
     are appropriate for a particular time or location and then
     develop tactics for implementation.
                                                                        Definitive Community Standards

                                                                      Invest in Downtown

                                                                  Incorporate Impact Analysis in
                                                                  Development Reviews

                                                                     Housing Market Analysis + Policy Recommendations   8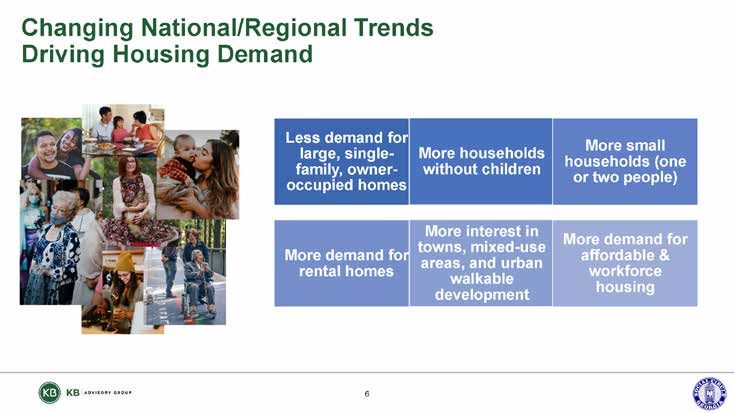
recommendations
Promote Neighborhood and Housing Stability
  J   Preservation and renovation of Social Circle’s current
      housing stock play an important role in meeting the city’s
      current and future housing demands.
  J   The most likely way to unlock funds to support Social
      Circle homeowners is to tap into state-level funding
      pools distributed to, and administered by, local
      governments. Accessing these funds can be competitive
      and necessitate meeting requirements. Any past failures
      in obtaining access to state-level funding for housing
      stability should not deter future attempts, given the
      importance of the endeavor.
  J   According to the Georgia Department of Community
      Affairs (DCA), they “provide services and programs
      that help local governments create quality
      communities. These include technical assistance,
      capacity development, best practice identification and
      implementation in areas such as local government
      planning, incorporating volunteerism, and downtown
      development, as well as wise resource management and
      conservation.” All of these initiatives can assist Social
      Circle in promoting neighborhood and housing stability.
  J   One initiative likely to make a significant impact in
      Social Circle is a Low-interest Rehabilitation Financing
      Program, including home rehabilitation, through grants
      and loans to homeowners, which a low-interest revolving
      loan fund could accomplish.

                                                                   Housing Market Analysis + Policy Recommendations   9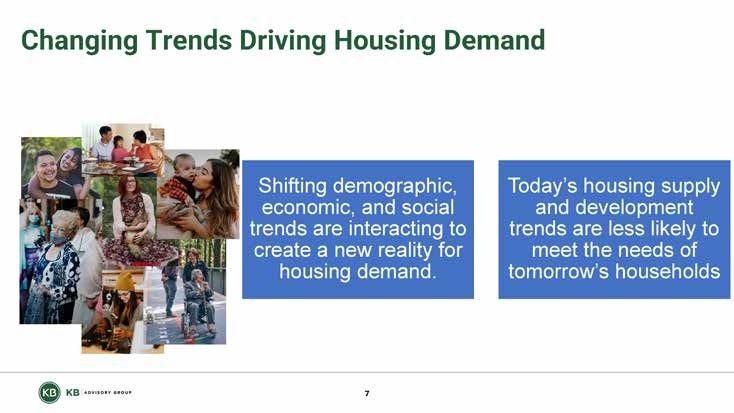
recommendations
Character Aea Map to Guide Development
  J   The Social Circle Comprehensive Plan,
      adopted in June 2017, was developed
      with extensive community input to
      provide a vision for land uses in the
      city through 2040. According to the
      plan document, it sought to balance
      uses, types of development, and
      long-term infrastructure elements to
      support the created vision.
  J   Included in the plan is the future
      development map shown on the right.
  J   A detailed review of the map, in the
      context of the public input gathered
      in this housing study process,
      affirmed that the future development
      identified in the Comprehensive Plan is
      well-vetted and a reasonable guide to
      the type and location of new housing
      additions in Social Circle.
  J   While some character areas in the map
      exclusively provide for commercial,
      industrial, and institutional uses and
      development, other areas speak
      specifically to residential uses.
  J   The areas that allow for future
      residential development are generally
      well-defined and should guide Social
      Circle’s planning decisions currently
      and in the future.

                                                Housing Market Analysis + Policy Recommendations   10
recommendations
Character Aea Map to Guide Development
J No areas call for high-density residential development J This study determined that the Urban Village area is
(defined here as greater than 35 units to the acre), but the appropriate for “gentle density,” which was discussed in
Downtown/Historic Districts allow for the highest density public meetings as part of this process. It would allow for
in Social Circle. This analysis agrees the areas should maximum densities of approximately 8-10 units per acre.
be considered for development—and in the appropriate In an Urban Village area, the existing Jubilee development
locations for up to approximately 35 units per acre—with is an example of gentle density in a small-lot single-family
outcomes more likely in the 10-20 units per acre realm. format. This scale of development should be carried through
to future development in the area, with the possibility of
J This scale of housing, supported by the most well-developed slightly higher-density formats such as townhomes. This
network of infrastructure in the city, can help to expand the scale would eliminate the possibility of higher densities
types of residential offerings available locally. Additionally, greater than 10 units per acre, which should be guided to the
these areas offer walkable access to Social Circle’s Downtown/Historic and Gateway Interchange Districts.
charming downtown and other recreational offerings,
meaning that new housing here can capture premium J Given that the Gateway Interchange District is the most
pricing compared to other places. This phenomenon has visible “blank slate” area in Social Circle near transportation
borne itself out in small and large downtowns of quality and other infrastructure, it is appropriate for densities
throughout Georgia. similar to, or potentially even higher than, the Downtown/
Historic Districts.
J Areas outside of the Downtown/Historic Districts that
can accept additional homes are generally reserved J Consideration must be given to the fact that the Gateway
for larger-lot/lower-density housing, and the character Interchange District is also likely to attract economic
envisioned should be upheld. development attention as a location for employment and
commercial activity. If planned and executed appropriately,
J However, the map is silent as to the potential type, the adjacency of these uses to housing can provide for
and density of residential uses in the following two highly-demanded single-family and multifamily units that
areas:planning decisions currently and in the future. can possibly attract premium end-user pricing, and at the
same time, also enhance the area’s value as employment
Urban Village
location.
•
• Gateway Interchange
Housing Market Analysis + Policy Recommendations 11recommendations
Definitive Community Standards
J Consider employing form-based codes and accompanying
pattern books to retain the unique character and encourage
predictable development.
J These tools can be used to aid design for the development and
redevelopment in a community based on standards developed
by the community.
J Typically, pattern books conform to already established local
zoning, which sets out the legal requirements for development
but provides additional design guidance to encourage
development that respects the existing community fabric.
J Form-based codes can further codify this planning style by
replacing a traditional zoning code with a code that more
resembles a pattern book.
J This recommendation to develop a pattern book affirms
the Social Circle Comprehensive Plan’s recommendations
that call for such a book to provide examples of the types of
development characteristics encouraged in each character area
to educate development applicants and developers regarding
the type of growth desired.
J The Comprehensive Plan also calls for an accompanying review
of zoning and subdivision ordinances to assure the districts
and regulations support the vision and character areas. This
recommendation should be followed regularly, on an ongoing
basis.
NOTE: Form-based pattern book
example from Milton, GA. Shown
here for illustrative purposes only.
Housing Market Analysis + Policy Recommendations 12recommendations
Invest in Downtown
J A vibrant downtown can be an asset and catalyst for the overall
Social Circle housing market because often today’s home
buyers and renters have a desire for downtown amenities
nearby, even if they live elsewhere.
J Encouraging residential development in the downtown core
can add to its attractiveness and provide support for more
restaurant and retail offerings, typically those of higher quality.
J To enhance downtown, the City could incentivize adaptive reuse
of attractive downtown buildings through streamlining approval
processes and assistance with exploring the use of historic tax
credits.
https://oldgeorgiahomes.com/2015/05/the-homes-of-social-circle/
J Further, Social Circle could utilize SPLOST funding to enhance
public infrastructure, including parks and trails that will make
downtown even more attractive.
J The Comprehensive Plan also calls for engaging downtown
property owners and business owners to update the downtown
master plan to include sidewalk widening and street-side
cafes, parking areas, downtown square, lodging, mill area, and
downtown living opportunities.
J Downtown is uniquely positioned to provide a greater array of
housing types
Housing Market Analysis + Policy Recommendations 13recommendations
Incorporate Impact Analysis in Development Rviews
J Impact analysis seeks to connect planning and local
economics by estimating the public costs and revenues
that result from property investments. This type of
analysis enables the comparison of revenues to costs
associated with new development, indicating whether
local government can meet new demands for services;
or must raise taxes to meet new service demands.
J As housing developers continue to propose new
residential uses throughout Social Circle, it will continue
to be important to understand the full range of costs and
benefits associated with a proposed development and,
where allowed by state law, can ensure that costs related
to infrastructure and services are recovered as part of
the approval process or that mitigation is provided.
Housing Market Analysis + Policy Recommendations 14Geographic Context
Housing Market Analysis + Policy Recommendations 15geographic context
The City of Social Circle, Georgia, lies mostly
in Walton County, and Newton County
comprises the surrounding Primary Market
Area (“PMA,” “Market Area”).
J Social Circle is located 45 miles east
of Atlanta, Georgia, on Interstate 20.
J Social Circle is primarily in Walton
County. A sliver of the city is in
Newton County.
J Nearby Cities include Monroe to the
north, Covington to the south, and
Conyers to the west.
J The one-way commute time for Social
Circle residents into Atlanta averages
50 minutes via I-20
Source: KB Advisory Group based on data from the ARC
Housing Market Analysis + Policy Recommendations 16Housing Demand Drivers
Economic and demograhic trends that influence the nature of housing
demand in Social Circle.
Housing Market Analysis + Policy Recommendations 17housing demand drivers
Regional Trends
J Fewer persons per household in the Atlanta Region, 2000 – 2020.
• Smaller households are driving growth.
• The shift towards fewer people per household corresponds with increased demand for smaller housing units across the Atlanta
Metro area.
J Lower access to home financing and stagnant wages.
• Mortgage access is down to 1/3 of pre-2008 levels.
• Lending standards have raised, and personal savings have fallen.
• Purchasing power is at a historic low for young and modest-income households.
J Home prices are increasing steadily.
• The average metro Atlanta home sale price has increased by 50% since 2012.
Atlanta Metro Home Prices Georgia Average Annual Wage Credit Availability
Case Shiller Index In Constant 2018 Dollars, from BLS Housing Credit
Availability Index (HCAI)
Housing Market Analysis + Policy Recommendations 18housing demand drivers
Regional Trends
These demographic, consumer and economic trends are combining to create demand for housing in the region that is fundamentally
different from the housing demand exhibited in the past:
Less demand for large,
More households More small households
single-family, owner-
without children (one or two people)
occupied homes
More interest in
More demand for
More demand for towns, mixed-use
affordable & workforce
rental homes areas, and urban
housing
walkable development
The study area’s housing demand model is changing due to growing preference for small households, shrinking access to financing, and
rising home prices.
A variety of housing types push this new housing demand model to equilibrium:
Small Homes for
Duplexes & Homes for
Smaller Homes Apartment Cottage Homes
Triplexes Seniors 20-Somethings
Buildings
Large
Small Single-Family Affordable Roommate
Apartment Condominiums
Townhomes Suburban Housing Housing
Buildings
The demand drivers affecting the broad metro Atlanta region do so in tandem in Social Circle. Therefore, the next section of this study
focuses on the city-level housing demand drivers in Social Circle.
Housing Market Analysis + Policy Recommendations 19housing demand drivers
Local Population Trends
J Between 2000 and 2010, the study area and the surrounding PMA had very high average annual household growth rates. While this
growth has slowed, a full contraction never occurred.
J Social Circle and the PMA experienced slow positive average household growth over the last decade.
J Social Circle’s household growth projections outpace the broader region.
J Across the country, populations are aging. Concurrently, young people with low access to capital are shopping for rentals and starter
homes, often losing out to developers and investors with higher buying power. Offering diverse housing types can stimulate population
growth well into the next decade.
Social Circle Population, Average Household Growth Rate
2000-2021 5.0%
6,000
4,925 4.0%
4,262
3.0% 2.6%
4,000 3,310
2.0% 1.5%
2,000 1.0%
0.0%
2000-2010 2010-2021
-
2000 Census 2010 Census 2021 Estimate Social Circle Walton County Newton County
Source: KB Advisory Group based on data from Claritas
Housing Market Analysis + Policy Recommendations 20housing demand drivers
Household Incomes
Social Circle’s 2020 median household income was 3% higher
Median Household Income
J
than that of Walton County.
$80,000 $72,691 $75,390
J Social Circle, Walton County, and Newton County all have $69,550 $71,628
slightly lower median household incomes than the broader $70,000
$60,000 100%
Atlanta metro region. 96% 92% 95%
$50,000
J Social Circle has the highest share of mid-range household $40,000
incomes ($50k - $100k) than the surrounding geographies. $30,000
$20,000
J Almost one-quarter of Social Circle residents have an annual $10,000
household income lower than $35k. $0
Social Circle Walton County Newton Atlanta MSA
J About 1 in 3 households in Social Circle report an annual County
income of more than $100k. 2020 Est. Median Household Income % of Atlanta MSA Median Income
Median Household Income Distribution
40% 36.1%
35% 29.6%
30% 24.7%
25%
20%
15%
10% 7.5%
5% 1.7%
0%
< $35K $35K - $50K $50K - $100K $100K - $250K $250K +
Social Circle Walton County Newton County Atlanta MSA
Source: KB Advisory Group based on data from Claritas, ACS
Housing Market Analysis + Policy Recommendations 21housing demand drivers
Generational Cohorts
These charts show that Social Circle houses comparatively more Population Breakdown:
children and more seniors than the PMA. Children & Seniors
J About 18% of Social Circle residents are seniors (age 65+).
30%
• The exhibit below, Population Breakdown: Generational 25%
Cohorts, indicates that 9% of Social Circle residents are 75
20%
or older.
15%
J Social Circle, Walton County, and Newton County differ from 10%
the Atlanta MSA in that their population distribution is bimodal,
5%
peaking at both Gen Z (ages 10-24) and Boomers (ages 55-74)
0%
• Atlanta MSA has a uniform distribution of Gen Z, Millennial, Social Circle Walton County Newton Atlanta MSA
Gen X, and Boomer generational cohorts. County
Children (0-17) Seniors (65+)
Population Breakdown: Generational Cohorts
25%
20% 21%
19% 18%
20%
15% 12%
10% 9%
5%
0%
Gen Alpha (0-9) Gen Z (10-24) Millenials (25-39) Gen X (40-54) Boomers (55-74) 75+
Social Circle Walton County Newton County Atlanta MSA
Source: KB Advisory Group based on data from Claritas
Housing Market Analysis + Policy Recommendations 22housing demand drivers
Household Composition
J Social Circle’s household size distribution is average for Metro Atlanta, nearly mirroring the Atlanta MSA’s distribution.
J Small (1 or 2 person) households are more prevalent in Social Circle than the surrounding counties.
J About 39% of households in Social Circle have children, yet 86% of the City’s housing stock is detached single-family.
• This mismatch is common throughout the region.
• While many households without children certainly desire a single-family home, the size of the home-to-household type disparity
points to opportunities to meet additional demand by providing a more comprehensive range of options for most households
that don’t have children present.
Household Size (Members)
% of Households With Children
60% 55% 56%
0% 10% 20% 30% 40% 50%
50%
40% Social Circle
32% 32%
30%
Walton County
20%
13% 12%
10% Newton County
0%
Social Circle Walton County Newton Atlanta MSA Atlanta MSA
County
Small (1 or 2 people) Medium (3-4 people) Large (5+ people)
Source: KB Advisory Group based on data from Claritas, ACS
Housing Market Analysis + Policy Recommendations 23housing demand drivers
Occupancy (Tenure)
Compared to Walton County and Newton County, Social Circle has
a 4% larger market share of renter-occupied units.
Newton County
J About 2/3 of homes are occupied by owners in the Atlanta MSA.
Social Circle, Walton County, and Newton County have higher
homeownership rates than the Atlanta MSA. 25%
High homeownership rates often reflect policies that emphasize
J
detached single-family zoning, especially as suburban markets
75%
continue to grow. Prohibitive zoning can create a discrepancy
between owner and renter-occupied housing.
Walton County
Social Circle
25%
75%
29%
71%
Atlanta MSA
34%
Renter-Occupied Units Owner-Occupied Units
66%
Source: KB Advisory Group based on data from Claritas
Housing Market Analysis + Policy Recommendations 24housing demand drivers
Housing Cost Burden Analysis
J Housing cost burden is
defined as paying more
than 30% of household
income for housing
(rent or mortgage, plus
utilities).
J AMI stands for Area
Median Income. It is
calculated and released
every year by the U.S.
Department of Housing
and Development (HUD).
AMI is the combined
average family income
for the Atlanta-Sandy
Springs-Roswell HUD
Fair Market Rent (FMR)
area. This area includes
both Newton and Walton
Counties.
J The charts included on
the next page examine
the existing cost burden
levels in Social Circle
distributed by AMI
range.
Housing Market Analysis + Policy Recommendations 25housing demand drivers
Housing Cost Burden Analysis
J Social Circle was home to 1,598 households in 2019, % Cost Burdened
according to the US Census’s most recent estimate
100.0%
in its American Community Survey.
90.0%
J As shown at right, over 54% of the approximately 80.0%
420 households who earn below 30% AMI are cost 70.0%
burdened, meaning they pay more than a third of
60.0%
their income on housing costs.
50.0%
J This group of lowest income earners in Social Circle 40.0%
are the most cost-burdened households. They
30.0%
are finding it increasingly difficult to afford to live
locally. Their out-sized housing expenses make their 20.0%
household spending on other essentials such as food 10.0%
and transportation extremely challenging. 0.0%housing demand drivers
Housing Cost Burden Analysis
J As shown at right, over % Cost Burdened Owners # Cost Burdened Owners
54% of the approximately
100.0% 120
100 owner households 90.0%
below 30% AMI are cost 80.0%
100
burdened, meaning they 70.0%
pay more than a third of 60.0%
80
their income on housing 50.0% 60
costs. 40.0%
40
30.0%
J One-quarter of owner 20.0%
20
households in the 31% 10.0%
to 50% AMI range, 51 in 0.0% -
total, are also consideredhousing demand drivers
Commuting Patterns
J Relatively few people choose to live
and work in Social Circle.
Social Circle Commuting
J Over 1,800 people commute into
Social Circle each day.
Patterns, 2018
J More than 1/3 of the City’s population
commutes out each workday.
J Social Circle’s position on I-20 makes
it an ideal city for commuters to 1,867 people: commute into 1,680 people: live in Social
settle down and raise families. Social Circle for work. Circle but commute out.
• The typical one-way commute
between Social Circle and the City
of Atlanta takes 50 minutes via
I-20.
• According to the Atlanta Regional
Commission’s 2019 Regional
160 people: both live and
Commuter Survey, the average
work in Social Circle.
one-way commute for Atlanta
workers (including teleworkers) is
39 minutes.
Source: KB Advisory Group based on data from U.S. Census Bureau, ACS
Housing Market Analysis + Policy Recommendations 28housing demand drivers
Commuting Patterns: All Residents
J This map displays the approximate work
destinations for all Social Circle commuters.
J Social Circle residents hold jobs across Georgia’s
Piedmont region. 75-mile one-way commutes are
not uncommon.
J 34% of Social Circle’s workers commute within
Walton or Newton County.
J Gwinnett and Fulton County attract more workers
from Social Circle than neighboring Rockdale
County, despite the distance.
J About 15% of Social Circle’s workers commute
into the City of Atlanta. Many also work in the
broader metro Atlanta regions of Cobb and
DeKalb counties.
J The counties to the immediate east of Social
Circle employ hundreds of the City’s residents.
J As we will examine in the next page, these
eastbound commute destinations generally
offer lower wages to Social Circle’s commuters.
Athens-Clarke County is an exception; many
Social Circle residents commute there for higher
wages.
Source: KB Advisory Group based on data from U.S. Census Bureau, ACS
Housing Market Analysis + Policy Recommendations 29housing demand drivers
Commuting Patterns: Based on Income
J These maps illustrate the commute destinations of Social Circle residents
who earn $40,000 or more each year.
J In the upper map, each dot represents one job worked by a Social Circle
resident.
• Each red dot represents one $40,000+ yearly job.
• Each blue dot represents one job under $40,000 yearly.
J The most popular destinations for Social Circle commuters who earn $40k or
more annually:
1. City of Social Circle (Walton County)
2. City of Covington (Newton County)
3. City of Monroe (Walton County) Commuting Patterns: Social Circle
4. City of Conyers (Rockdale County) Residents Earning $40,000 Yearly
5. City of Atlanta (Fulton County)
J A significant number of top-earning commuters disperse across the
northeastern metro Atlanta counties: Gwinnett, Dekalb, and Cobb.
J Clarke County is a popular eastward destination for Social Circle residents
who earn $40k+ annually.
J In the lower map, each dot represents 1 square mile where at least two Social
Circle residents work to earn $40,000 or more annually.
• Red dots represent high-density clusters of 15 or more $40k+ jobs worked
by Social Circle residents. Walton &
2+ $40k Jobs
Newton Co.
• Social Circle and its immediate surrounding area house more $40k+ jobs
than Atlanta. 15+ $40k Jobs Atlanta
Source: KB Advisory Group based on data from U.S. Census Bureau, ACS
Housing Market Analysis + Policy Recommendations 30housing demand drivers
Commuting Patterns: Distance and Direction
The following graphs illustrate a distance and direction analysis
Direction of Work from Residence of Social
J
of Social Circle commuters based on U.S. Census 2018 data.
Circle Commuters, Percentage
J 64% of Social Circle residents commute west, northwest, or
30%
southwest from their homes.
Percentage of Commuters
J Almost 5 times more Social Circle residents work north of their 20%
homes than south.
J Roughly 36% of Social Circle residents have a 25 to 50-mile 10%
commute. 25% have a 10 to 24-mile commute, and another 25%
have a less than 10-mile commute.
0%
J Over 200 Social Circle residents endure a daily one-way
commute of over 50 miles.
J Commute distance exhibits a fragile relationship with earnings
for Social Circle residents.
• Many residents of the City commute over an hour for wages Distance of Work from Residence of Social Circle
below $40,000 per year. Commuters, Sum
• However, many residents are rewarded with high wages for 800
long daily commutes into Atlanta.
• The inverse is also true. Thus, commute distance is not a 600
Commuters
predictor of wages for Social Circle residents.
400
J Commute direction exhibits a significant relationship with
earnings for Social Circle residents.
200
• Most high-paying jobs not in Walton or Newton County
require a westward commute towards Conyers or the City of 0
Atlanta. < 10 miles 10 to 24 miles 25 to 50 miles > 50 miles
• Social Circle residents who commute east, and especially Distance
north, are less likely to be paid more than $40,000 annually.
Source: KB Advisory Group based on data from U.S. Census Bureau, ACS
Housing Market Analysis + Policy Recommendations 31Residential Supply Assessment
Characteristics of Social Circle’s Housing Supply.
Housing Market Analysis + Policy Recommendations 32residential supply assessment
Unit Types
J 86% of Social Circle’s homes are single-family
detached. Housing Type Distribution
• Only 67% of homes are single-family detached in the 0% 20% 40% 60% 80% 100%
Atlanta MSA.
J 0% of Social Circle’s housing falls in the large
multifamily classification. Social Circle 86%
• About 21% of the Atlanta MSA’s housing stock is in
large multifamily buildings.
J Social Circle has a small share of small multifamily Walton County 82%
dwellings.
• While small, this share is statistically average for the
broader region.
Newton County 83%
Atlanta MSA 67%
1 Unit Detatched (SF) 1 Unit Attached (TH) Small Multi-Family
Lg Multi-Family Trailer, RV & Boat
Source: KB Advisory Group based on data from Claritas, CoStar
Housing Market Analysis + Policy Recommendations 33residential supply assessment
Building Permit Trends
J Social Circle has never permitted the development of large multifamily apartment buildings (5+ units).
• This is highly uncharacteristic of most Metro Atlanta cities.
J Social Circle permitted a few small multifamily developments: 2 units in 1997 and 12 units in 2007.
J In 2011, housing development ground to a halt, only to grow again in 2014.
J The following data, provided by the U.S. Department of Housing and Urban Development, indicates that building permit issuance has
been steadily increasing since 2014.
Social Circle Building Permits by Type, 1990-2019
140
120
100
80
60
40
20
0
1990
1992
1994
1996
1998
2000
2002
2004
2006
2008
2010
2012
2014
2016
2018
Units in Single-Family Structures Units in Small Multi-Family Structures
Source: KB Advisory Group based on data from HUD
Housing Market Analysis + Policy Recommendations 34residential supply assessment
Building Permit Trends
J Social Circle can stimulate growth by diversifying its housing stock.
• “Diversified housing stock” is not limited to apartments: it includes cottage homes, roommate housing, homes for people with
disabilities, smaller ranch-style homes for seniors, luxury townhomes, and affordable housing.
J Over 80% of Social Circle’s housing stock is single-family homes. While this is similar to Walton and Newton Counties, the counties
have a small presence of townhomes, which are lacking in Social Circle.
J Social Circle also lacks large multifamily residential stock. Walton and Newton offer small amounts of multifamily housing but not
nearly at the scale of the Atlanta region overall.
Single-Family Housing Stock Multifamily Housing Stock
100% 100%
80% 80%
60% 60%
40% 40%
20% 20%
0% 0%
Social Circle Walton County Newton County Atlanta MSA Social Circle Walton County Newton County Atlanta MSA
1 Unit Detatched (SF) 1 Unit Attached (TH) Trailer, RV & Boat Small Structure (2-4 Units/Bldg.) Large Structure (5+ Units/Bldg.)
Source: KB Advisory Group based on data from Claritas, HUD
Housing Market Analysis + Policy Recommendations 35residential supply assessment
Age of Homes
J The most significant percentage of Social Circle’s housing stock was constructed between 1980 and 1990.
J The single-family home construction patterns of Social Circle and the Atlanta MSA are relatively consistent.
• One key difference between the study area and the Atlanta MSA is that Social Circle has a smaller share of homes built pre-1980
and a more significant share of homes built between post-2010.
Housing Units by Year Built
50%
40% 36% 35%
30% 27% 27%
23%
21%
20% 16% 14%
10%
0%
Built pre-1980 Built 1980-1999 Built 2000-2009 Built 2010-2020
Social Circle Atlanta MSA
Source: KB Advisory Group based on data from Claritas
Housing Market Analysis + Policy Recommendations 36residential supply assessment
Home Values
J The median home value for Social Circle was $234,051 in 2020.
• Atlanta MSA’s median home value was over $30,000 greater.
J Homes in Walton County have a median value of about $30,000 more than homes in Newton County.
J According to the figure Home Value Distribution, Social Circle has a higher share of starter and mid-range homes than Atlanta.
Median Home Value Home Value Distribution
$0 $100,000 $200,000 $300,000 100%
7% 5% 5%
17%
Social Circle $234,051 80%
48%
52% 55%
60% 49%
Walton County $244,499
40%
Newton County 31% 36%
$212,364 29%
20% 25%
10% 8% 10% 8%
Atlanta MSA $265,272 0%
Social Circle Walton County Newton County Atlanta MSA
< $100K $100K-$200K $200K-$500K > $500K
Source: KB Advisory Group based on data from Claritas, CoStar
Housing Market Analysis + Policy Recommendations 37residential supply assessment
For-Sale New Home Construction Market: Recent Closings
J Social Circle’s new homes historically closed at relatively affordable prices (under $300k).
J A short-term trend analysis indicates a small but growing market for homes valued between $300k and $400k.
J The slight increase in homes closing in the $300’s signals population growth and rising affluence.
Detached New Construction Closings, 2015-2020
25
20
15
10
5
0
2015 2016 2017 2018 2019 2020
Less than $300,000 $300,000 - $400,000
Source: KB Advisory Group based on data from SmartRE
Housing Market Analysis + Policy Recommendations 38residential supply assessment
For-Sale New Home Construction Market: Component Cost Analysis
In 2015, the average new home price in Social Circle was
Lot to Home Ratio
J
$223,513.
J Following 5 years of fluctuating prices, the average new $300,000 14%
home price stabilized to $227,378 in 2020.
$250,000 12%
J During these 5 years, average lot prices showed stable
growth. The average lot price almost doubled from
$15,099 in 2015 to $27,859 in 2020. 10%
$200,000
J The price of lots almost doubling over five years has so
far not caused home values to spike. 8%
$150,000
• The average lot-to-home price ratio has increased
5% in 5 years. It was 7% in 2015 and 12% in 2020. 6%
• This may signal that developers anticipate rising $100,000
4%
home prices in Social Circle in the coming years.
$50,000 2%
$- 0%
2015 2016 2017 2018 2019 2020
Avg. Lot Price Avg. Home Price Price Ratio
Source: KB Advisory Group based on data from SmartRE
Housing Market Analysis + Policy Recommendations 39local housing demand drivers
Summary Matrix
The chart to the right serves to benchmark for Social Housing Demand
Circle’s housing market against the comparison Social Circle Walton County Newton County
Drivers
geographies.
Household Growth
1.32% 1.31% 1.26%
(2010‐2020)
Median Household
$72,691 $69,550 $71,628
Income (2020)
% Owner Occupied 71% 75% 75%
% 1‐2 Person Households 55% 51% 50%
% Households with
39% 41% 42%
Children
Housing Stock Social Circle Walton County Newton County
% Single‐Family
86% 84% 85%
Detached
% of Housing Stock
16% 12% 11%
Built since 2010
Median Home Value $234,051 $244,499 $212,364
2010‐2019 New
0 0 56
Multifamily Permits
2010‐2019 New
103 3602 2855
Single‐Family Permits
Effective Rent per Unit n/a $924 $993
Avg Market‐Rate
n/a $0.85 $0.99
Apartment Rent per sq. ft.
Source: KB Advisory Group based on data from Claritas, CoStar, SmartRE Data, HUD
Housing Market Analysis + Policy Recommendations 40Public Input
Housing Market Analysis + Policy Recommendations 41public input
Following a March 8, 2021 meeting between KB Advisory The survey comprised 14 multiple-choice questions and a
Group and the City of Social Circle, a survey was free-response questionnaire.
administered to community residents.
J The multiple-choice section gathered demographic data,
J The purpose was to gauge public opinion about different local housing market preferences, and feedback on
facets of Social Circle’s housing market. A total of 104 Historic District protection measures.
surveys were collected.
J The free-response section allowed survey-takers to voice
their opinions about “priorities, possibilities, and pitfalls.”
Do you support home improvement grants to Do you support programs to assist renters to
qualifying homeowners? become homeowners?
Not Sure Not Sure
No
No
Yes
Yes
0 10 20 30 40 50 60 70
Survey Responses
0 10 20 30 40 50 60
Housing Market Analysis + Policy Recommendations 42public input
Demographics:
Value of Respondent's Home
J 99% of survey responders live in the City of Social Circle. 50
J The distribution of survey responses was uniform across 40
the spectrum of responders’ home values, reducing the 40
likelihood of response bias.
Responses
30 26
J The uniform distribution is strikingly different from the
unimodal distribution for answers to “what value of 18
20
housing do you think is needed in Social Circle?
10
• According to the survey, most Social Circle
residents think homes valued between $200k and 0
$250k are most necessary. < 199k 200k-299k 300k +
What value of housing do you think is needed in Social Circle?
50
40
40
Responses
30
20
14
11
10
0
< 199k 200-299k 300k +
Housing Market Analysis + Policy Recommendations 43public input
Demographics:
Household Size
J 55% of survey responders lived alone or with one other
50
person. According to our data, 55% of Social Circle
residents live in small (1 or 2person) households. In this 40
Responses
nature, the survey is representative of reality. 30
20
J Most survey respondents do not live with children, which
is also the case with the actual population of Social 10
Circle. 0
1 2 3 4 5 6 7+
Across the metro Atlanta region, households are
Members in Household
J
shrinking in size (in terms of members.) Prospective
homebuyers are searching for smaller homes at
affordable price points. New housing construction must
meet this demand to promote healthy growth.
School Aged Children in Household
80
60
Responses
40
20
0
0 1 2 3
Children
Housing Market Analysis + Policy Recommendations 44public input
Most residents believe that the housing supply in Social
How would you characterize housing
J
Circle is either “adequate” or “short.” Few residents
believe it to be “excessive.” supply in Social Circle?
J The skew of these results illustrates healthy demand for Don't Know
housing in the City of Social Circle.
Excessive
Most residents think Social Circle needs more
Adequate
J
single-family detached homes, as opposed to
apartments or townhomes. Short
0 10 20 30 40 50
Responses
Which of these common housing types do
you think Social Circle needs more of?
Townhouse (rent or own)
Townhouse (if owned)
Apartments
Single family detached
0 10 20 30 40 50 60 70
Responses
Housing Market Analysis + Policy Recommendations 45public input
J The majority of survey respondents support Historic District restrictions.
J 20% of people believe certain excessive restrictions exist.
Do you support Historic District Are there certain Historic District Are there additional Historic District
restrictions to protect the character restrictions or protections that you restrictions or protections that you
of the historic district? think are excessive? would recommend?
Yes No Maybe Yes No Maybe Yes No Maybe
87% 9% 4% 25% 67% 8% 12% 78% 10%
Do you support Historic District restrictions Are there certain Historic District Are there additional Historic District
to protect the character of the Historic restrictions that you think are excessive? restrictions or protections that you would
District? recommend?
Yes No Maybe
Yes No Maybe Yes No Maybe
Housing Market Analysis + Policy Recommendations 46public input
The survey asked Social Circle residents to list priorities, possibilities, and pitfalls for Social Circle’s growth related to housing. The
following table lists common responses:
• Build homes • Wide variety • Development
Possibilities
Pitfalls
Priorities
to develop a of affordable at the cost of
tax base. housing types. historic
character.
• Revitalize • Upscale
downtown. growth model. • Rentals with
no tax base.
• Maintain • “Bedroom”
small-town, community for • “What if we
historic feel. larger cities. build, but they
don’t come?”
Housing Market Analysis + Policy Recommendations 47Appendix
Housing Market Analysis + Policy Recommendations 48appendix
Planning Commission Session Presentation: March 8, 2021
Housing Market Analysis 49appendix
Planning Commission Session Presentation: March 8, 2021
Housing Market Analysis 50appendix
Planning Commission Session Presentation: March 8, 2021
Housing Market Analysis 51appendix
Planning Commission Session Presentation: March 8, 2021
Housing Market Analysis 52appendix
Planning Commission Session Presentation: March 8, 2021
Housing Market Analysis 53appendix
Planning Commission Session Presentation: March 8, 2021
Housing Market Analysis 54appendix
Planning Commission Session Presentation: March 8, 2021
Housing Market Analysis 55appendix
Planning Commission Session Presentation: April 19, 2021
Housing Market Analysis 56appendix
Planning Commission Session Presentation: April 19, 2021
Housing Market Analysis 57appendix
Planning Commission Session Presentation: April 19, 2021
Housing Market Analysis 58appendix
Planning Commission Session Presentation: April 19, 2021
Housing Market Analysis 59appendix
Planning Commission Session Presentation: April 19, 2021
Housing Market Analysis 60appendix
Planning Commission Session Presentation: April 19, 2021
Housing Market Analysis 61appendix
Planning Commission Session Presentation: April 19, 2021
Housing Market Analysis 62appendix
Planning Commission Session Presentation: May 10, 2021
Housing Market Analysis 63appendix
Planning Commission Session Presentation: May 10, 2021
Housing Market Analysis 64appendix
Planning Commission Session Presentation: May 10, 2021
Housing Market Analysis 65appendix
Planning Commission Session Presentation: May 10, 2021
Housing Market Analysis 66appendix
Planning Commission Session Presentation: May 10, 2021
Housing Market Analysis 67TERMS and LIMITING CONDITIONS
Accuracy of Report: Every reasonable effort has been made to ensure that the data developed in this
assignment reflect the most accurate and timely information possible and is believed to be reliable. This
consulting assignment was based on estimates, assumptions, and other information developed by KB Advisory
Group (“KBA”) from its independent research efforts, general industry knowledge, and consultations with
the client for this assignment and its representatives. No responsibility is assumed for inaccuracies in reporting
by the client, its agents or representatives, or any other data source used in preparing or presenting this study.
The research and reports are based on information that is current as of the date of the report. KBA assumes
no responsibility to update the information after the date of the report. The research may contain prospective
financial information, estimates, or opinions that represent our view of reasonable expectations at a particular
point in time, but such information, estimates, or opinions are not offered as predictions or assurances that a
particular outcome will occur. Actual results achieved during the period covered by our prospective analysis
may vary from those described in our research and report, and variations may be material. Therefore, nor
warranty or representation is made by KBA that any of the projected values or results contained in the work
product from this assignment will actually be achieved.
Usage of Report: The research product may not be used, in whole or in part, in any public or private offering
of securities or other similar purposes by the client without first obtaining the prior written consent of KBA.
www.kbagroup.com
404.845.3550You can also read