Direct and Indirect Effects of COVID-19 Pandemic on Implied Stock Market Volatility: Evidence from Panel Data Analysis
←
→
Page content transcription
If your browser does not render page correctly, please read the page content below
Munich Personal RePEc Archive

Direct and Indirect Effects of COVID-19
Pandemic on Implied Stock Market
Volatility: Evidence from Panel Data
Analysis

Papadamou, Stephanos and Fassas, Athanasios and
Kenourgios, Dimitris and Dimitriou, Dimitrios

University of Thessaly, University of Athens

2 May 2020

Online at https://mpra.ub.uni-muenchen.de/100020/
MPRA Paper No. 100020, posted 04 May 2020 11:30 UTC
Direct and Indirect Effects of COVID-19 Pandemic on Implied
 Stock Market Volatility: Evidence from Panel Data Analysis

 Stephanos Papadamou*
 Department of Economics, Laboratory of Economic Policy and Strategic Planning,
 University of Thessaly, Greece

 Athanasios P. Fassas
 Department of Accounting and Finance, University of Thessaly, Greece

 Dimitris Kenourgios
 Department of Economics, UoA Center for Financial Studies, National and
 Kapodistrian University of Athens, Greece

 Dimitris Dimitriou
 Department of Economics, UoA Center for Financial Studies, National and
 Kapodistrian University of Athens, Greece

Abstract

We investigate the effects of a google trend synthetic index concerning corona virus,
as a composite indicator of searching term and theme, on the implied volatility of
thirteen major stock markets, covering Europe, Asia, USA and Australia regions by
using panel data analysis along with several model specifications and robustness tests.
Increased search queries for COVID-19 not only have a direct effect on implied
volatility, but also have an indirect effect via stock returns highlighting a risk-aversion
channel operating over pandemic conditions. We show that these direct and indirect
effects are stronger in Europe relative to the rest of the world. Moreover, in a PVAR
framework, a positive shock on stock returns may calm down google searching about
COVID-19 in Europe. Our findings suggest that google based anxiety about COVID-
19 contagion effects leads to elevated risk-aversion in stock markets. Understanding
the links between investors’ decision over a pandemic crisis and asset prices
variability is critical for understanding the policy measures needed in markets and
economies.
JEL codes: C33; D83; G12; G14

Keywords: COVID-19 pandemic; google trends; implied volatility; stock returns;
panel data

* Correspondence author. Address: 78, 28th October Str., Volos 38333, Greece. E-mail:
stpapada@uth.gr

 1
1. Introduction

The coronavirus disease 2019 (COVID-19) is the first global deadly pandemic after
more than a century (the last one was the 1918 flu pandemic, also known as the
Spanish flu). The first known outbreak of COVID-19 was around the end of 2019 in
China and in less than three months, it spread across the globe, causing a huge number
of infections and deaths over more than 200 countries. The future economic impact of
this pandemic is still highly uncertain and thus, in this setting, it would be interesting
to investigate the incorporation of information related to coronavirus into equity
indices performance, as measured by return and volatility.

 This paper investigates the link between the dynamics of implied volatility
indices in thirteen countries across the globe and investor attention as measured by
Google search probability in the era of Covid-19. Scholars are coming to recognize
the predictive value of data collected across various digital platforms, with search
behavior data being an extremely abundant repository of predictive data. Google
search query data are increasingly being used in the literature across several
disciplines for measuring variables and phenomena ranging from the spread of flu
(Ginsberg et al., 2009; Polgreen et al., 2008) and election outcomes (Metaxas and
Mustafaraj, 2012), through tourist numbers (Choi & Varian, 2012) to consumer
behavior (Carrière-Swallow and Labbé, 2013) and economic statistics and key
economic figures (Choi and Varian, 2012). In finance, search queries provided by
Google have proved to be a useful source of information for studying domestic bias in
international equity holdings (Mondria et al., 2010), earnings announcements (Drake
et al., 2012), trading strategies (Preis et al., 2013), traded volume (Preis et al., 2010)
and portfolio diversification (Kristoufek, 2013).

 Based on the assumption that information is instantaneously incorporated into
prices when it arrives, Da et al. (2011) are the first to propose a new and direct
measure of investor attention using search frequency in Google. Since then, an
emerging literature documented the impact of investors' attention on asset market
microstructure and asset prices and volatility (Joseph et al., 2011; Vlastakis and
Markellos, 2012; Smith, 2012; Vozlyublennaia, 2014; Ding and Hou, 2015; Dimpfl
and Jank, 2016; Goddard et al., 2015; Chronopoulos et al., 2018). However, there is
no relevant study that directly studies investors’ attention in a period of crisis. Our
paper is motivated by the papers of Andrei and Hasler (2015), who develop a

 2
theoretical model that shows how investors’ attention affects the dynamics of asset
returns, and Da et al. (2015), who find that internet search volume for relevant terms
such as “recession” and “unemployment” is contemporaneously related to the S&P
500 VIX. Against this background, the current study extends this literature, by
measuring investor attention to the coronavirus pandemic, following a similar
approach to Da et al. (2011), and analyzing the relation between the Internet search
activity and implied volatility in a period of extraordinary stress and uncertainty. In
particular, we form four main research questions to be answered: (1) Does investors’
attention as proxied by Google’s search volume index add information to stock
market implied volatility? (2) Does investors’ attention as proxied by Google’s search
volume index significantly affects equity indices returns? (3) Do the dynamics of the
relationship between stock index returns and changes in volatility change in times of
crisis? (4) Do investors demand more information during periods of pandemic
shocks? In this set up, we construct a synthetic index based on “corona virus” term
and “corona virus” theme as a direct proxy for investors' attention, and use a sample
of equity and implied volatility indices of thirteen countries around the world.

 The current study also contributes to two additional strands of literature. First,
we add to the several studies (see Kollias et al. 2013 and Liu et al., 2019 for a relevant
discussion) that examine how markets and market agents react to exogenous events,
such as natural disasters, social unrest, political upheavals and violent events; search
queries data extends existing attempts, as it measures the public’s attention to
unexpected catastrophic events and gives timely feedback on investment dynamics
(Liu et al., 2019). Second, we also contribute to the contemporaneous, but
exponentially growing, literature on the effects of COVID-19 on economic activity
(Baldwin and Weder di Mauro, 2020; Duan et al., 2020; Atkeson, 2020; Eichenbaum
et al., 2020), on economic sentiment (Baker et al., 2020a,b) and on financial markets
(Alfaro et al. 2020; Corbet et al.,, 2020(a); Corbet et al. 2020(b); Ramelli and Wagner,
2020; Zhang et al., 2020; Gormsen and Koijen, 2020).

 Our main findings are summarized as follows: first, we identify short-run
causality from Google search queries data to implied volatility dynamics. Second,
there is a negative short-run effect of Google searches to equity indices returns. Third,
there is evidence that the persistence (leverage effect) in the VIX becomes stronger as
Google search queries intensify. Fourth, Google carries different short-run predictive

 3
information in Europe relative to the rest of the world. Finally, we show that a
positive shock on stock returns may calm down google searching about COVID-19 in
Europe. The rest of the paper is organized as follows. Section 2 presents the literature
review and the hypotheses to be tested. Section 3 presents the data sample and a
preliminary analysis, while the description of the methodology is presented in Section
4. The empirical results and a robustness analysis are presented and discussed in
Section 5. Section 6 reports the summary and concluding remarks.

2. Background and hypotheses

2.1 Literature Review

Our paper attempts to contribute to the recent path of literature that studies the effects
of investors’ attention, as proxied by Google search volume, on financial assets. A
literature studying the impact of investor attention on the dynamics of asset prices
(see, e.g., Baker and Wurgler, 2007 and Bekaert et al., 2019 for a review) has
emerged during the last two decades. One important channel through which investors
express their demand for information is through internet searches (Drake et al., 2012).
The appeal of search-based sentiment measures is more transparent when compared
with alternatives (see Da et al., 2015 for a discussion).

 Da et al. (2011) was the first study to treat Google Search as a direct measure
of investor attention; their empirical findings show that an increase in search volume
for Russell 3000 stocks predicts higher stock prices in the next two weeks.
Subsequently, several papers studying the connection between investor attention, as
measured by search queries, and market returns and volatility have emerged over the
recent years. Indicatively, studies documenting this link includes Joseph et al. (2011),
Drake et al. (2012), Vlastakis and Markellos (2012), Irresberger et al. (2015), Bijl et
al. (2016), Dimpfl and Kleiman (2019), Chen and Lo (2019) and Kim et al. (2019) for
individual stocks, Dzielinski (2012), Vozlyublennaia (2014), Hamid and Heiden
(2015), Da et al. (2015), Chronopoulos et al. (2018), Dimpfl and Jank (2016) and
Graham et al. (2019) for stock indices, Goddard et al. (2015) and Smith (2012) for
exchange rates, Vozlyublennaia (2014) and Dergiades et al. (2015) for bonds,
Vozlyublennaia (2014) and Afkhami et al. (2017) for commodities, Da et al. (2015)
for ETFs, Yung and Nafar (2017) for REITs and Philippas et al. (2019) for Bitcoin.

 4
Extensive research has documented the effect of investors' attention on asset
prices and volatility, but only a very limited number of studies have investigated the
link of investors’ attention to implied volatility, one of the most popular market-based
measures of investor sentiment (Whaley, 2000). In particular, Vlastakis and Markellos
(2012), Da et al. (2015) and Ruan and Zhang (2016) show that investors’ attention is
significantly positively related to implied volatility, while Nikkinen and Peltomäki
(2020) show that the effects of information demand on realized stock returns and the
VIX index are instantaneous.

2.2 Testable Hypotheses

We test four hypotheses to analyze the relationships between investors’ attention, as
proxied by Google search queries, and market aggregate risk-return dynamics.
Empirical research in finance has long been investigating the link between volatility
and the rate at which information flows into financial markets (see Kalev et al., 2004
and Da et al., 2011 for a review of the relevant literature), as one of the most intuitive
explanations for commonly-observed volatility patterns is that volatility is
proportional to the rate of information arrival (Smith, 2012). As a result, the first
hypothesis is as follows:

H1. Investors’ attention as proxied by Google’s search volume index adds
information to a market-based measure of volatility.

Our second hypothesis stems from the attention-induced price pressure hypothesis of
Barber and Odean (2008) and claims the following:

H2. Investors’ attention as proxied by Google’s search volume index has a significant
effect on equity indices returns.

The third hypothesis relates to one of the most noticeable stylised facts in finance; the
negative correlation of stock index returns with changes in volatility (French et al.,
1987). Our scope is to investigate whether, in times of the pandemic crisis, the
dynamics of this relationship are altered. Thus, the third testable hypothesis is formed
as follows:

H3. The volatility feedback hypothesis becomes stronger (weaker) in periods of
anxiety.

 5
Finally, relatively scant empirical evidence (Vozlyublennaia, 2014; Vlastakis and
Markellos, 2012; Goddard et al., 2015; Andrei and Hasler, 2015) shows that investors
demand more information as a shock to index returns occurs and as the level of risk
aversion increases. Given these findings, the forth hypothesis is as follows:

H4. Stock market anxiety and shocks results in an increase of investors’ attention.

3. Data and preliminary analysis

The development of COVID-19 in late 2019 on China and the contagion on other
Asian, European countries, USA and Australia over the beginning of 2020 lead us to
focus on a sample period from 02 January 2020 to 09 April 2020. Google trends
metrics provide useful information concerning the attention of the crowd on epidemy
of COVID-2019 over this period. The metrics achieve the highest 100 hundred level
on the day of this period where attention is highest and the rest days are presented
reference to that. Following this methodology, we decided to construct a synthetic
index based on “corona virus” term and “corona virus” theme. The former is a
specific search term while the latter refers to a general term concerning heath
consequences of a severe heath decease. By constructing this synthetic indicator, we
may highlight any time variation from the early beginning of 2020 and over the first
four months. The end of sample period coexists with the closing of the stock markets
for Easter holidays in USA and most European countries. Our thirteen sample
countries selection is based on the availability of an implied volatility index and the
existence of coronavirus victims. Therefore, we use data on general stock market
indices and implied volatility indices for Germany (DEU), France (FR), Italy (IT),
Netherland (NL), United Kingdom (UK), Switzerland (CH), Russia (RUS), China
(CHN), India (IND), Japan (JPN), Korea (KOR), United States of America (USA) and
Australia (AUS).

 Figures 1a,b, 2, 3 include the graphical depiction of the three variables of
interest, Google Trend Metric, Implied Volatility, and Stock Prices, for each country
on a vertical manner. By looking on European countries in Figures 1a,b, the beginning
of search concerning COVID-19 can be placed in the middle of January (specifically
the indicator takes off on day 20/01/2020). However, this is also true for all countries

 6
in the sample (see Figures 2 & 3). By looking these figures, the first wave of increase
in google trend indicator concerning COVID-19 coexist with a small increase on
implied volatility and a short decline to stock prices (this effect seems to be clearer in
China and Korea relevant to the rest countries). Over the second wave of increase in
google trend indicator beginning on 19/2/2020, the drop on stock prices and the
increase of implied volatility are common and unified across all countries and regions.

 Given that Figures 1a,b, 2, 3 leave no doubts of non-stationary series, we
proceed on first logarithmic changes1 in order to investigate stationarity via panel unit
root tests. Therefore, the first step of our empirical investigation involves a number of
panel unit root tests applied on these changes (VIX_changes, GTR_changes,
Stock_changes). The results (included in Table 1) indicate strong evidence against
non-stationarity for the changes of all series under review. Here on, our focus will be
on changes more than level data.

 Assumed the well-known negative relationship between stock market returns
and stock market implied volatility in finance (Whaley, 2000), we come to assess
firstly any direct impact of Google Trend metric concerning COVID-19 on stock
market implied volatility, and secondly any indirect effect working via this well-
known relationship. More specifically, we expect that uncertainty concerning a spread
of a pandemic with dangerous health results adds on future stock market volatility
measured by the implied volatility measure, but also may strengthen in absolute terms
the relationship between stock market returns and implied volatility changes. A
significant drop on stock market may increase implied volatility more in a contagion
environment of a pandemic.

 In order to have a preliminary picture of the relationship pattern between VIX
and stock market indices, we apply the dynamic conditional correlation approach
(DCC) of Engle (2002). DCC is a parsimonious estimation technique of a dynamic
correlation between two series and provides useful information on their correlation

1
 For the google trends indicator, we construct and indicator equals to log(e + Google Trend Metric
value) similarly to Eckstein & Tsiddon (2004) followed on terrorism attacks. Then, we take first
logarithmic differences on this indicator as we do with implied stock market volatility indices and stock
prices indices.

 7
fluctuations over time. The level of DCC correlations between VIX and stock market
returns over the period 02/01/2020 through 09/04/2020 is shown in Figure 4.

 At all points, the degree of correlation between the series is found to be low,
with magnitude less than -0.2 in most cases. However, it is worth highlighting the
change of correlation near and after the milestone dates of January 20, 2020 and
February 19, 2020. The level of correlation fluctuates considerable during these
periods, supporting changes in investors’ appetite for risk. This change is asymmetric
and depends heavily to the market under examination. However, while DCC provides
information on the correlation characteristics of our series over time, it sheds no light
on the causal effects among series. This supports the use of panel data techniques for
examining the series behavior in more depth, by including more explanatory
variables.

4. Methodology

The short-time period covered of the COVID-19 leads us to study thirteen countries
with daily data for almost three and half months in a panel data framework. Panel data
estimation allows us to control for individual heterogeneity and reduces estimation
bias (Wooldridge, 2002).

 Firstly, following previous literature indicating the strong relationship between
volatility and return (Fleming et al., 1995; Bekaert and Wu, 2000; Bollerslev et al.,
2006; Hibbert et al., 2008; Fernandes et al., 2014), we formulate a model that
incorporates any possible GTR effects on volatility changes as shown below:

 ℎ = 0 + 1 ℎ + 2 ℎ
 , , , −1

 + 3 ℎ + 4 ( ℎ × ℎ )
 , , ,

 + 5 ( ℎ × ℎ ) + + + , (1)
 , , −1

where, ℎ , measures the rate of change on stock market implied volatility (i

corresponds to each country of the sample and t on each day of the sample) and
 ℎ , refers to stock market price daily changes for each cross section i,

 8
while the rate of change on google trend measurement about COVID-19 is measured
for each country i over day t by the ℎ , and can also be treated as an

independent variable. As can be seen in our model, given that we don’t know whether
Google trend variable affects contemporaneous or in a time lag the changes on VIX,
we estimate a wider model allowing for time dynamic direct and indirect effects.

 Under this specification, the 1 , 2 coefficients capture any direct effects of
the uncertainty concerning COVID-19 epidemic on risk taking at stock markets, as
proxied by implied volatility. If anxiety about the future possible negative social
and/or economic effects of the pandemic does directly discourage risk-taking, we
expect the 1 / 2 coefficient to be positive and statistically significant.
However, in our model we can also quantify any indirect effect working via the well-
known negative relationship (we expect 3 ≤ 0, and statistically significant) between
stock returns and implied volatility changes. More specifically, we expect that a cross-
term of stock returns with the Google Trend metric may increase in absolute terms
this negative relationship (we expect 4 ≤ 0 or 5 ≤ 0, and statistically significant).

 The parameter a 0 represents the overall constant in the model, while the μi and

 represent respectively the cross section and time specific effects (random or fixed).
The , are the error terms for i=1, 2, …, 13 cross-sectional units, observed for t=1, 2,
…,T daily periods. This model can help us investigating any significant
contemporaneous and/or dynamic relationship between the variables of interest.
Furthermore, since the futures market data essentially captures all relevant
information regarding the stock market under review, we can quantity the response of
investor sentiment to an epidemic anxiety shocks more effectively.

 Secondly, in order to investigate any causality between implied stock market
volatility changes, stock market returns and Google Trends changes, we proceed to
the estimation of a panel VAR model including ℎ ,
 ℎ ℎ as endogenous variables, using the GMM estimator of
Abrigo and Love (2016). Impulse response analysis and variance decomposition may
highlight any significant causal effects and any time delayed response of variables of
interest. Therefore, our general first order PVAR model is defined as follows:

 , = 0 + 1 −1 + + , (2)

 9
in which, , is a three-variable vector { ℎ , ℎ , ℎ }.
This panel VAR models allows for “individual heterogeneity” in the levels of the
variables by introducing fixed effects, denoted by in Equation (2).

5. Empirical Results

Table 2 presents the estimation results for the pooled, fixed and random effects
models regarding Equation (1). In the upper part of column (1) the independent
variables of the models are presented, while in the lower part some diagnostics and
specification tests are also provided. In column (2) the expected signs of the
coefficients of interest are given. We follow a top-down econometric approach,
beginning with a wide model including all variables of the model presented in
equation (1), and finally keeping only the statistically significant ones (the results of
this reduced model are presented in Table 2).

 In terms of estimation methods, we begin with the pooled estimation and by
conducting a fixed versus pooled estimation F-test, we proceed with the one that is
suggested by the test. We conduct a cross section and a period F-test in order to select
the most suitable model. Moreover, the Hausman test helps us in order to select
between Fixed and Random Effects models, by giving a small lead to the latter.
However, for reason of consistency and robustness we present the results of all types
of estimation methods. We have to mention at this point that the results of the Frees
test for cross-sectional correlation in fixed effect and modified Wald test for group-
wise heteroskedasticity leads us to use panel corrected standard errors in all of our
estimations (PCSE).2

 By looking at the columns of Pooled, Fixed and Random Effects models, we
can conclude that: (a) stock returns increases coexist with reductions on implied
volatility changes; (b) the direct effect of Google trend on COVID-19 pandemic is
positive, contemporaneous only, and statistically significant at the 1% and 5% level of
significance; and (c) the indirect effect is dynamic and significant also. More
specifically, based on our findings, an increase in Google Trend about COVID-19

2
 According to Beck and Katz (1995), the existence of cross-panel correlations, if not corrected, will
result to inefficient estimates even if heteroskedasticity is controlled for.

 10
pandemic over the previous day can strengthen the negative relationship of stock returns on the returns of implied volatility of the stock index. However, this is not happening contemporaneously. Our three main findings are robust across the estimation methods applied on the reduced model that keeps only the statistically significant variables presented in Table 2. The constant term in all cases is positive and statistically significant, reflecting an average daily VIX change. The R-squared across all estimations varies between 34.5% and 56.3%, with the highest value on the model without cross section (or country) effects, but with time effects. In the next step, given the values of the Durbin-Watson tests and allowing the residuals to follow an autoregressive one process, we proceed to the estimation of the reduced model with the Pooled OLS3 / Fixed Effects with PCSE and an AR(1) term common across all cross sections. The results of these estimations are presented in the right last two columns of table 2. In terms of magnitude of the three coefficients of interest, all are higher in absolute terms in both two cases of estimation, without reducing statistical significance. The negative statistically significant value of the coefficient of the autoregressive term implies a mean reversion process on VIX changes across all stock markets in those thirteen countries studied. We continue our empirical analysis by investigating whether there is any feedback effect across the three variables of interest in a PVAR framework. The impulse response analysis can highlight the magnitude of the effect during the time and, most important, the direction of the effect across the three variables. Following recent behavioral finance developments (see Baker and Wurgler, 2007 for a discussion), market reactions are reflected on price changes or VIX changes given that discount future events may calm down crowd in searching over internet media or the completely opposite by adding more anxiety. The GMM estimation in a PVAR framework allow us to treat any bi- directional relationship between return and volatility in the stock market across all 13 countries, but also any bi-directional or uni-directional relationship between Google Trend metrics about COVID-19 epidemic and the other two stock market variables. 3 In the case of heteroskedastic and contemporaneously correlated across panels disturbances, the combination of OLS with panel-corrected standard errors (PCSEs) leads to an accurate estimation compared to the feasible generalized least squares (GLS) method (Beck and Katz, 1995). 11
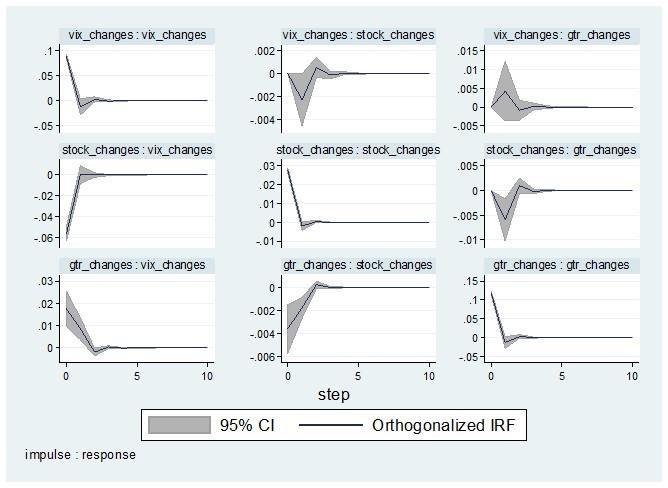
Impulse response analysis in Figure 5 highlights clearly the direction of these
interdependencies.

As expected, a positive shock on stock market returns reduces significantly implied
volatility in the relevant market by reaching its bottom immediately and dies off after
almost two days. However, a bi-directional relationship between these two variables
seems to be present in some degree, since the response of stock returns to a positive
implied volatility shock is negative, reaching its bottom after one day and
disappearing after two days.

 By focusing on the last row of diagrams in Figure 5, we observe that a positive
shock on Google search for COVID-19 pandemic has an immediate statistically
significant positive effect on stock market implied volatility and a clear negative
effect on stock returns. In both cases, this effect diminishes after two days. By looking
at diagrams in the diagonal, VIX changes and GTR changes present a quite similar
pattern as long as their autoregressive part are considered in contrast to stock changes.

 By looking at the response of Google trend changes about COVID-19
pandemic to a positive shock on stock changes and vix changes respectively, we can
highlight the following two points. On the one hand, a positive shock of stock returns
reduces significantly the rate of searching about COVID-19 pandemic. The leading
indicator role of stock market about future economic activity and possible
consequences of a pandemic on the economy leads to calm down searching implying
or discounting low consequences from this pandemic. On the other hand, a positive
shock on implied stock market volatility seems to increase searching for COVID-19
pandemic and its consequences. However, as can be seen by the confidence bands,
there is no statistically significant relationship in this case.

 Table 3 report the results from the variance decomposition analysis for our
basic PVAR model. The first column of Table 3 presents the response variable and its
forecast horizon. As can be seen, Google trend search variability for COVID-19 is
mainly explained by itself. However, the total effect accumulated over 3 days reported
for stock changes variability and Vix changes variability by Google Trend changes
concerning COVID-19 epidemic indicate the followings: (a) The Google Trend metric
changes variability explains 2% of stock prices changes and 3.3% of Vix changes; (b)

 12
The percentage of stock prices variability explained by the Google trend COVID-19
metric (2.08% after 3 periods) is higher than those explained by the Vix changes
(0.71%), highlighting the importance of variability induced by an epidemic contagion
versus implied stock market volatility on stock returns. Worth mentioning at this point
the important percentage of vix changes variability explained by the stock returns
after a three-period time (27.66%). Together social attention on COVID-19 epidemic
and stock returns explain 30% of VIX changes variability.

5.1 Robustness check

By experimenting with different groups of stock markets, we investigate the
robustness of our central findings. In particular, we re-estimate Equation (1) in its
reduced form as appeared in Table 2 by decomposing the effect of each coefficient
(concerning direct and indirect effects of Google Trend metric about COVID-19 on
Vix changes) on two groups: The European versus non-European markets and the
Asian versus non-Asian markets.4

 A particular dummy ( ) is constructed, taking the value of one if market k
belongs to j group (j takes value European or Asian markets) and zero otherwise.
Similarly, the dummy (1 − ) is constructed, taking the value of one if market k
does not belong to j group (i.e. non-European or non-Asian markets) and zero
otherwise. Therefore, model 2 (the reduced model) is re-estimated as follows:

 ℎ = 0 + 1 [( ) × ℎ ] + 1 [(1 − ) × ℎ ]
 , , ,

 + 2 ℎ + 3 [( ) × ( ℎ × ℎ )]
 , , , −1

 + 3 [(1 − ) × ( ℎ × ℎ )] + + + , (3)
 , , −1

 Our attention is given on the comparison between 1 and 1 referring to
“direct effects of GTR changes on Vix” and 2 and 2 referring to “indirect effects of
GTR changes on Vix”, between j group versus rest markets each time.

4
 Given that the cases of Australia and USA construct a group with smaller observations, we decided to
focus on the European/non-European, Asian/non-Asian markets. However, comparisons of the findings
among the two groups have direct implications for the other two countries.

 13
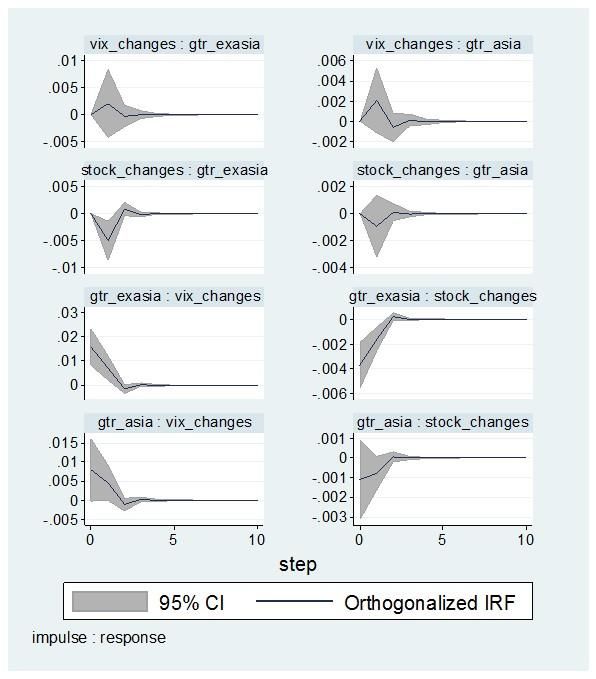
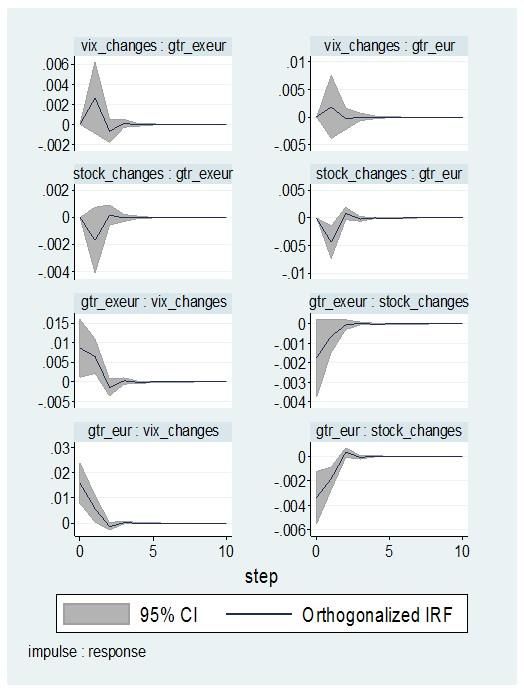
Table 4 presents the results in line to Table 2. The only difference is that for
each estimation method we present two different columns; one for the estimation of
European markets versus non-European markets and another for the estimation of
Asian versus non-Asian markets. Therefore, index j takes values EUR for European
markets or Asia for Asian markets each time. Let’s, firstly, focus on European versus
non-European markets results. The direct effect of GTR changes on VIX changes is
higher in magnitude for European markets versus non-European markets ( 1 > 1 ). In
Asian markets, the direct effect is smaller in magnitude compared to the rest markets.
Additionally, when comparing the direct effect on Asian markets versus the direct
effect on non-European markets, it can be implied that USA and Australia markets
contributes positively relative to Asian markets. These main findings remain the same
in the case that an AR(1) term is estimated, but the magnitude of the direct effect is in
general increased.

 Stock return is statistically significant and negatively related to VIX changes
in all cases, but the magnitude of the coefficient is higher in absolute terms in Asian
markets and then follows European markets. When looking on the indirect effect of
Google trend searching for COVID-19 on this stock return VIX relationship, we can
argue that this COIVD-19 searching when increasing strengthen this relationship in
absolute terms. More specifically, this indirect effect of GTR changes on VIX via
stock return channel is present and statistically significant in European and Asian
markets only. Again, when looking at the magnitude of the coefficients, the European
case presents the higher values.

 Furthermore, in order to examine the results across different groups of stock
markets using the PVAR model, we follow the same methodology of decomposing
the effect of google trend searching on COVID-19 pandemic in European versus non-
European markets and in Asian versus non-Asian markets. Impulse response analysis
(see Figures 6 & 7) and variance decomposition (see Tables 5 & 6) confirm our
previous findings that the effects are stronger for European markets versus the rest
markets. Stock market returns respond negatively to an increase in searching about
COVID-19 with higher statistical significance in case of European versus the rest
markets. Worth also mentioning, the negative response of google trend searching for
COVID-19 due to a positive stock market return shock is mainly attributed to

 14
European markets. This implies a bi-directional relationship between stock market
investing and searching about consequences of a pandemic.

 Tables 5 and 6 report the results from the variance decomposition analysis for
our two versions of the PVAR model. One for a PVAR that compares European
versus non-European markets effects and the other one that compares Asian versus
non-Asian markets effects. The results on these tables also confirm the relative
importance of google trend searching for a pandemic both on European stock market
returns and implied volatilities relative to the rest markets. For example, by looking
on 3 days forecast horizon, the google trend metric about COVID-19 pandemic
explains 2.49% of VIX variability in European markets relative to 1.05% to non-
European markets. By comparing the value of 2.49% in Table 5 with the value of
2.67% in Table 6 referring to google trend metric explanation of the VIX in non-
Asian countries, we observe the value added due to the US and Australian
contribution.

 Finally, in order to investigate further the robustness of our main findings
concerning the indirect effect of the investors’ attention about COVID-19 on stock
returns and implied volatility changes, we proceed to the estimation of the dynamic
correlations in each country from a GARCH(1,1)-DCC model. Then, we estimate any
positive relationship between absolute values of these correlations with our metric
about COVID-19 attention. The estimates presented in Table 7 show that an increase
in COVID-19 increase in absolute terms the correlation between stock returns and
implied volatility changes for all groups of countries, confirming our previous
findings. The fixed effect model is preferable versus the pooled model. Moreover, the
Hausman test support the fixed effect versus the Random effects model.

6. Conclusion

 The debate regarding the effects of investors' attention (Vlastakis and
Markellos, 2012; Da et al., 2015) on implied stock market volatility dynamics has led

 15
to a growing recent body of literature, but the respective empirical results of a
pandemic contagion across different markets with different cultures are inconclusive
and not until now explored. Direct effects of increased uncertainty due to COVID-19
expansion may contribute to higher stock market volatility, but also indirect effects
via significant stock market drops may also be raised. While the relationship of stock
returns and implied stock market volatility is widely acknowledged (French et al.,
1987), less is known about how this relationship may be affected by a pandemic that
spreads all over the world with significant economic consequences due to human
infections and measures of quarantine, social distancing and economic disruption.

 Our empirical findings show that there is a causal positive direct relationship
between Google trend metrics for COVID-19 and stock market implied volatility. The
automated trading by the increased use of technology in all over the world can make
investors searching for trends in google metrics and contemporaneously make active
trading on markets via electronic platforms. By studying thirteen stock markets
expanding from Europe to Asia, Australia and USA, we found that this relationship is
more clearly presented in European markets relative to Asian markets. Our findings
also indicate that increase anxiety produced by the increased searching for
consequences concerning COVID-19 pandemic and its short- or long-lasting effects
on economies may strengthen the negative relationship between stock market returns
and their implied volatility, supporting the volatility feedback hypothesis.

 Our evidence supports the existence of a risk-aversion channel of pandemic
spread in the stock market, as well as the attention-induced price pressure hypothesis.
Therefore, our results compliment previous studies which show that implied
volatilities in the stock markets are affected by investor attention in a “google” or
“internet” based economy (Da et al., 2015). These findings highlight an investor
sentiment channel that is growing via behavioral biases during pandemic crisis
periods and provide useful insights to investors and policy makers. Understanding the
links between investors’ decision over a pandemic crisis and asset prices variability is
critical for designing and implementing the policy measures needed in markets and
economies. Finally, further research might help shedding light on the risk-taking
monetary policy transmission channel (Delis et al., 2017; Fassas & Papadamou, 2018)
and how may be affected by the expansion of a pandemic that affects investors’ risk
tolerance and perception measured by google trend metrics.

 16
References

Abrigo, M. R., & Love, I. (2016). Estimation of panel vector autoregression in
 Stata. The Stata Journal, 16(3), 778-804.
Afkhami, M., Cormack, L., & Ghoddusi, H. (2017). Google search keywords that best
 predict energy price volatility. Energy Economics, 67, 17-27.
Alfaro, L., Chari, A., Greenland, A. N., & Schott, P. K. (2020). Aggregate and firm-
 level stock returns during pandemics, in real time (No. w26950). National
 Bureau of Economic Research.
Andrei D., & Hasler, M. (2015). Investor Attention and Stock Market Volatility. The
 Review of Financial Studies, 28(1), 33-72
Atkeson, Andrew, 2020. What will be the economic impact of COVID-19 in the U.S.?
 Rough estimates of disease scenarios. NBER Working Paper, w26867.
Baker, S. R., Bloom, N., Davis, S. J., & Terry, S. J. (2020b). Covid-induced economic
 uncertainty (No. w26983). National Bureau of Economic Research.
Baker, S. R., Farrokhnia, R. A., Meyer, S., Pagel, M., & Yannelis, C. (2020a). How
 does household spending respond to an epidemic? consumption during the
 2020 covid-19 pandemic (No. w26949). National Bureau of Economic
 Research.
Baker, M., & Wurgler, J. (2007). Investor sentiment in the stock market. Journal of
 Economic Perspectives, 21(2), 129-152.
Baldwin, R. and B. Weder di Mauro (2020). Economics in the Time of COVID-19
 (CEPR Press VoxEU.org).
Barber, B.M., & T. Odean (2008). All that glitters: The effect of attention and news
 on the buying behavior of individual and institutional investors. Review of
 Financial Studies, 21(2), pp. 785-818
Bekaert, G., Engstrom, E. C., & Xu, N. R. (2019). The time variation in risk appetite
 and uncertainty (No. w25673). National Bureau of Economic Research.
Bekaert, G., & Wu, G. (2000). Asymmetric volatility and risk in equity
 markets. Review of Financial Studies, 13(1), 1-42.
Beck, N., & Katz, J. N. (1995). What to do (and not to do) with time-series cross-
 section data. American Political Science Review, 89(3), 634-647.
Bijl, L., Kringhaug, G., Molnár, P., & Sandvik, E. (2016). Google searches and stock
 returns. International Review of Financial Analysis, 45, 150-156

 17
Bollerslev, T., Litvinova, J., & Tauchen, G. (2006). Leverage and volatility feedback
 effects in high-frequency data. Journal of Financial Econometrics, 4(3), 353-
 384.
Carrière-Swallow, Y., & Labbé, F. (2013). Nowcasting with Google Trends in an
 emerging market. Journal of Forecasting, 32(4), 289-298.
Chen, H. Y., & Lo, T. C. (2019). Online search activities and investor attention on
 financial markets. Asia Pacific Management Review, 24(1), 21-26.
Choi, H., & Varian, H. (2012). Predicting the present with Google Trends. Economic
 Record, 88, 2-9.
Corbet, S., Hu, Y., Lucey, B. M., & Oxley, L. (2020a). Aye Corona! The Contagion
 Effects of Being Named Corona During the COVID-19 Pandemic. The
 Contagion Effects of Being Named Corona during the COVID-19 Pandemic
 (March 26, 2020).
Corbet, S., Larkin, C. J., & Lucey, B. M. (2020b). The Contagion Effects of the
 COVID-19 Pandemic: Evidence from Gold and Cryptocurrencies. Available at
 SSRN 3564443.
Chronopoulos, D. K., Papadimitriou, F. I., & Vlastakis, N. (2018). Information
 demand and stock return predictability. Journal of International Money and
 Finance, 80, 59-74.
Da, Z., Engelberg, J., & Gao, P. (2011). In search of attention. The Journal of
 Finance, 66(5), 1461-1499.
Da, Z., Engelberg, J., & Gao, P. (2015). The sum of all FEARS investor sentiment
 and asset prices. The Review of Financial Studies, 28(1), 1-32.
Delis, M. D., Hasan, I., & Mylonidis, N. (2017). The risk-taking channel of monetary
 policy in the US: Evidence from corporate loan data. Journal of Money, Credit
 and Banking, 49(1), 187-213.
Dergiades, T., Milas, C., & Panagiotidis, T. (2015). Tweets, Google trends, and
 sovereign spreads in the GIIPS. Oxford Economic Papers, 67(2), 406-432.
Dimpfl, T., & Jank, S. (2016). Can internet search queries help to predict stock market
 volatility? European Financial Management, 22(2), 171-192.
Dimpfl, T., & Kleiman, V. (2019). Investor pessimism and the German stock market:
 Exploring Google search queries. German Economic Review, 20(1), 1-28.
Ding, R., & Hou, W. (2015). Retail investor attention and stock liquidity. Journal of
 International Financial Markets, Institutions and Money, 37, 12-26.
 18
Drake, M. S., Roulstone, D. T., & Thornock, J. R. (2012). Investor information
 demand: Evidence from Google searches around earnings
 announcements. Journal of Accounting Research, 50(4), 1001-1040.
Duan, H., Wang, S., & Yang, C. (2020). Coronavirus: limit short-term economic
 damage. Nature, 578(7796), 515.
Dzielinski, Michal (2012). Measuring economic uncertainty and its impact on the
 stock market. Finance Research Letters, 9(3):167-175
Eckstein, Z., & Tsiddon, D. (2004). Macroeconomic consequences of terror: theory
 and the case of Israel. Journal of Monetary Economics, 51(5), 971-1002.
Eichenbaum, M. S., Rebelo, S., & Trabandt, M. (2020). The macroeconomics of
 epidemics (No. w26882). National Bureau of Economic Research.
Fassas, A. P., & Papadamou, S. (2018). Unconventional monetary policy
 announcements and risk aversion: evidence from the US and European equity
 markets. The European Journal of Finance, 24(18), 1885-1901.
Fleming, J., Ostdiek, B., & Whaley, R. E. (1995). Predicting stock market volatility:
 A new measure. Journal of Futures Markets, 15(3), 265-302.
Fernandes, M., Medeiros, M. C., & Scharth, M. (2014). Modeling and predicting the
 CBOE market volatility index. Journal of Banking & Finance, 40, 1-10.
French, K. R., Schwert, G., & Stambaugh, R. F. (1987). Expected Stock Returns and
 Volatility. Journal of Financial Economics, 19 (1), 3-29
Ginsberg, J., Mohebbi, M. H., Patel, R. S., Brammer, L., Smolinski, M. S., &
 Brilliant, L. (2009). Detecting influenza epidemics using search engine query
 data. Nature, 457(7232), 1012-1014.
Gormsen, N. J., & Koijen, R. S. (2020). Coronavirus: Impact on stock prices and
 growth expectations. University of Chicago, Becker Friedman Institute for
 Economics Working Paper (2020-22).
Goddard, J., Kita, A., & Wang, Q. (2015). Investor attention and FX market volatility.
 Journal of International Financial Markets, Institutions and Money, 38, 79-96.
Graham, M., Nikkinen, J., & Peltomäki, J. (2019). Web-Based Investor Fear Gauge
 and Stock Market Volatility: An Emerging Market Perspective. Journal of
 Emerging Market Finance, 0972652719877473.
Hamid, A., & Heiden, M. (2015). Forecasting volatility with empirical similarity and
 Google trends. Journal of Economic Behavior & Organization, 117, 62-81.

 19
Hibbert, A. M., Daigler, R. T., & Dupoyet, B. (2008). A behavioral explanation for
 the negative asymmetric return–volatility relation. Journal of Banking &
 Finance, 32(10), 2254-2266.
Irresberger, F., Mühlnickel, J., & Weiß, G. N. (2015). Explaining bank stock
 performance with crisis sentiment. Journal of Banking & Finance, 59, 311-
 329.
Joseph, K., Wintoki, M. B., & Zhang, Z. (2011). Forecasting abnormal stock returns
 and trading volume using investor sentiment: Evidence from online
 search. International Journal of Forecasting, 27(4), 1116-1127.
Kalev, P. S., Liu, W. M., Pham, P. K., & Jarnecic, E. (2004). Public information
 arrival and volatility of intraday stock returns. Journal of Banking &
 Finance, 28(6), 1441-1467.
Kim, N., Lučivjanská, K., Molnár, P., & Villa, R. (2019). Google searches and stock
 market activity: Evidence from Norway. Finance Research Letters, 28, 208-
 220.
Kollias, C., Papadamou, S., & Arvanitis, V. (2013). Does Terrorism Affect the Stock-
 Bond Covariance? Evidence from European Countries. Southern Economic
 Journal, 79(4), 832-848.
Kristoufek, L. (2013). Can Google Trends search queries contribute to risk
 diversification?. Scientific Reports, 3, 2713.
Liu, Y., Peng, G., Hu, L., Dong, J., & Zhang, Q. (2019). Using Google Trends and
 Baidu Index to analyze the impacts of disaster events on company stock
 prices. Industrial Management & Data Systems, 120(2), 350-365.
Metaxas, P. T., & Mustafaraj, E. (2012). Social media and the
 elections. Science, 338(6106), 472-473.
Mondria, J., Wu, T., & Zhang, Y. (2010). The determinants of international
 investment and attention allocation: Using internet search query data. Journal
 of International Economics, 82(1), 85-95.
Nikkinen, J., & Peltomäki, J. (2020). Crash Fears and Stock Market Effects: Evidence
 From Web Searches and Printed News Articles. Journal of Behavioral
 Finance, 21(2), 117-127
Philippas, D., Rjiba, H., Guesmi, K., & Goutte, S. (2019). Media attention and Bitcoin
 prices. Finance Research Letters, 30, 37-43.

 20
Polgreen, P. M., Chen, Y., Pennock, D. M., Nelson, F. D., & Weinstein, R. A. (2008).
 Using internet searches for influenza surveillance. Clinical infectious
 diseases, 47(11), 1443-1448.
Preis, T., Moat, H. S., & Stanley, H. E. (2013). Quantifying trading behavior in
 financial markets using Google Trends. Scientific Reports, 3, 1684.
Preis, T., Reith, D., & Stanley, H. E. (2010). Complex dynamics of our economic life
 on different scales: insights from search engine query data. Philosophical
 Transactions of the Royal Society A: Mathematical, Physical and Engineering
 Sciences, 368(1933), 5707-5719.
Ramelli, S., & Wagner, A. F. (2020). Feverish Stock Price Reactions to COVID-
 19. Swiss Finance Institute Research Paper, (20-12).
Ruan, X., & Zhang, J. E. (2016). Investor attention and market
 microstructure. Economics Letters, 149, 125-130.
Smith, G. P. (2012). Google Internet search activity and volatility prediction in the
 market for foreign currency. Finance Research Letters, 9(2), 103-110.
Vlastakis, N., & Markellos, R. N. (2012). Information demand and stock market
 volatility. Journal of Banking & Finance 36(6), 1808–1821.
Vozlyublennaia, N. (2014). Investor attention, index performance, and return
 predictability. Journal of Banking & Finance, 41, 17-35.
Whaley, R. E. (2000). The investor fear gauge. The Journal of Portfolio
 Management, 26(3), 12-17.
Wooldridge, J. M. (2002). Econometric Analysis of Cross Section and Panel Data.
 Cambridge, MA: The MIT Press.
Yung, K., & Nafar, N. (2017). Investor attention and the expected returns of
 reits. International Review of Economics & Finance, 48, 423-439.
Zhang, D., Hu, M., & Ji, Q. (2020). Financial markets under the global pandemic of
 COVID-19. Finance Research Letters, 101528.

 21
Table 1. Summary of panel unit root tests
 VIX_changes Stock_changes GTR_changes
 Cross- Cross- Cross-
Method Statistic Prob.** sections Obs Statistic Prob.** sections Obs Statistic Prob.** sections Obs
Null: Unit root (assumes
common unit root process)
Levin, Lin & Chu t* -23.431 0 13 767 -26.159 0 13 767 -19.979 0 13 767

Null: Unit root (assumes
individual unit root process)
Im, Pesaran and Shin W-stat -23.593 0 13 767 -23.625 0 13 767 -21.332 0 13 767
ADF - Fisher Chi-square 426.631 0 13 767 424.321 0 13 767 344.034 0 13 767
PP - Fisher Chi-square 460.068 0 13 767 525.935 0 13 767 424.341 0 13 767
Notes: This table includes the panel unit root tests results for VIX changes, stock market changes and
google trends indicator changes.
H0: unit root is present. P-values are in parentheses. *,** and ***indicate statistical significance at the
10%, 5%, and 1% level respectively.

Table 2. Panel data estimation results for changes on stock market VIX
Dependent Variable Vix_changes
 Pooled
 Fixed
 OLS with
 Exp. Fixed Effects with Random Effects with Effects
 Independent Variables Pooled with PCSE PCSE
 Sign PCSE PCSE with PCSE
 and
 and AR(1)
 AR(1)
 Model (1) (2) (1) (2) (1) (2) (2) (2)

C +/- 0.0067 0.0083 0.0108 0.0112 0.0096 0.0103 0.0078 0.0077
 (0.04)** (0.01)** (0.00)*** (0.00)*** (0.21) (0,00)*** (0.00)*** (0.00)***
GTR_changes(t) + 0.1206 0.1352 0.0926 0.0993 0.1028 0.1105 0.1398 0.1405
 (0.00)*** (0.00)*** (0.00)*** (0.00)*** (0.00)*** (0.00)*** (0.00)*** (0.00)***
GTR_changes(t-1) + 0.0338 -0.0093 0.0034
 (0.12) (0.71) (0.91)
Stock_changes(t) - -1.9618 -2.0118 -1.5027 -1.5058 -1.6523 -1.6656 -2.1183 -2.1220
 (0.00)*** (0.00)*** (0.00)*** (0.00)*** (0.00)*** (0.00)*** (0.00)*** (0.00)***
Stock_changes(t) x GTR_changes(t) - -3.4598 -0.8889 -1.5054
 (0.11) (0.66) (0.33)
Stock_changes(t) x GTR_changes(t-1) - -3.2075 -4.3030 -3.7950 -3.6266 -3.6301 -3.7408 -4.1490 -4.2142
 (0.04)** (0.00)*** (0.00)*** (0.00)*** (0.00)*** (0.00)*** (0.00)*** (0.00)***
ρ [AR(1) coeff.] +/- -0.1654 -0.1675
 (0.00)*** (0.00)***

Country Effects no no yes no yes no no yes
Time Effects no no yes yes yes yes no no
R2 35.71% 35.33% 55.77% 56.53% 34.90% 34.55% 34.27% 36.09%
F Test 86.09*** 140.53*** 13.87*** 17.33*** 38.52*** 63.72*** 113.21*** 28.04***
Durbin-Watson stat. 2.35 2.33 2.76 2.75 2.65 2.28 2.03 2.03
N =(ixT) 767 767 767 767 767 767 754 754
Specification tests
Cross section F-test (pooled OLS vs. FEM) p- (0.99) (0.99)
value
Period F-test (pooled OLS vs. FEM) p-value (0.00)*** (0.00)***

Hausman test (FEM vs REM) (0.08)*
Period Random
Test of cross-sectional independence by Frees (0.00)***

Modified Wald test for group wise (0.00)***
heteroskedasticity
Notes: This table presents the estimation results for the pooled, fixed and random effects models
regarding Equation (1) for the period from 02 January 2020 to 09 April 2020.
P-values are in parentheses. *,** and ***indicate statistical significance at the 10%, 5%, and 1% level
respectively. This note also applies in Table 4.

 22
Table 3 Variance decomposition results for PVAR basic
model
 Response Impulse variable
 variable and
 forecast horizon GTR_changes Stock_changes Vix_changes

 GTR_changes
 1 100.00% 0.00% 0.00%
 2 99.62% 0.25% 0.13%
 3 99.61% 0.26% 0.13%
 Stock_changes_
 1 1.69% 98.31% 0.00%
 2 2.07% 97.26% 0.67%
 3 2.08% 97.21% 0.71%
 Vix_changes
 1 2.73% 28.24% 69.03%
 2 3.33% 27.69% 68.98%
 3 3.35% 27.66% 68.98%

Notes: This table reports the results from the variance decomposition
analysis for the basic PVAR model. The first column presents the
response variable and its forecast horizon. GTR_changes refers to
changes of google trends metric about COVID-19. Vix_changes
refers to changes of stock market implied volatility. Stock_changes
refers to changes of stock market returns.

 23
Table 4. Panel data estimation results for changes on stock market VIX in Europe vs. Asia
Dependent Variable Vix_changes
 Fixed
 Pooled Fixed
 Pooled Effects
 OLS with Effects
 Exp. Fixed Effects with Random Effects with OLS with with
 Independent Variables Pooled with PCSE PCSE with
 Sign PCSE PCSE PCSE and PCSE
 and PCSE and
 AR(1) and
 AR(1) AR(1)
 AR(1)
 Model j=EUR j=Asia j=EUR j=Asia j=EUR j=Asia j=EUR j=Asia j=EUR j=Asia

C +/- 0.0082 0.0082 0.0112 0.0111 0.0103 0.0103 0.0085 0.0084 0.0084 0.0084
 (0.01)** (0.01)** (0.00)*** (0.00)*** (0.17) (0,00)*** (0.00)*** (0.00)*** (0.00)*** (0.00)***
Dj x GTR_changes(t) + 0.1640 0.0715 0.1115 0.0710 0.1244 0.0772 0.2525 0.1535 0.2519 0.1538
 (0.00)*** (0.12) (0.00)*** (0.07)* (0.00)*** (0.04)** (0.00)*** (0.04)** (0.00)*** (0.04)**
(1-Dj) x GTR_changes(t) + 0.0931 0.1592 0.0744 0.1099 0.0846 0.1226 0.1921 0.2552 0.1913 0.2546
 (0.01)** (0.00)*** (0.04)** (0.00)*** (0.01)** (0.00)*** (0.00)*** (0.00)*** (0.00)*** (0.00)***
Dj x Stock_changes(t) - -2.1195 -2.2504 -1.5771 -1.7971 -1.7503 -1.9450 -2.1343 -2.2972 -2.1402 -2.3095
 (0.00)*** (0.00)*** (0.00)*** (0.00)*** (0.00)*** (0.00)*** (0.00)*** (0.00)*** (0.00)*** (0.00)***
(1-Dj) x Stock_changes(t) - -1.8588 -1.9269 -1.4287 -1.4051 -1.5704 -1.5670 -1.9396 -1.9720 -1.9431 -1.9745
 (0.00)*** (0.00)*** (0.00)*** (0.00)*** (0.00)*** (0.00)*** (0.00)*** (0.00)*** (0.00)*** (0.00)***
Dj x Stock_changes(t) x GTR_changes(t-1) - -5.4529 -3.5387 -3.9877 -3.7593 -4.2297 -3.7197 -4.7851 -2.6949 -4.9186 -2.8032
 (0.00)*** (0.07)* (0.02)** (0.02)** (0.01)** (0.02)** (0.00)*** (0.25) (0.00)*** (0.23)
(1-Dj) x Stock_changes(t) x GTR_changes(t-1) - -1.9794 -4.8256 -2.9839 -3.7633 -2.8230 -3.9512 -1.5600 -4.3682 -1.5504 -4.3790
 (0.39) (0.01)** (0.14) (0.03)** (0.16) (0.02)** (0.55) (0.01)** (0.52) (0.01)**
ρ [AR(1) coeff.] +/- -0.1620 -0.1655 -0.1644 -0.1678
 (0.00)*** (0.00)*** (0.00)*** (0.00)***
Country Effects no no no no no no no no yes yes
Time Effects no no yes yes yes yes no no no no
R2 35.60% 35.37% 56.45% 56.55% 34.99% 34.74% 38.19% 38.11% 37.32% 37.23%
F Test 71.58*** 70.88*** 16.51*** 16.58*** 32.34*** 32.30*** 67.47*** 67.2400 24.59*** 24.51***
Durbin-Watson stat. 2.32 2.33 2.74 2.75 2.28 2.28 2.06 2.06 2.06 2.06
N =(ixT) 767 767 767 767 767 767 754 754 754 754
Specification tests
Cross section F-test (pooled OLS vs. FEM)
 (0.99) (0.99)
p-value
Period F-test (pooled OLS vs. FEM) p-value (0.00)*** (0.00)***
Hausman test (FEM vs REM)
 (0.13) (0.16)
Period Random
Test of cross-sectional independence by Frees (0.00)*** (0.00)***
Modified Wald test for group wise
 (0.00)*** (0.00)***
heteroskedasticity
Note: P-values are in parentheses. *,** and ***indicate statistical significance at the 10%, 5%, and 1% level respectively.

 24
Table 5. Variance decomposition results for PVAR (European vs. non-
European regions)
 Response Impulse variable
 variable and
 Forecast
 horizon
 European vs.
 Non- GTR_changes_
 GTR_changes_EUR Stock_changes Vix_changes
 European Ex EUR
 Markets
 Stock_changes
 1 1.46% 0.40% 98.14% 0.00%
 2 1.84% 0.44% 97.08% 0.63%
 3 1.86% 0.44% 97.03% 0.67%
 Vix_changes
 1 2.24% 0.67% 28.15% 68.94%
 2 2.48% 1.03% 27.60% 68.89%
 3 2.49% 1.05% 27.58% 68.88%
Notes: This table reports the results for the European vs. non European markets by
implementing the variance decomposition analysis for the basic PVAR model. The first
column presents the response variable and its forecast horizon.GTR_changes_EUR refers to
google trends metric for European markets and GTR_changes_Ex EUR for non-European
markets (the rest markets in our sample). Vix_changes refers to changes of stock market
implied volatility. Stock_changes refers to changes of stock market returns.

Table 6. Variance decomposition results for PVAR (Asian vs. non-Asian
regions)
 Response Impulse variable
 variable and
 Forecast
 horizon
 Asian vs Non- GTR_changes_
 GTR_changes_ASIA Stock_changes Vix_changes
 Asian Markets Ex ASIA
 Stock_changes
 1 0.15% 1.77% 98.08% 0.00%
 2 0.23% 2.06% 97.06% 0.65%
 3 0.23% 2.07% 97.01% 0.69%
 Vix_changes
 1 0.57% 2.24% 28.15% 69.04%
 2 0.74% 2.65% 27.60% 69.00%
 3 0.75% 2.67% 27.57% 69.00%
Notes: This table reports the results from the Asian vs. non Asian markets by implementing
the variance decomposition analysis for the basic PVAR model. The first column presents the
response variable and its forecast horizon. GTR_changes_ASIA refers to google trends
metric for Asian markets and GTR_changes_ Ex ASIA for non-Asian markets (the rest
markets in our sample). Vix_changes refers to changes of stock market implied volatility.
Stock_changes refers to changes of stock market returns.

 25
Table 7. Panel data estimation results for Google Trend metric on dynamic conditional correlation between VIX & Stock changes
Dependent Variable abs(correlation between Vix&Stock_changes)
 Exp. Fixed Effects with PCSE and
 Independent Variables Pooled with PCSE and AR(1)
 Sign AR(1)
 Model j=All j=EUR j=Asia j=all j=EUR j=Asia

C +/- 0.03349 0.0345 0.0348 0.097461 0.1008 0.0978
 (0.00)*** (0.00)*** (0.00)*** (0.00)*** (0.01)** (0.01)**
Dj x GTR_changes(t-1) + 0.026026 0.0296 0.0462 0.019484 0.0229 0.0210
 (0.02)** (0.00)*** (0.00)*** (0.02)** (0.01)** (0.20)
(1-Dj) x GTR_changes(t-1) + 0.0204 0.0222 0.0011 0.0191
 (0.23) (0.04)** (0.94) (0.04)**
ρj [AR(1) coeff.] +/- 0.955131 0.9550 0.9488 0.861368 0.9139 0.7969
 (0.00)*** (0.00)*** (0.00)*** (0.00)*** (0.00)*** (0.00)***
Country Effects no no no yes yes yes

 2
R 92.45% 92.59% 92.58% 93.80% 94.80% 93.90%
F Test 4681.83*** 2394.23.25***2392.78*** 818.78*** 881.25*** 739.27***
Durbin-Watson stat. 2.13 2.14 2.14 2.03 2.04 2.04
N =(ixT) 767 767 767 767 767 767
Specification tests
Cross section F-test (pooled OLS vs. FEM) p-value (0.00)*** (0.00)*** (0.00)***
 Hausman test (FEM vs REM) (0.00)*** (0.00)*** (0.00)***
 Test of cross-sectional independence by Frees (0.00)*** (0.00)*** (0.00)***
 Modified Wald test for group wise
 (0.00)*** (0.00)*** (0.00)***
 heteroskedasticity
Notes: This table presents the results for the relationship between Google Trend metric and the dynamic conditional correlation between VIX & Stock changes for three
country groups (All, Europe, Asia). P-values are in parentheses. *,** and ***indicate statistical significance at the 10%, 5%, and 1% level respectively. The “abs” refers to
the absolute values of the dynamic conditional correlation estimates from the estimated DCC-GARCH models.

 26
You can also read