A Robust Early Warning System for Preventing Flash Floods in Mountainous Area in Vietnam - MDPI
←
→
Page content transcription
If your browser does not render page correctly, please read the page content below
International Journal of
           Geo-Information

Article
A Robust Early Warning System for Preventing Flash
Floods in Mountainous Area in Vietnam
Thanh Van Hoang 1, * , Tien Yin Chou 1 , Ngoc Thach Nguyen 2 , Yao Min Fang 1 , Mei Ling Yeh 1 ,
Quoc Huy Nguyen 3 and Xuan Linh Nguyen 3
 1    Geographic Information Systems Research Center, Feng Chia University, Taichung 40724, Taiwan;
      jimmy@gis.tw (T.Y.C.); frankfang@gis.tw (Y.M.F.); milly@gis.tw (M.L.Y.)
 2    VNU, University of Science, Faculty of Geography, No 334 Nguyen Trai, Thanh Xuan, Hanoi City 100000,
      Vietnam; nguyenngocthachhus@vnu.edu.vn
 3    PhD Program of Civil and Hydraulic Engineering, College of Construction and Development,
      Feng Chia University, Taichung 40724, Taiwan; st_huy@gis.tw (Q.H.N.); st_linh@gis.tw (X.L.N.)
 *    Correspondence: van@gis.tw; Tel.: +886-42451-6669

 Received: 22 February 2019; Accepted: 5 May 2019; Published: 10 May 2019

 Abstract: The early-warning model for flash floods is based on a hydrological and geomorphological
 concept connected to the river basin, with the principle that flash floods will only occur where there is
 a high potential risk and when rainfall exceeds the threshold. In the model used to build flash-floods
 risk maps, the parameters of the basin are analyzed and evaluated and the weight is determined
 using Thomas Saaty’s analytic hierarchy process (AHP). The flash-floods early-warning software
 is built using open source programming tools. With the spatial module and online processing,
 a predicted precipitation of one to six days in advance for iMETOS (AgriMedia—Vietnam) automatic
 meteorological stations is interpolated and then processed with the potential risk maps (iMETOS is
 a weather-environment monitoring system comprising a wide range of equipment and an online
 platform and can be used in various fields such as agriculture, tourism and services). The results
 determine the locations of flash floods at several risk levels corresponding to the predicted rainfall
 values at the meteorological stations. The system was constructed and applied to flash floods disaster
 early warning for Thuan Chau in Son La province when the rainfall exceeded the 150 mm/d threshold.
 The system initially supported positive decision-making to prevent and minimize damage caused by
 flash floods.

 Keywords: early warning; flood; flash floods; analytic hierarchy process; threshold; disaster management

1. Introduction
     The weather in Vietnam in recent years has been increasingly unusual. Droughts, floods, landslides,
thunderstorms and other storms have complicated developments, seriously affecting the country’s
economy, which depends heavily on agricultural production. In particular, Vietnam is considered to be
one of the countries most severely affected by climate change due to its long coastline. If sea level rises
by 1 m, 40% of the Mekong Delta area and 10% of the Red River Delta area will be flooded, directly
affecting 20–30 million people.

1.1. Unusual Weather throughout the Country
     In 2016 and early 2017, anomalous, increasingly intense weather occurred throughout the country.
Specifically, in the dry season in 2016, many places in South and Central Vietnam were dry due to a
rainfall shortage of 30–40% and the flow of small rivers led to saline intrusion one month earlier in
these regions. In the river mouth of Central Vietnam and especially in the Mekong Delta, in many

ISPRS Int. J. Geo-Inf. 2019, 8, 228; doi:10.3390/ijgi8050228                       www.mdpi.com/journal/ijgi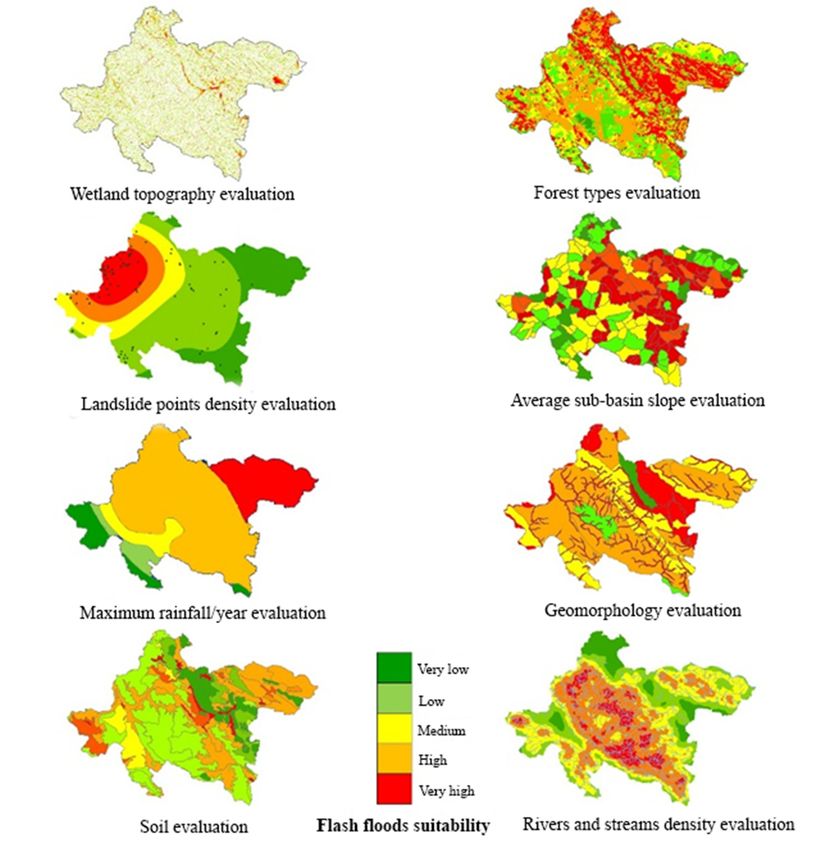
ISPRS Int. J. Geo-Inf. 2019, 8, 228                                                                     2 of 14

places where saline intrusion is 80–100 km or more, farmers face problems because of the salinity limit
and the lack of fresh water for living and production is very serious.
     In Central Vietnam, the flood and rain came late yet caused flooding; the floods lasted many days
in the last months of 2016, causing great damage to property and people. In the north, the first cold
spell came earlier than usual; however, people rarely felt the cold air of the winter, because alternating
cold spells had days of high temperature.
     Unseasonal rainfall damages the production of winter–spring crops as well as fruit trees. According
to meteorological forecasting experts, there are many causes, most of which are due to climate
change having changed certain natural laws. The meteorological forecaster, Ms Le Ha (Medium and
Long-term Meteorological Forecasting Division, National Center for Hydro-Meteorological Forecasting,
leha246@gmail.com) said that the weather is currently neutral and tends to move towards El Niño
(usually associated with drought), so the rainy season in South Vietnam has come earlier than normal
for many years.
     Every year, there are about 10 to 15 flash floods in the northern, central, highland and southeast
regions of Vietnam. Due to extreme weather, heavy and prolonged rain is the cause of flash floods and
landslides, sweeping trees, rocks and people and property where it passes.
     Therefore, natural disasters combined with human factors are causing more floods, flash floods
and landslides. If this situation cannot be changed and flooding and landslides continue, outcomes
will not be improved.

1.2. Purpose of this Work and its Background
      In recent years, floods have “surrounded” the Vietnamese provinces of Yen Bai, Son La, Lao Cai,
Phu Tho, Hoa Binh, Thanh Hoa, Nghe An and Ha Tinh. As of 7:00 A.M. on 24 July 2018, the number
of people killed by flooding was 27, with Son La Province having the highest loss, with 13 people
dead. Additionally, rain and flooding also cause damage to property and transport infrastructure in
many localities.
      Therefore, in addition to urgent measures to overcome immediate consequences, such as support
for money, food, medicine and construction materials for people in need, the construction of an
early-warning system to mitigate flash flooding is necessary for more sustainable and proactive natural
disaster prevention and control measures.
      In the Digital Age, many countries have established disaster early-warning systems [1–9]. However,
this study is the first research in Vietnam to integrate rainfall data with statistical weather data, satellite
image analysis, an MCA (Multi Criteria Model) model, webGIS, Flash Flood Potential Index (FFPI) and
iMETOS data (auto-rainfall station) to analyze and provide flash-flood risk information to residents.
      Different from a conventional flood, a flash flood refers to a flood with high velocity, containing
many debris and occurring unexpectedly in minor basins with sloping terrain, thus resulting in
massive destruction. The development of flash floods is closely linked to the intensity of rainfall,
climate conditions, topographic features, human activities and the flood drainage conditions of
basins. Flash floods normally appear only a few hours after heavy rain exceeds a threshold level [10].
Unfortunately, the data on flash floods are usually in short supply and not systematic; thus, it is hard
to use common methods to make hydrological predictions for flash-flood forecasts or warnings [10].
      The primary theoretical basis of this research is the basin approach [11]. In this approach, the basin
is considered to be a relatively closed system consisting of small tributaries, and, when it rains, the
parameters of the buffer surface will determine the mode of flow movement and accumulation in basin
boundaries. In mountainous areas with large basin slopes, when rainfall exceeds the threshold, the
surface flow will accumulate to form a flash flood. Each basin produces a different mechanism of
flash-flood formulation.
      The map of flash flood risks shows the likelihood of a flash flood occurring during a minimum
period of one calendar year, usually 20–40 years [12,13]. Therefore, depending on the different rainfall
distribution by space, flash floods can appear at different times in many different locations and may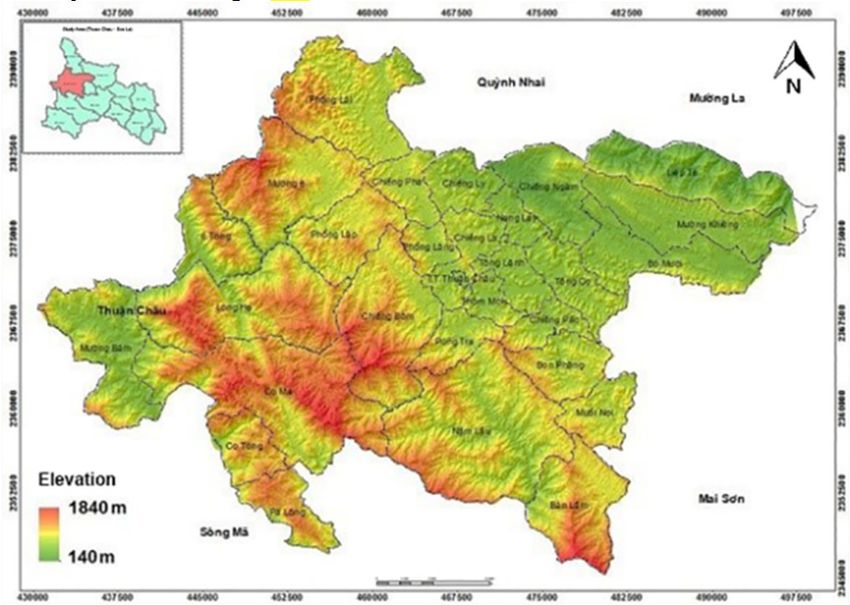
ISPRS Int. J. Geo-Inf. 2019, 8, 228 3 of 14
ISPRS Int. J. Geo-Inf. 2019, 8 FOR PEER REVIEW 3
be repeated over time [10,14,15]. In the dry season in 2016–2017, South Vietnam, including Ho Chi
be repeated
Minh over time
City, there [10,14,15].
was some In the dry
unseasonal andseason
heavy in 2016–2017,
rainfall; South Vietnam,
the number of days ofincluding
rain and Ho Chi
the total
Minh City, there was some unseasonal and heavy rainfall; the number of days of rain
rainfall of the months in the dry season exceeded the average of many years in the same period [16]. and the total
rainfall
Today, ofthethe months in of
formulation thethe
dry season
map exceeded
of flash the average
flood risks still hasofvarious
many years in the same
approaches period [16].
and methods and
Today,
producesthe different
formulation of theThere
results. map of
areflash
manyflood risks still has various approaches
hydrological-hydraulics methods (orand methods
models) and
applied,
produces
such as the different results. There
North American are many
Mesoscale Modelhydrological-hydraulics
(NAM), the River Analysis methods (or models)
System applied,
(RAS) developed
such
by theas Hydrologic
the North American
EngineeringMesoscale
Center Model
(HEC) (NAM),
in Davis,the River Analysis
California System
(HEC-RAS) (RAS)
or the Soildeveloped
and Water
by the Hydrologic Engineering Center (HEC) in Davis, California (HEC-RAS) or
Assessment Tool (SWAT) [11,12]. Most maps of flash floods are developed based on the side flash the Soil and Water
flood
Assessment
approach [13]. ToolTherefore,
(SWAT) [11,12]. Most
the maps maps oflargely
developed flash floods
projectare developed
along based
the sloping on the
sides, withside flashof
a lack
flood approach
detailed [13].
features; Therefore,
thus, the is
application maps developed largely project along the sloping sides, with a
limited.
lack ofIndetailed
this research, the basin parameterslimited.
features; thus, application is were analyzed and processed using the multi-criteria
In this
analysis research,
(MCA) thethrough
model, basin parameters were analyzed
which the entire basin areaand wasprocessed
evaluatedusing the and
by pixel multi-criteria
the results
analysis (MCA) model,
map is described through
in detail, which
meeting the the entire basin
requirements of area was evaluated
the district-level by pixel
research and
scale the results
(1:10,000) and
map is described in detail,
commune-level scale (1:5000). meeting the requirements of the district-level research scale (1:10,000) and
commune-level scale (1:5000).
2. Materials Research
2. Materials Research
2.1. Study Site
2.1. Study Site
A mountainous district in the northwest of Son La province (3/4 is high mountain—Figure 1),
Thuan Chau is located along National Highway 6, has a natural area of 154,126 ha and is inhabited by
several ethnic minorities (Thai: 74.05%; H’Mong: 11.16%; Kinh: 9.32%; Khang: 2.57%; and other ethnic
groups: 2.94%). According to the Statistical Yearbook of Viet Nam 2016 on the website of General
Statistics Office, Vietnam, Son La’s population in 2016 was around 1,259,026, whereas 153,000 people
living in Thuan Chau (study site) are affected by flooding [17].
(a) (b)
Figure
Figure1.1.(a)
(a)Position
PositionofofThuan
ThuanChau
Chaudistrict
districtand
and(b)
(b)digital
digitalelevation
elevationmodel
model(DEM).
(DEM).
Thuan
ThuanChau’s
Chau’sterrain
terrainisiselevated,
elevated,sloping
slopingand andclearly
clearlydivided:
divided:the thehighest
highestpoint
pointover
overseasealevel
levelisis
the
theCopia
Copiapeakpeak(1817
(1817m) m)and
andthethelowest
lowestpoint
pointisisSong
SongDa Da(200
(200m).m).InInthe
therainy
rainyseason,
season,Thuan
ThuanChau Chau
suffers
suffersaalot
lotofofnatural
naturaldisasters,
disasters,such
suchasaslandslides
landslidesor orflash
flashfloods.
floods.Over
Overthe thepast
pastfew
fewyears,
years,for
formany
many
reasons
reasons(including
(includingclimate
climatechange
changeandanddeforestation),
deforestation), flash floods
flash have
floods havestarted to grow
started to growin terms of
in terms
intensity andand
of intensity frequency,
frequency,causing
causingsevere damage
severe damage to to
local
localcommunities.
communities.AsAssuch, such,research
researchon onthe
the
development
developmentofofan anearly-warning
early-warningsystemsystemforforflash
flashfloods
floodsatatdistrict
districtlevel
levelhashasbecome
becomean animperative,
imperative,
urgent
urgentand
andpractical
practicalrequirement.
requirement.With Withthis
thissystem,
system,information
informationalertsalertscan
canbebetransmitted
transmittedtotodifferent
different
people
people in various
variousways,ways,such
such as as message
message boards,
boards, SMS SMS
and webandpages
web orpages
can beorconverted
can be converted to
to traditional
traditional warning signals (speakers, gongs). Accordingly, local people
warning signals (speakers, gongs). Accordingly, local people and managers can make appropriate and managers can make
appropriate
decisions todecisions to prevent
prevent natural natural disasters.
disasters.
In river basins, to develop a map of flash-flood and mud-flood risks, factors such as landslide,
maximum rainfall, the cumulative value of surface topography, surface characteristics, soil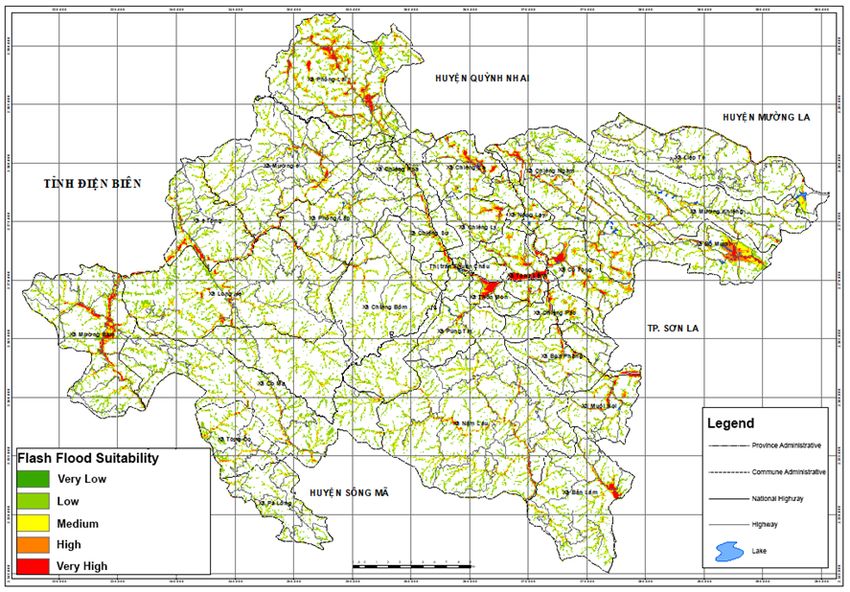
ISPRS Int. J. Geo-Inf. 2019, 8, 228                                                                             4 of 14

      In river basins, to develop a map of flash-flood and mud-flood risks, factors such as
landslide, maximum rainfall, the cumulative value of surface topography, surface characteristics,
    ISPRS Int. J. Geo-Inf. 2019, 8 FOR PEER REVIEW                                                                  4
soil characteristics, the weathered shell of the surface and the average slope of tributaries are included
as the  input data for
    characteristics,    thethe     analytical
                              weathered       model,
                                           shell of theconstructed  withaverage
                                                        surface and the  a detailed
                                                                                slopelevel  of research
                                                                                       of tributaries are[12,18].
                                                                                                          included as
    the input data for the analytical model, constructed with a detailed level of research [12,18].
2.2. The Theoretical Model in Flash Flood Warning
   2.2.
     TheThe Theoretical
          general       Modelofinthe
                  principle       Flash Flood
                                     model  is Warning
                                               that flash floods will only occur in locations with high
potential risks and when rainfall exceeds the flood level. This concept is illustrated in Figure 2.

                                                          (a)

                                                          (b)

      Figure  2. (a)
          Figure      Model
                  2. (a)     of of
                         Model  information
                                   informationprocessing
                                               processingand
                                                          andintegration,
                                                              integration, (b) Workflow of
                                                                           (b) Workflow ofthe
                                                                                           theprocessing
                                                                                               processingserver
                                                                                                          server
      for early flash  flood warning.
          for early flash flood warning.

      As As
         such,  in order
             such,        to obtain
                     in order       an early
                                to obtain  an warning    of flash-flood
                                               early warning             risks, work
                                                                 of flash-flood  risks,needs
                                                                                         worktoneeds
                                                                                                 be done,  including:
                                                                                                       to be  done,
(1) including:
    the development       of a map of of
                (1) the development      potential
                                            a map offlash-flood   risks; (2) the
                                                       potential flash-flood      development
                                                                               risks;              of the model
                                                                                      (2) the development     of theon
flash-flood
    model onwarnings;
               flash-flood(3)  the development
                            warnings;              of an iMETOS
                                        (3) the development           automatic
                                                               of an iMETOS       meteorological
                                                                                automatic            stationstation
                                                                                            meteorological    system.
These  stations
    system.      should
             These        haveshould
                     stations   a 10–15have
                                         km active  radius,
                                              a 10–15         be directly
                                                       km active          connected
                                                                    radius, be directlyto the global meteorological
                                                                                          connected   to the global
    meteorological
network               network (www.meteoblue.com)
          (www.meteoblue.com)                              and receive about
                                       and receive any information       any information     aboutconditions
                                                                                meteorological      meteorological
                                                                                                                in the
pastconditions  in the
      30 days, the      past 30weather
                     current     days, the current
                                         and       weather
                                              weather         and weather
                                                        forecasts   for 1–6 forecasts
                                                                             days forforthe1–6 days location.
                                                                                            station  for the station
                                                                                                                It is a
    location. It is a dedicated climate station system with many new features [8,16] approved by the
    Ministry of Natural Resources and Environment to construct under the Law on Meteorology and
    Hydrology 2016 [19]; (4) the development of online WebGIS software operating in an internet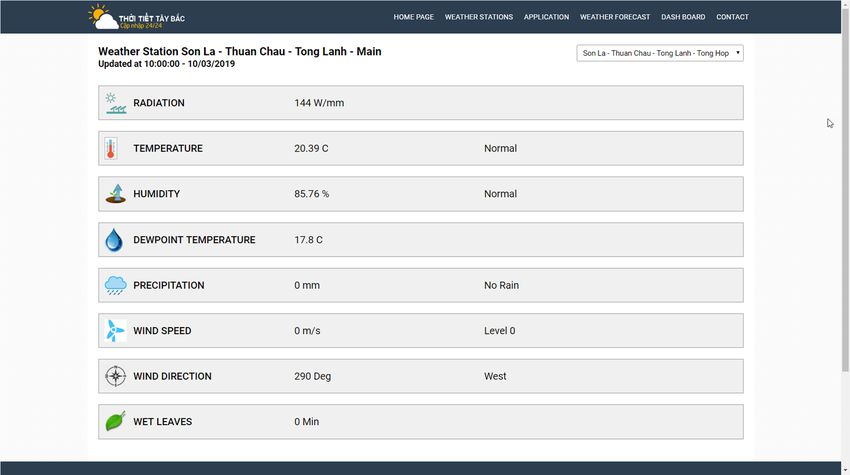
ISPRS Int. J. Geo-Inf. 2019, 8, 228 5 of 14
dedicated climate station system with many new features [8,16] approved by the Ministry of Natural
Resources and Environment to construct under the Law on Meteorology and Hydrology 2016 [19];
(4) the development of online WebGIS software operating in an internet environment to quickly process
rainfall forecasts and integrate them into the potential flash flood risks. Where rainfall exceeds the
threshold level, it is possible to quickly identify and provide timely information on the expected time
of flash-flood generation and the locations where flash floods can occur in varying degrees.
3. Research Methodology
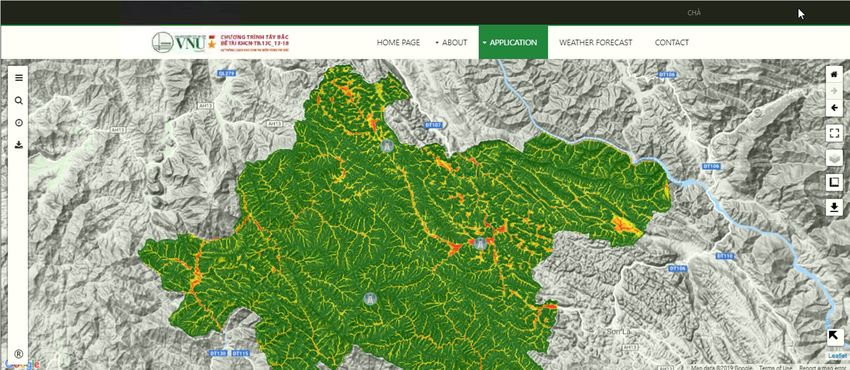
3.1. Data Used in the Research
Depending on the research map scale, a number of information layers reviewed will be different.
For the 1:10,000 scale for the district level, the information layers included in the evaluation are: mean
annual rainfall of several years (RM), topographic wetness index (TWI), average slope of tributes (SB),
landslide density (LS), geomorphology (GM), soil (S), forest (FR) and river density (RD). The evaluation
rating is divided into five levels: Level 1: very low; Level 2: low; Level 3: medium; Level 4: high; and
Level 5: very high [20].
The ratings for each information layer are determined by the expert coefficient and pairwise
comparative analysis (analytic hierarchy process, AHP) [21].
There are nine types of map to be collected from difference sources. This research collected not
only statistical data but also real-time information for rainfall amount from the auto-rainfall stations
(iMETOS). Statistical data were collected over 33 years and included daily rainfall amount and daily
temperature data. Most of these data were collected from the Ministry of Agriculture and Development
and the Vietnam Ministry of Natural Resources and Environment, as shown in Table 1.
Table 1. Materials used in the research.
No. Type of Material Features Source of Data
Ministry of Natural Resources and Environment
1 Topographic map Scale 1: 10,000
(MONRE)
Institute of Forest Planning and Design (Analysis
2 Forest map Scale 1: 10,000 from SPOT (Satellite for observation of Earth) and
field survey)
Analysis from Landsat 8; OLI (Operational Land
3 Covering layer map Scale 1: 10,000
Imager) image
Institute of Soils and Fertilizers, Ministry of
4 Soil map Scale 1: 10,000
Agriculture and Rural Development
5 Geomorphological map Scale 1: 10,000 Formed according to the original morphology
Formed using GIS (Geographic Information
6 Landslide risk map Scale 1: 10,000
System)
Institute of Meteorology, Hydrology and Climate
52 years (from
7 Historical rainfall data Change (Ministry of Natural Resources and
1960 to 2015)
Environment)
8 Rainfall forecast Data iMETOS station data of the research
Historical flood data
9 Position, level Statistics and field interviews
from 2000 to 2016
3.2. Muti-Criteria Analysis Model
This model integrates the hydrological and basin geomorphology models assisted by GIS
technology [20]. Applying this method, the research focuses on identifying the factors that cause a flash
flood in the basin, including soil properties, vegetation cover, basin slope, river density and cumulative
flow, and, in comparison with statistics, is used to classify the potentiality of flash-flood generation of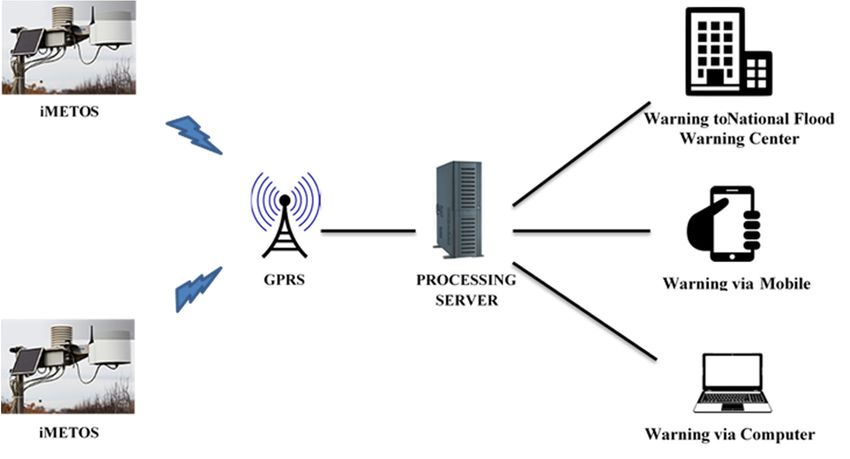
ISPRS Int. J. Geo-Inf. 2019, 8, 228                                                                                                                      6 of 14

each information layer. Geographic information system is used for weighing and integrating spatial
elements with the ratings and flow at each pixel of the raster-form map. This method is qualitative
and subjective in nature but is suitable for the conditions of small and medium-sized river basins,
where there is a lack of meteorological and hydrological stations [20].

3.3. Formulation of Space Model in Early Flash Flood Warning
      The threshold for flash-flood generation in serving early warnings is very important; however,
it is hard to determine in an accurate manner [2,3,13,14]. Thresholds of flash-flood generation vary
widely, ranging from 100 mm/h to 220 mm/d, depending on the basin surface. Most flash-flood basins
have an average slope of more than 30% and forest cover of less than 10% of the basin’s surface [13].
Researchers of flash floods in Vietnam have divided the probability of flash floods into four levels [22]:
Level I (very high risk of flash flood), in basins where all four natural condition factors occur at the
same time (relatively frequent rainfall of at least 100 mm/d, average slope of more than 30%, forest
coverage of less than 10%, medium and low permeability); Level II (high risk of flash flood), in basins
where three natural condition factors occur at the same time (relatively constant rainfall of at least
100 mm/d, with two of the three remaining factors of Level I); Level III (medium risk), in basins with
relatively constant rainfall of at least 100 mm/d and one of the remaining three factors; and Level IV
(less risk of flash flood), none of the indicators mentioned above. Because flash floods normally appear
very quickly and happen in a short time, the flash-flood forecast, or warning, must also be made quickly
and some flash floods are even completely unpredictable. The method of the threshold of flash-flood
generation facilitates the identification of regions having risks of flash flood and partial rains.
      The function for the calculation of early flash flood warning is (Equation (1)):
                                                                             p
                                                                   Fr =       f.p,                                                                          (1)

where Fr is the early warning map of flash-flood risks; f is the maximum rainfall forecast; and p is the
potential flood risk map (FFPI is the flash flood potential index).

4. Results

4.1. Formulation of the Thuan Chau Flash Flood Risk Map
     In reference to some published research [2,15], it is possible to evaluate the layers of basin surface
associated with flash-flood risks in the following tables (Tables 2 and 3).

      Table 2. Flash flood risk evaluation for geomorphology (GM), soil (S) and forest (FR) information layers.
   Evaluation Level                   FR                                                GM                                                   S
                                                        Surface height is over 1,000 m a.s.l; curved; weak synthetic
       Level 1        Bamboo mixed forest               abrasion                                                                Rocky mountain
                                                        Top surface is below 1,000 m a.s.l; arched form; surface sliding
                                                        Sloping ramps on limestone; sloping, very sloping; wash drift,
                                                                                                                                Reddish brown soil on
                      Medium broad-leaved               landslide
                                                                                                                                limestone
       Level 2        evergreen forest                  Sloping, landslide washed on limestone, lime alternating; very
                                                                                                                                Reddish brown soil on basic
                      Bamboo forest                     sloping, up to straight sloping, foot slope more relaxed; wash drift,
                                                                                                                                and neutral magma
                                                        landslide
                                                        Slope slides are quite strong; slightly concave or crooked, top
                      Evergreen broad-leaved forest
                                                        slope 25–30◦ , under 30–40◦ ; landslide on the original stope slides
                      Evergreen restored broad-leaved
                                                        Ribs worn on different rocks; slightly convex, sloping average of
                      forest
       Level 3                                          15–25◦ , double place 20–25◦ ; synthetic abrasive                       Gold soil on sandstone
                      Forest on rocky surface
                                                        Medium slope; fairly straight or slightly concave, with average
                      mountains
                                                        slope of 25–30◦ ; landslide on thick weathering crust, sliding on
                      Plantation forest
                                                        original rock
                                                                                                                                Golden red soil changes due
                      Residence                         Surface of flood accumulation; ribs at the foot of the flank, slope
       Level 4                                                                                                                  to wet rice cultivation
                      Other land                        6–15◦ , chaotic composition; surface erosion
                                                                                                                                Yellow soil on clay
                                                        Chute drainage flow; V-shaped cross-sectional area, straight
                                                        vertical rectilinear or hierarchical display of erosion terrace; deep   Valley land due to
                      Vacant land
       Level 5                                          erosion                                                                 condensation products
                      Water surface
                                                        Eroded trough—accumulated; V-shaped, narrow U-shaped cross;             Yellow brown soil on old silt
                                                        erosion—accumulation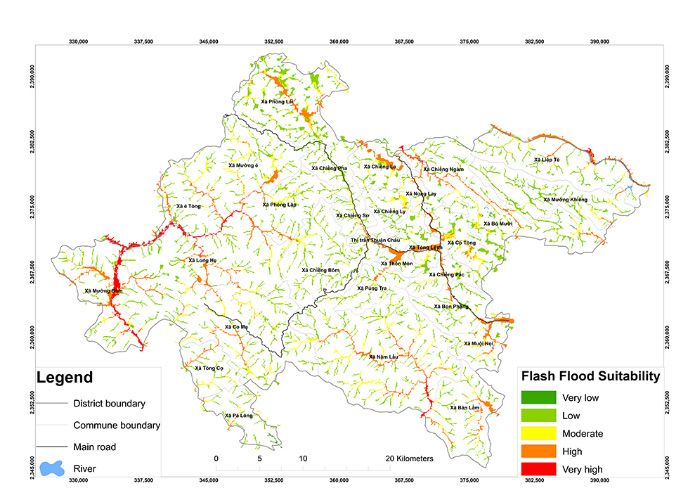
ISPRS Int. J. Geo-Inf. 2019, 8 FOR PEER REVIEW                                                                       7

                                                                                                cultivation
                                                                                                Yellow soil on clay
                                     Chute drainage flow; V-shaped cross-sectional area,
                                                                                                  Valley land due to
                                     straight vertical rectilinear or hierarchical display of
   ISPRS Int. J. Geo-Inf. 2019, 8, 228                                                                            7 of 14
             Vacant land                                                                          condensation products
Level 5                              erosion terrace; deep erosion
             Water surface                                                                        Yellow brown soil on old
                                     Eroded trough—accumulated; V-shaped, narrow U-
         Table 3. Flash flood risk evaluation  indicators                                         silt topographic
                                                          for average rainfall of several years (RM),
                                     shaped cross;  erosion—accumulation
         wetness index (TWI), average slope of tributary (SB), landslide density (LS) and river density (RD)
         information
        Table 3. Flashlayers.
                       flood risk evaluation indicators for average rainfall of several years (RM), topographic
      wetness index (TWI), average slope of tributary (SB), landslide density      (LS) and river density (RD) 2
        Evaluation Level          TWI    LS (Score/km2 ) SB (Degrees)              RM (mm)        RD (km/mm )
      information layers.
             Level 1              0–0.9     0.01–0.02            >40       40    250–350
                                                                              40
                                                              40        250–350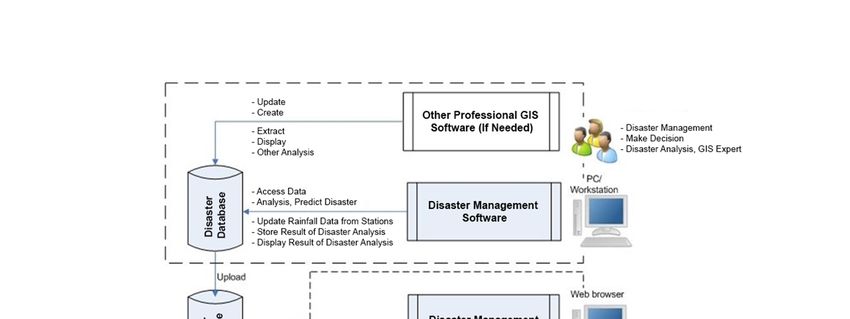
ISPRS Int. J. Geo-Inf. 2019, 8, 228                                                                            8 of 14

4.2. Calculation of Ratings for Information Layers using AHP
    The AHP method was adopted to calculate the ratings for each layer [10,18]. The results are
shown in Table 4.

                    Table 4. Calculation matrix to determine the ratings of each information layer.

       Info Layer        TWI          FR     LS      SB      RM         GM      S   RD      Total     Ratings
           TWI            0.33        0.26   0.23    0.25    0.45       0.34
                                                                          0.18     0.22    2.27        0.28
            FR            0.11        0.09   0.14    0.17    0.06       0.06
                                                                          0.16     0.13    0.91        0.11
            LS            0.07        0.03   0.05    0.03    0.04       0.04
                                                                          0.11     0.09    0.44        0.05
            SB            0.11        0.04   0.14    0.08    0.08       0.06
                                                                          0.13     0.13    0.77        0.11
           RM             0.16        0.35   0.28    0.25    0.23       0.34
                                                                          0.18     0.22    2.02        0.25
           GM             0.11        0.18   0.14    0.17    0.08       0.11
                                                                          0.11     0.13    1.02        0.13
             S            0.05        0.01   0.01    0.02    0.03       0.03
                                                                          0.03     0.01    0.19        0.02
           RD             0.07        0.03   0.02    0.03    0.05       0.04
                                                                          0.11     0.04    0.38        0.05
                                                                          Consistency Index (CI)       0.08
                                                               Random Consistency Index by N (RI)       0.41
                                                                          Consistency Ratio (CR)       0.056

     The CR reliability of the matrix is determined by the CR common index. If the value of the CR
index is less than or equal to 0.1, then the consistency between the factors in the comparison matrix is
guaranteed. For the eight factors included in this research, CR = CI/RI = 0.08/1.41 = 0.056 (an index
value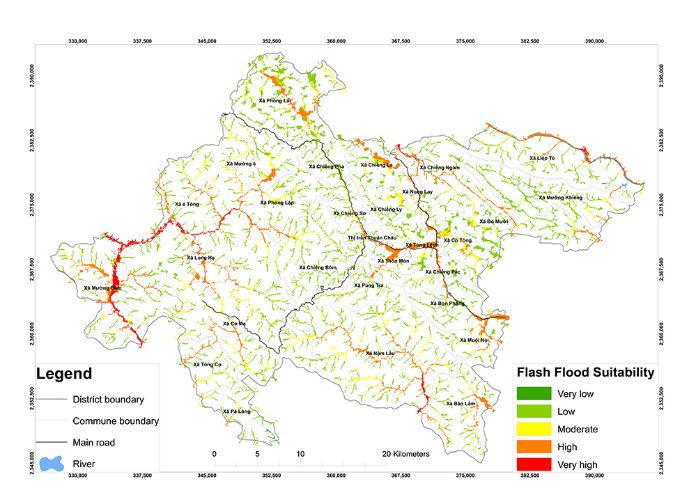
With the ratings calculated in Table 3, the function is specified as equivalent (Equation 3):

                       FFPI = 0,28 * TWI + 0.11 * F + 0.05 * LS + 0.1 * SB + 0.25 *R + 0.13 * GM
                                                                                                                 (3)
                                                     + 0.02 *S + 0.05 * DS.
ISPRS Int. J. Geo-Inf. 2019, 8, 228                                                                          9 of 14
       The result obtained is the flash-flood risk map with different numerical values (Figure 4). In its
  original form, it has not yet featured an early warning map of a flash-flood risk.

                           ISPRS Int. J. Geo-Inf. 2019, 8 FOR PEER REVIEW

                              By comparing the data and the locations of flash floods over the past few years, from 2000 to t
                        present, there is a correlation between reality and forecast. In the Muoi stream basin of the Thu
                               (a)                                                       (b)
                        Chau district, according to the statistics from 2000 to the present, a flash flood begins to arise wh
             Figure
          Figure  4. 4.
                     (a)(a) Flash
                        rainfall
                          Flash   flood
                                flood   risk
                                  reaches
                                      risk   map
                                           150
                                           map   and
                                               and (b)(b)
                                               mm/d.      flash
                                                         At
                                                        flashtheflood
                                                                 same
                                                              flood   risk
                                                                    risk   information
                                                                        stream,  there
                                                                         information   (FFPI)forfor
                                                                                       are also
                                                                                     (FFPI)         each
                                                                                                   many
                                                                                                  each   pixel.
                                                                                                          places with a high risk of fla
                                                                                                       pixel.
                        floods, which is explained by the influence of various parameters of the buffer.
4.4. Inspection of the Accuracy of the Thuan Chau Flash-Flood Risk Map
     Figure 5 shows 4.4
                     the Inspection
                          similaritiesof the Accuracy
                                      between         of with
                                               locations the Thuan
                                                              a highChau
                                                                      risk ofFlash-Flood
                                                                              a flash floodRisk Map
                                                                                            (FFPI) on the risk
map and locations where local flash floods occurred. The comparative results on the map show that
flash-flood locations in the past were in high-risk areas. To test the accuracy of the research results, the
receiver operating characteristic (ROC) method was used. In signal detection theory [23,24], the ratio
of the received signal (accurate) to the total signal generated is used to evaluate the accuracy of the
system. From the received signal, the Statistical Product and Services Solutions (SPSS) software can
analyze and draw a signal acquisition characteristic curve (ROC) to determine the reliability of the
system. Each point on the curve is the coordinates corresponding to the actual signal frequency on the
vertical axis and the theoretical signal frequency on the horizontal axis (Figure 6).

                                  Figure
                              Figure       5. Comparison
                                     5. Comparison           of results
                                                     of forecast forecastwith
                                                                           results  withfloods.
                                                                                      Figure 6. Receiver operating
                                                                              historical
                                  historical floods.                                  characteristic    (ROC)    curve
     The higher the area under curve (AUC) value is, the better the distinction between  the two states
                                                                                      constructed   from the historical
of precision (value 1) and inaccuracy (value 0). As the AUC increases, the curve flashapproaches
                                                                                              flood the
                                                                                                     screening system
upper horizontal axis with AUC = 1. The determination of accuracy is based on the following
                                                                                      comparedratings:
                                                                                                  with the Thuan Chau
0.80–0.90 = very good (A), 0.60–0.70 = good (B) and 0.50–0.60 = wrong (C). Comparing  flood risk
                                                                                             with map.
                                                                                                   pastAUC: area under
                                                                                      for AUC = 0.86
flash-flood data and the flash-flood risk map (Figure 6), the ROC curve in Figure 5 curve.
indicates that the accuracy is relatively good.
                          The higher the area under curve (AUC) value is, the better the distinction between the two stat
                     of precision (value 1) and inaccuracy (value 0). As the AUC increases, the curve approaches the upp
                     horizontal axis with AUC = 1. The determination of accuracy is based on the following ratings: 0.8
                     0.90 = very good (A), 0.60–0.70 = good (B) and 0.50–0.60 = wrong (C). Comparing with past flash-floo
                     data and the flash-flood risk map (Figure 6), the ROC curve in Figure 5 for AUC = 0.86 indicates th
                     the accuracy is relatively good.

                           4.5 Formulation of the Flash Flood Warning Map for Thuan Chau District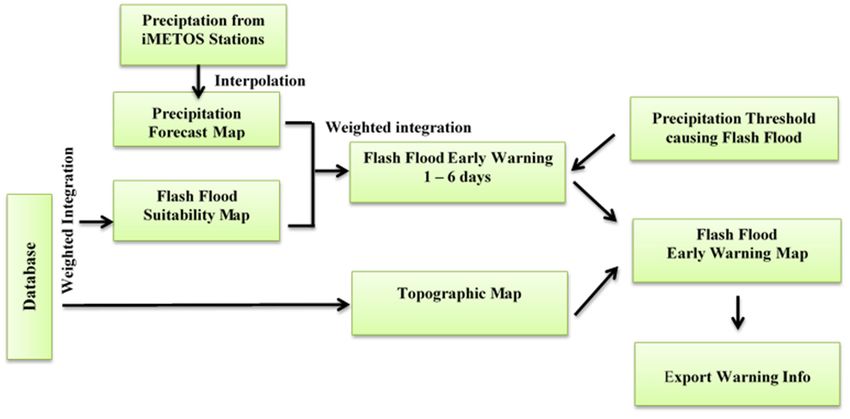
ISPRS Int. J. Geo-Inf. 2019, 8, 228                                                                     10 of 14

   5. Comparison of forecast
                        Figure results withoperating characteristic
                               6. Receiver              Figure 6. (ROC)
                                                                     Receiver
                                                                           curveoperating
                                                                                 constructed from the historical flash flood
 cal floods.            screening system compared with characteristic
                                                        the Thuan Chau flood
                                                                          (ROC)risk map.
                                                                                    curveAUC: area under curve.
                                                        constructed from the historical
                  4.5. Formulation of the Flash Flood Warning Map for Thuan Chau District
                                                        flash flood screening system
                        At the present, there are manycompared
                                                         traditionalwith the Thuan Chau
                                                                     meteorology     stations to measure accumulative rainfall
                                                        flood risk map.  AUC: area  under
                  for the province. Additionally, AgriMedia (Hanoi, Vietnam) have set up more than 100 iMETOS
                                                        curve. have been chosen for analyzing and setting the threshold.
                  stations, of which three iMETOS stations
                    Therefore, we integrated these between auto-rainfall stations and traditional meteorology stations
 her the area underforcurve  (AUC) value is, the better the distinction between the two states
                        analyzing.
 (value 1) and inaccuracy   (value  0). As the AUC
                          The solar-powered          increases,
                                                 automatic        the curve
                                                              weather         approaches
                                                                         station            the upper for model 2 consists of three
                                                                                  system developed
 xis with AUC = 1. iMETOS
                     The determination     of accuracy
                               stations which   are ableistobased  on online
                                                             connect   the following   ratings: 0.80–
                                                                               in a “two-way”     manner with the Meteoblue Global
 ood (A), 0.60–0.70Meteorological
                     = good (B) and 0.50–0.60    = wrong    (C). Comparing     with
                                       Center of Switzerland. By applying Equation   past flash-flood
                                                                                               (3), with information layers of 1-day
  flash-flood risk map   (Figure
                    forecast  (or 6),
                                  twothetoROC   curve
                                          six-day      in Figure
                                                   forecasts),     5 for
                                                                 the earlyAUC   = 0.86 map
                                                                            warning    indicates   that
                                                                                             is established. In Thuan Chau district,
  is relatively good.based on the statistics from the 2000–2017 period and the evaluation model, the rain threshold for
                    generating a flash flood (Rmax) was divided into five levels: Level 5 Rmax ≥ 300 mm/d; Level 4: 250 <
 tion of the Flash Flood Warning Map for Thuan Chau District
                    Rmax < 300 mm/d; Level 3: 200 < Rmax < 250 mm/d; Level 2: 150 < Rmax < 200 mm/d; and Level 1:
present, there are many    < 150 mm/d
                    Rmaxtraditional       [22–24]. Figure
                                       meteorology         7A,B
                                                     stations  to show  the accumulative
                                                                  measure   results of flash-flood
                                                                                           rainfall forecast processing by rainfall
vince. Additionally,in AgriMedia
                       the province.   In locations
                                    (Hanoi,         where
                                              Vietnam)      rainfall
                                                         have        exceeds
                                                                set up  more the  threshold,
                                                                               than           flash floods will occur (Figure 7c).
                                                                                     100 iMETOS
which three iMETOS stations have been chosen for analyzing and setting the threshold.
we integrated these4.6.  Structure
                     between       of Flash Flood
                               auto-rainfall       Warning
                                              stations      System
                                                       and traditional  meteorology stations for
                         The rainfall forecast information processing for each iMETOS weather station system [10,25,26] and
 ar-powered automatic     weather
                   integration     station
                                with         system
                                      risk maps      developed
                                                 for flash        for model
                                                           flood early       2 consists
                                                                       warning          of webGIS.
                                                                                is done by three Accordingly, information is
 tions which are able to connect online   in a “two-way”    manner   with the Meteoblue  Global
                   transferred to the website to provide flash flood warning information to users [15,16,22]. The generalized
                   model and key features of the system are shown in Figure 8; this figure shows the completed resolutions
                   for an early warning system for that study site. Input data, such as daily weather data (daily rainfall,
                   daily temperature) and management documents, together with the hardware, have been analyzed,
                   accessed, stored and displayed by disaster-management software. Using webGIS tools, information
                   that is very useful for the decision will be displayed on the user interface. The residents can receive
                   early-warning alerts via SMS message, streaming video and as electronic documents.
ISPRS Int. J. Geo-Inf. 2019, 8, 228 11 of 14
(a) (b)
ISPRS Int. J. Geo-Inf. 2019, 8 FOR PEER REVIEW (c) 11
Figure
Figure7.7.Results
Resultsofof
flash-flood
flash-floodforecast processing
forecast processing bybyrainfall
rainfallininThuan
ThuanChau
Chaudistrict:
district:(a)(a)Forecast
Forecast
rainfall
rainfallmap,
map,(b)
(b)flash-flood
flash-floodrisk
risk map and (c)
map and (c) early
earlyflash-flood
flash-floodforecast
forecastmap
mapbyby
thethe forecast
forecast rainfall,
rainfall, with
with a flash flood generation threshold of 150 mm/d
a flash flood generation threshold of 150 mm/d [13]. [13].
4.6. Structure of Flash Flood Warning System
The rainfall forecast information processing for each iMETOS weather station system [10,25,26]
and integration with risk maps for flash flood early warning is done by webGIS. Accordingly,
information is transferred to the website to provide flash flood warning information to users
[15,16,22]. The generalized model and key features of the system are shown in Figure 8; this figure
shows the completed resolutions for an early warning system for that study site. Input data, such as
daily weather data (daily rainfall, daily temperature) and management documents, together with the
hardware, have been analyzed, accessed, stored and displayed by disaster-management software.
Using webGIS tools, information that is very useful for the decision will be displayed on the user
interface. The residents can receive early-warning alerts via SMS message, streaming video and as
electronic documents.
Figure 8. Generalized model and key features of flash flood warning software.
The software was developed using the open source programming language Python, Personal
Figure 8. Generalized model and key features of flash flood warning software.
Home Page (PHP) and the PostgreSQL/PostGIS database [27]. The software was simply organized
using the key functions: Environmental Systems Research Institute (ESRI)-standardized databaseISPRS Int. J. Geo-Inf. 2019, 8, 228 12 of 14
management, spatial interpolation of rainfall and integration of information layers to formulate a flash
flood forecast map and the map was exported in the form of data and metrics. From the software,
information is transferred to the website to provide information online and export messages to users.
5. Conclusions
With a shortage of or limited survey data, the application of GIS with the approach of accessing
basins facilitates the formulation of a flash flood risk map for mountainous areas.
Figure
In natural disaster 8. Generalized model
management, a flashand keywarning
flood features ofsystem
flash flood
[28]warning
can besoftware.
a single integrated piece of
software or can also include software and webpages operating in different phases (Figure 9a,b). However,
they should meet three basic functions: quick processing of forecast rainfall data, rapid provision
and communication about possible locations of disasters for concerned people in message form.
The development of an early-warning system should follow both technology and application
directions [29,30]. At present, the model has been tested and aligned to produce forecasts close
to reality.
ISPRS Int. J. Geo-Inf. 2019, 8 FOR PEER REVIEW (a) 12
(b)
Figure
Figure 9. Main
9. Main interfaceofofthe
interface thesoftware
software (a)
(a)and
andthe
therisk-warning website
risk-warning (b). (b).
website
5. Conclusions
With a shortage of or limited survey data, the application of GIS with the approach of accessing
basins facilitates the formulation of a flash flood risk map for mountainous areas.
In natural disaster management, a flash flood warning system [28] can be a single integrated
piece of software or can also include software and webpages operating in different phases (Figure 9a,
9b). However, they should meet three basic functions: quick processing of forecast rainfall data, rapidISPRS Int. J. Geo-Inf. 2019, 8, 228 13 of 14
In this study, the basin parameters were processed using the MCA model, through which the entire
basin area was evaluated by pixel and the results map is shown in detail, meeting the requirements of
the district-level research scale and commune-level scale. The accuracy of theory is 0.86, which indicates
that the accuracy is relatively good. The iMETOS automatic meteorological station system and webGIS
are useful in decision-making regarding early warning flood alerts.
The system has been adopted for early warnings of flash floods in Thuan Chau district for disaster
management in Son La Province. The research results have been transferred to the district and can
possibly be expanded to other districts in northern mountainous area of Vietnam.
Author Contributions: Conceptualization, Ngoc Thach Nguyen and Tien Yin Chou; Data curation, Mei Ling Yeh
and Quoc Huy Nguyen; Formal analysis, Yao Min Fang and Quoc Huy Nguyen; Funding acquisition, Tien Yin
Chou, Yao Min Fang, Mei Ling Yeh and Thanh Van Hoang; Investigation, Thanh Van Hoang, Ngoc Thach Nguyen
and Tien Yin Chou; Methodology, Ngoc Thach Nguyen and Mei Ling Yeh; Project administration, Ngoc Thach
Nguyen; Resources, Ngoc Thach Nguyen and Xuan Linh Nguyen; Software, Yao Min Fang, Quoc Huy Nguyen
and Xuan Linh Nguyen; Supervision, Tien Yin Chou and Yao Min Fang; Validation, Ngoc Thach Nguyen and Tien
Yin Chou; Visualization, Quoc Huy Nguyen and Xuan Linh Nguyen; Writing – original draft, Thanh Van Hoang
and Quoc Huy Nguyen; Writing—review and editing, Tien Yin Chou and Thanh Van Hoang.
Funding: This research received no external funding.
Acknowledgments: This article is the result of a state-level project titled “Research on modeling and system
of sub-regional weather forecasting and warning of flood, forest fire and agricultural pests at district level in
the North West Vietnam”, Code: KHCN-TB.13C/13 -18 and has been financed by National Program for Tay Bac,
VNU Hanoi, Viet Nam; supervised and assisted by Geographic Information Systems Research Center, Feng Chia
University, Taiwan.
Conflicts of Interest: The authors declare no conflict of interest.
References
1. Matkan, A.; Shakiba, A.; Pourali, H.; Azari, H. Flood early warning with integration of hydrologic and
hydraulic models, RS and GIS (Case Study: Madarsoo Basin, Iran). World Appl. Sci. J. 2009, 6, 1698–1704.
2. EU Associated Programme on Flood Management (APFM). Guidance on Flash Flood Management, Recent
Experiences from Central and Eastern Europe; APFM: San Diego, CA, USA, 2007.
3. Forestieri, A.; Caracciolo, D.; Arnone, E.; Noto, L.V. Derivation of rainfall thresholds for flash flood warning
in a Sicilian basin using a hydrological model. In Proceedings of the 12th International Conference on
Hydroinformatics, Sondgo Convensia, Incheon, Korea, 21–26 August 2016.
4. Zogg, J.; Deitsch, K. The Flash Flood Potential Index at WFO Des Moines; National Oceanic and Atmospheric
Administration: Silver Spring, MD, USA, 2013.
5. Hoedjes, J.C.; Kooiman, A.; Maathuis, B.H.; Said, M.Y.; Becht, R.; Limo, A.; Mumo, M.; Nduhiu-Mathenge, J.;
Shaka, A.; Su, B. A conceptual flash flood early warning system for Africa, based on terrestrial microwave
links and flash flood guidance. ISPRS Int. J. Geo-Inf. 2014, 3, 584–598. [CrossRef]
6. Jubach, R.; Tokar, A.S. International severe weather and flash Flood hazard early warning
systems—Leveraging coordination, cooperation and partnerships through a hydrometeorological project in
Southern Africa. Water 2016, 8, 258. [CrossRef]
7. Challawala, S. MySQL 8 for Big Data; Packt Publishing: Birmingham, UK, 2017.
8. Website of Agriculture Weather in Vietnam. Available online: http://www.thoitietnhanong.vn (accessed on
15 January 2019).
9. Wang, Y.; Liu, R.; Guo, L.; Tian, J.; Zhang, X.; Ding, L.; Wang, C.; Shang, Y. Forecasting and providing
warnings of flash floods for ungauged mountainous areas based on a distributed hydrological model. Water
2017, 9, 776. [CrossRef]
10. World Meteorological Organization. Flash Flood Guidance System; World Meteorological Organization:
Geneva, Switzerland, 2007.
11. Jie, Y.; Ronald, D.T.; Bahram, D. Applying the HEC-RAS model and GIS techniques in river network
floodplain delineation. Can. J. Civ. Eng. 2006, 33, 19–28.
12. Mehmet, C.D.; Anabela, V.; Ercan, K. Flow forecast by SWAT model and ANN in Pracana basin, Portugal.
Adv. Eng. Softw. 2009, 40, 467–473.
13. Du, C.D.; Huynh, L. Flash Floods, Cause and Prevention Solutions; Agriculture Publisher: Wallingford, UK, 2000.ISPRS Int. J. Geo-Inf. 2019, 8, 228 14 of 14
14. Ministry of Land, Infrastructure and Transport Infrastructure Development Institute. Guideline for Development
of Warning and Evacuation System against Sediment Disasters in Developing Countries; Ministry of Land,
Infrastructure and Transport Infrastructure Development Institute: Tsukuba, Japan, 2014; p. 102.
15. Zhou, J.; Wang, Y.; Liu, Y. A review of an early-warning technique of flash flood and debris flow disaster.
In Proceedings of the ISCO 2004—13th International Soil Conservation Organization Conference, Brisbane,
Australia, 4–8 July 2004.
16. Website of Vietnam National Centre for Hydro-Meteorological Forecasting. Available online: https:
//www.meteoblue.com/en/weather/forecast (accessed on 20 February 2019).
17. Website of GENERAL STATISTICS OFFICE, VIET NAM (29). Available online: https://www.gso.gov.vn
(accessed on 10 March 2019).
18. Jirapon, S.; Chaiwat, O. Real-time flood monitoring and warning system. J. Sci. Technol. 2011, 33, 227–235.
19. Website of Tay Bac Weather. Available online: http://www.thoitiethuyentaybac.com.vn (accessed on 10 March
2019).
20. Thach, N.N.; van Kham, D. Applied Geo-Informatics; Publisher of Science and Technology: Hanoi, Vietnam,
2012; pp. 67–83.
21. Saaty, T.L. The Analytic Hierarchy Process; McGraw-Hill: New York, NY, USA, 1980.
22. Stanislaw, H.; Todorov, N. Calculation of signal detection theory measures. Behav. Res. Methods Instrum.
Comput. 1999, 31, 137–149. [CrossRef] [PubMed]
23. Van, N.K.; Thach, N.N. Building Analysis Database for Tay Bac Region; Science Techology to Sustainable
Development for North-West Vietnam: Hanoi, Vietnam, 2015; pp. 2013–2018.
24. Schonhoff, T.A.; Giordano, A.A. Detection and Estimation Theory and Its Applications; Pearson Education:
Pearson, NJ, USA, 2006; ISBN 0-13-089499-0.
25. Kim, E.S.; Choi, H. Estimation of the relative severity of floods in small ungauged catchments for preliminary
observations on flash flood preparedness: A Case Study in Korea. Int. J. Environ. Res. Public Health 2012, 9,
1507–1522. [CrossRef] [PubMed]
26. Joko, W. Flood early warning system develop at Garang River Semarang using information technology base
on SMS and Web. Int. J. Geomat. Geosci. 2010, 1, 14–28.
27. Ngu, N.D.; Hieu, N.T. Climate and Climate Resources Vietnam; Publisher of Science and Technology: Hanoi,
Vietnam, 2013.
28. Yali, W.; Ronghua, L.; Liang, G.; Jiyang, T.; Xiaolei, Z.; Liuqian, D.; Chuanhai, W.; Yizi, S. Forecasting and
providing warnings of flash floods for ungauged mountainous areas based on a distributed hydrological
model. Water 2017, 9, 776. [CrossRef]
29. Brewster, J. Development of the Flash Flood Potential Index. Available online: http://www.erh.noaa.gov/bgm/
research/ERFFW/presentations/june_02_2010/Brewster_Jim_Development_of_FFPI (accessed on 20 February 2019).
30. Vietnam Institute for Building Science and Techlogy, Ministry of Construction. QCXDVN 02: 2008/BXD,
Vietnam Construction Standard; Vietnam Institute for Building Science and Techlogy, Ministry of Construction:
Hà Nội, Vietnam, 2008.
© 2019 by the authors. Licensee MDPI, Basel, Switzerland. This article is an open access
article distributed under the terms and conditions of the Creative Commons Attribution
(CC BY) license (http://creativecommons.org/licenses/by/4.0/).You can also read