The Trend in the Risk of Flash Flood Hazards with Regional Development in the Guanshan River Basin, China - MDPI
←
→
Page content transcription
If your browser does not render page correctly, please read the page content below
water
Article
The Trend in the Risk of Flash Flood Hazards with
Regional Development in the Guanshan River
Basin, China
Ningyue Chen , Yanjun Zhang * , Jinjin Wu, Wenxun Dong , Yixuan Zou and Xin Xu
 State Key Laboratory of Water Resources and Hydropower Engineering Science, Wuhan University,
 Wuhan 430072, China; chenningyue@whu.edu.cn (N.C.); wujinjin@whu.edu.cn (J.W.);
 dongwenxun@whu.edu.cn (W.D.); zouyixuan@whu.edu.cn (Y.Z.); xuxin0225@whu.edu.cn (X.X.)
 * Correspondence: zhangyj1015@whu.edu.cn

 Received: 16 May 2020; Accepted: 22 June 2020; Published: 24 June 2020

 Abstract: The economic development of China’s mountainous areas has been rapid, but the impact
 of flash floods is often ignored during regional development planning. Therefore, a method needed
 to be developed to simulate flash flood disasters and analyze the trends in flash flood disasters with
 regional development. Taking Guanshan River Basin as the research area, we combined the digital
 elevation model (DEM) with the inflow hydrograph, using the topography-based hydrological model
 (TOPMODEL). Verified by historical flash flood disasters, the watershed model was built based on the
 finite volume conservation flood routing model (FLO-2D). Then, we simulated the hazard distribution
 of flash flood disasters, developed a risk status assessment factor (RSAF) for flash flood disasters and
 calculated the increased ratio from 2003 to 2018. The results show that in 2003, the total hazard area
 of flash flood disasters affecting human settlements was 61,121 m2 , which increased to 118,404 m2
 in 2018. Since 2003, with the development of the regional economy, more residents moved to risk
 and extreme risk zones; thus, the risk of flash flood disasters also increased. Due to the significant
 damage caused by the flash flood on 5 August 2012, some of the local residents moved away from the
 high risk and extreme risk zones, indicating that the risk trend of flash flood hazard was consistent
 with the regional development of Guanshan River. We provide suggestions for regional economic
 development planning; the risk assessment for flash flood disasters must be considered to ensure the
 stable development of the regional economy, and using the RSAF would be efficient.

 Keywords: Guanshan River; flash flood; FLO-2D; hazard distribution; regional development

1. Introduction
     Flash floods have serious social and economic impacts and destroy people’s lives, houses,
and social networks [1]. Generally, floodable areas are near rivers, which are often water resources for
domestic, agricultural, and industrial purposes, such as the Nile River Basin [2]. Therefore, humans
often live in floodable areas due to the better living condition. However, once flood disasters occur,
huge losses ensue. For example, in late September 2000, a devastating flood struck Gangetic West
Bengal, India, having severe impacts on rural settlements [3]. In September 2002, a storm triggered a
series of flash floods on the Gard River in the south of France [4].
     To mitigate the risk of flash flood disasters as much as possible, scholars around the world have
conducted a series of studies. Špitalar et al. [5] selected 12 of the largest flash floods in the conterminous
United States, to conduct an integrated analysis of temporal and spatial flash flood parameters and
human impacts, and found that in flash flood events, humans are mostly impacted by short flood
durations, small catchment sizes in rural areas, vehicles, and nocturnal events with low visibility.

Water 2020, 12, 1815; doi:10.3390/w12061815                                        www.mdpi.com/journal/water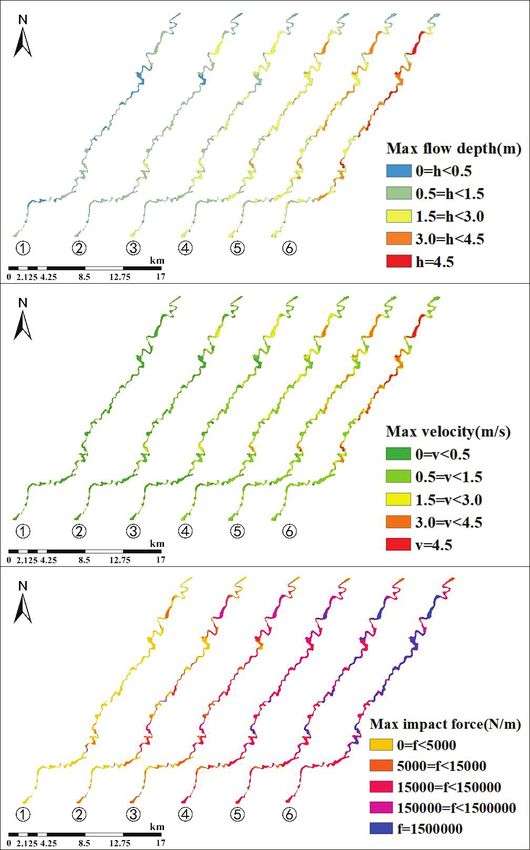
Water 2020, 12, 1815                                                                                 2 of 19

To better understand the mechanism of storm-induced flash floods, Ruin et al. [6] first attempted
to combine an analysis of the physical and human response to Mediterranean storms, and found
that coherence between the time and location of the reported fatalities and the hydrometeorological
conditions is strong. Through the analysis of flood disasters, Jiang et al. [7] found that before the
mid-1980s, the flash flood disasters in Xinjiang, China, were mainly caused by local human activities;
after the mid-1980s, they were mainly caused by abnormal precipitation. These studies provide
theoretical support for avoiding flash flood risks.
      With regional development in hilly areas, human activities have become more concentrated,
and the distribution of towns and major construction projects in river valleys has become denser.
Densely populated areas, the locations of economically dense areas, and flood hazard areas often
coincide, exacerbating the potential damage of flash flood disasters [8]. Because flash flood disasters
are closely related to human activities, most scholars consider population distribution factors in the
risk distribution of flash flood disasters. Forkuo [9] demonstrated the use of a geographic information
system (GIS) technique with different data related to land use and population densities to develop a
hydrological model which depicts a flood hazard index map, in which hazard indices are assigned for
population density, proximity, and frequency of flood inundation, over a period that informed the
authorities about resource allocation, evacuation practices, and other mitigation options to adopt in
the event of a flood. Therefore, the risk of flash flood disaster must be analyzed in combination with
human-related data, such as population, houses, and field changes.
      Given human activities, the risk trend of flash flood hazards must be considered in regional
development planning of mountain areas. Garrote et al. [10] reported the results obtained from the
application of different magnitude-damage functions in a small mountain town and estimated the
direct economic losses caused by the occurrence of flash floods with different return periods. Vojtek and
Vojteková [11] combined hazard maps with the current and planned urbanization extent and made a
decision about the accepted level of risk. These studies showed that the risk of flood disasters must
be considered in regional economic development planning. However, studying the effect of regional
flood disasters in time series is difficult. If a factor could be introduced to intuitively assess the risk
status of flash flood disasters with the regional development in different years, the risk trend of flash
floods could be obtained, which would help guide people to avoid risks and reduce economic losses,
which would be helpful for the long-term development of the regional economy.
      Based on historical flood disasters, we used a topography-based hydrological model (TOPMODEL)
to simulate the inflow hydrograph, combined with digital elevation model (DEM) to develop a
watershed model based on finite volume conservation flood routing model (FLO-2D). With this method,
we simulated flood disasters with different frequencies and analyzed flood intensity to map the hazard
distribution of flash flood disasters considering human settlements. To further evaluate the risk status
of flash flood disasters and determine the relationship between flash flood disasters and regional
development in the Guanshan River Basin, we developed the risk status assessment factor (RSAF) for
flash flood disasters and compared the risk status of flash flood disasters in 2003, 2013, and 2018, by
calculating the increased ratios, providing suggestions for regional economic development planning.

2. Study Area and Data

2.1. Study Area
     We selected the Guanshan River Basin, the tributary of the Danjiangkou Reservoir, as the research
area. The average slope of the main stream of the Guanshan River is 5.7%, the drainage area is 465 km2 ,
and the average annual flow is 7.78 m3 /s. The length of the river is 14.2 km, and the river network
density is about 0.84 km/km2 . The average annual precipitation is 1100 mm. The terrain is dominated
by hills and small to medium-sized rolling hills. The elevation is 153–1634 m above sea level (a.s.l.) and
the average elevation is 690 m a.s.l. [12] The location of the Guanshan River Basin is shown in Figure 1.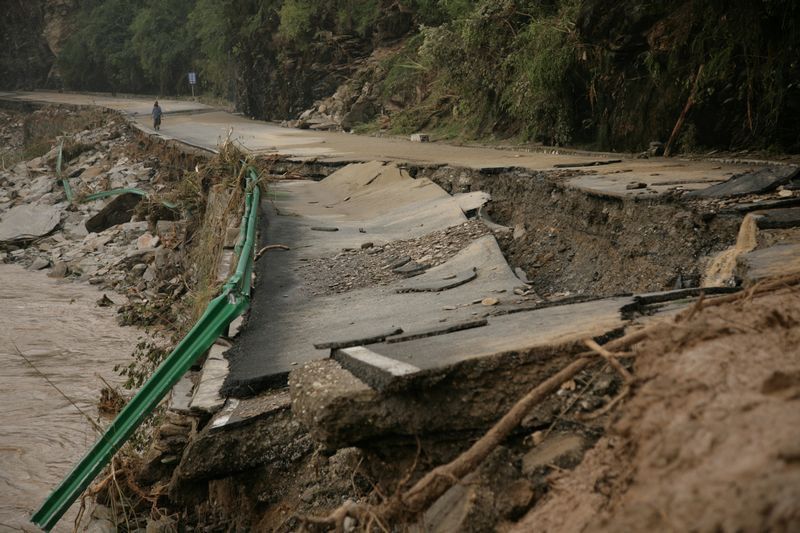
Water 2020, 12, 1815 3 of 20
Water 2020, 12, 1815 3 of 19
Water 2020, 12, 1815 3 of 20
Figure 1. Location of Guanshan River Basin and hazard distribution of the catastrophic flash flood
disaster on 5 August 2012.
Figure
Figure 1.
1. Location
Location of
of Guanshan
Guanshan River
River Basin
Basin and
and hazard
hazard distribution
distribution of
of the
the catastrophic
catastrophic flash
flash flood
flood
disaster
The on
on 55 August
Guanshan
disaster 2012.
River
August Basin, located in a rainy area in the Hubei and Henan provinces, is an area
2012.
with high-incidence local rainstorms. Historically, the area has experienced two disastrous flood
TheinGuanshan
events, 1935 and 1975.RiverTheBasin,
arealocated in
in aa rainy
also frequently area
area inin the
rainyexperiences the Hubei
Hubei
the flashand
and Henan
Henan
flood, provinces,
and is
provinces,
mudslide is an
an area
area
landslide
with high-incidence
high-incidence
disasters. local
On 5 August 2012, rainstorms.
rainstorms. Historically,
a severe flood Historically, the
disaster the area has
area has
occurred experienced
thatexperienced
caused great two
two disastrous
disastrous
harm, flood
as shown in
events,
Figure 2. Because the maximum discharge occurred on 6 August 2012, it is also called and
in 1935
1935 and
and 1975.
1975. The
The area
area also
also frequently
frequently experiences
experiences the
the flash
flash flood,
flood, mudslide
mudslide and landslide
No. landslide
20120806
disasters.
disasters. On
On 55 August
August 2012,
2012, aa severe
severe flood
flood disaster
disaster occurred
occurred that
that caused
caused
flood. The Gushan Hydrological Station in Guanshan measured the rainfall as reaching 287 mm in 28 great
great harm,
harm, as
as shown
shown in
Figure 2.
h from 11:00 Because
Because the
p.m. the maximum
on maximum
August 4 to discharge
discharge occurred
3:00 a.m.occurred
on August on 6 August 2012, it is also called
on 6, resulting in flooding in the town. Three No. 20120806
flood. The
The Gushan Hydrological
Hydrological Station
Station
people died in this flash flood. All the power supply, in
in Guanshan
Guanshan measured
measured therainfall
the
transportation, rainfall asasreaching
reaching287
communication, 287mmmmin
and in2828h
water
h from
from 11:00
11:00 p.m.
p.m. on on
4 August
August to4 to
3:00 3:00
a.m. a.m.
on 6 on August
August, 6, resulting
resulting in in
flooding
supply to the 13 villages in Guanshan were interrupted, and the damage to the houses and farmland flooding
in the in the
town. town.
Three Three
people
people
was diedflash
died serious.
in this in this
More flash
flood.
than flood.
All50% ofAll
the power the power
supply,
houses supply,alltransportation,
andtransportation,
almost farmlandscommunication,
thecommunication, wereandflooded. and whole
water supply
The water
to the
supply
13 to
villages the
in 13 villages
Guanshan in Guanshan
were were
interrupted, interrupted,
and the damage and the
to the
department of highway management in Shifang was destroyed. The disaster, which affected 13damage
houses to the
and houses
farmland and
wasfarmland
serious.
was
Moreserious.
than
villages, 50%More
resulted in than
of houses 50%
threeand of houses
almost
casualties, all
and and
thedirect almost
farmlands all flooded.
were
economic the
lossesfarmlands
of The
up to were
whole
more flooded.
department
than RMBThe
of whole
23highway
million
department
$3.22 of
management
(about inhighway
Shifang
million) management
[13].was destroyed. in The
Shifang was which
disaster, destroyed.
affected The13 disaster,
villages,which affected
resulted in three13
villages,
casualties, resulted in three
and direct casualties,
economic lossesandof up direct economic
to more than RMB losses 23ofmillion
up to more
(aboutthan $3.22RMB 23 million
million) [13].
(about $3.22 million) [13].
Figure 2.
Figure Severe flash
2. Severe flash flood
flood disaster
disaster in
in the
the Guanshan
Guanshan River
River Basin
Basin on
on 55 August
August 2012
2012 [14].
[14].
Figure 2. Severe flash flood disaster in the Guanshan River Basin on 5 August 2012 [14].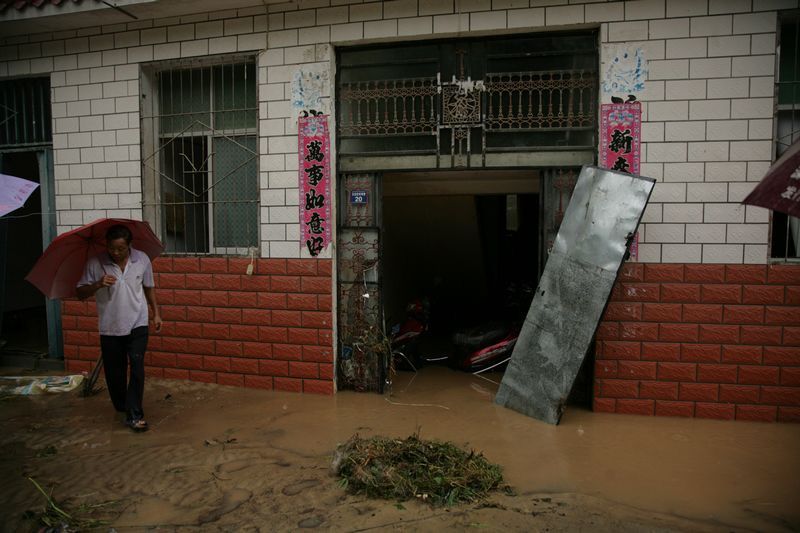
Water 2020, 12, 1815                                                                                              4 of 19

     As the flash flood disaster that happened on 5 August 2012 was the most severe flood in recent
years, a field survey in the Guanshan River Basin was conducted. The investigation revealed seven
representative accident points, which mainly included the loss of submerged houses and casualties.
The geographic locations are shown as Points 1 to 7 in Figure 1. The disaster situation, measured
maximum flow depth, and disaster degree of seven accident points are described in Table 1.

                       Table 1. Investigation results of flash flood disaster on 5 August 2012.

                             Measured Max Low
     Accident Positions                                        Disaster Situation                 Disaster Degree
                                Depth (m)
              1                      4.94             House flooded about 6 m; two deaths          Extreme Risk
                                                     A department of highway management
              2                      5.09                                                          Extreme Risk
                                                           was destroyed; one death
              3                      3.55             Water submerged to the bridge arch            High Risk
              4                      4.35                 House flooded about 1.2 m                Extreme Risk
              5                      4.06                 House flooded about 0.8 m                Extreme Risk
              6                      5.38                       House flooded                      Extreme Risk
              7                      1.27                       House flooded                          Risk

2.2. Data
     We obtained hydrological data, including discharge data and rainfall data. The discharge data of
the Guanshan River Basin were collected from the Gushan Hydrological Station, which was built in
1973. We obtained 22 years of measured discharge data from 1973 to 1987 and 2009 to 2015, including
daily and some hourly discharge data. The rainfall data of Guanshan River Basin were obtained from
Gushan Hydrological Station and three weather stations, Dama Station, Xi Station, and Yuanjiahe
Station, including daily, some hourly, and minute rainfall data from 1973 to 1987 and 2009 to 2015.
     The terrain data used in this study were mainly obtained from data recorded by a drone. The type
of the used drone was a DJI Phantom 4 Pro (SZ DJI Technology Co., Ltd., Shenzhen, Guangdong
province, China). The photos taken by the drone were processed by Agisoft PhotoScan software
(Agisoft LLC, St. Petersburg, Russia), and the DEM data of Guanshan River Basin were obtained
using inverse distance weighted interpolation, with a resolution of 0.1 m. The main process for
obtaining DEM data included adding chunk and photos into chunk, aligning photos, optimizing
cameras, building a dense cloud, meshes, texture, tiled model, and DEM, and then exporting DEM [15].
In this study, due to the large area of the Guanshan River Basin, a DEM with a resolution of 10 m
was selected for better simulation. Using an inverse distance weighted interpolation, a DEM with a
resolution of 10 m was obtained. The average error of 10 m DEM is 0.24 m.
     Population census data from 2003 to 2018 in Guanshan town were obtained from the China
Statistical Yearbook (Township) [16]. The distribution of houses and fields were obtained through
Google Earth (Google, Mountain View, CA, USA).

3. Methods
     To assess the risk status of flash flood disasters, firstly, a hydrological model was used to generate
the inflow hydrograph of designed flood. Secondly, to simulate maximum flow depth, velocity,
and impact force, a suitable hydrodynamic model was chosen. In this study, TOPMODEL and FLO-2D
were used for hydrological and hydrodynamic simulations, respectively. Based on the results of
the simulations, the flood intensity was calculated. Thirdly, in combination with the selected flood
frequency, the hazard level was calculated. Fourthly, according to the human settlements in different
years, the hazard map of flash flood disasters in human settlements was obtained. Finally, the statistics
of the area of different hazard levels were calculated, and the proposed RSAF and increased ratio were
used to assess risk status of flash flood disasters in different years. The methodological flowchart is
shown in Figure 3.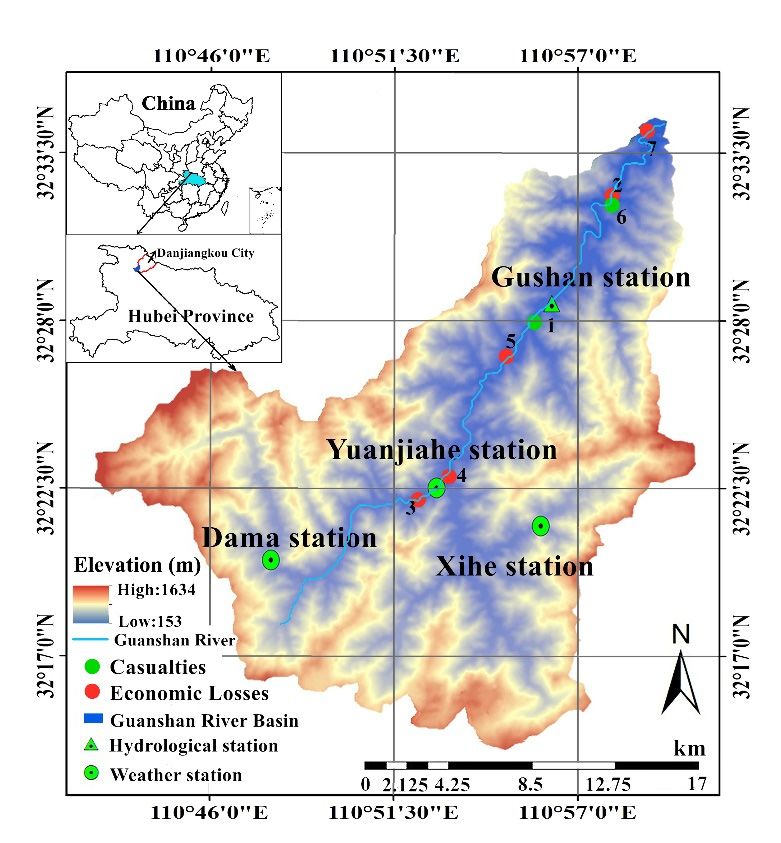
Water 2020, 12, 1815 5 of 20
RSAF2020,
Water and12,increased
1815 ratio were used to assess risk status of flash flood disasters in different years.
5 of 19
The methodological flowchart is shown in Figure 3.
Figure 3.
Figure 3. Methodological
Methodological flowchart.
flowchart.
3.1. TOPMODEL
3.1. TOPMODEL
The topography-based hydrological
hydrological model
model(TOPMODEL)
(TOPMODEL)was wasoriginally
originallydesigned
designedtotoprovide
providea
aphysically
physicallyrealistic
realistic rainfall runoff model, with simple parameters that can predict
rainfall runoff model, with simple parameters that can predict different types different typesof
of hydrological
hydrological responses
responses [17].
[17]. Considering
Considering thethe
ideaidea proposed
proposed byby Kirkby
Kirkby [18],
[18], thethe distributed
distributed nature
nature of
of catchment responses in the original model could be indexed based on an
catchment responses in the original model could be indexed based on an analysis of topography. analysis of topography.
Through
Throughpreliminary
preliminaryresearch
researchinin Guanshan
Guanshan River Basin,
River TOPMODEL
Basin, TOPMODEL appeared to beto
appeared suitable for flood
be suitable for
simulation in mountainous
flood simulation areas [12].
in mountainous areasTOPMODEL
[12]. TOPMODEL is characterized by a simple
is characterized by adesign,
simpleclear concept,
design, clear
and simplified
concept, parameters,
and simplified providing aproviding
parameters, model between
a model distributed
between and centralized
distributed andhydrological
centralized
models. The core
hydrological of TOPMODEL
models. The core ofisTOPMODEL
the topographic index,
is the which is index,
topographic used towhich
reflectisthe distribution
used to reflect law
the
of inner diameter flow in the basin [19].
distribution law of inner diameter flow in the basin [19].
The discharge distribution at each grid in the study study area was was obtained
obtained using
using TOPMODEL
TOPMODEL
simulation. Using
UsingTOPMODEL
TOPMODELtotosimulatesimulatethe theNo.No.20120806
20120806 flood,
flood, thethe discharge
discharge distribution
distribution at
at the
the intersection of tributary and main stream was determined, which
intersection of tributary and main stream was determined, which was used to obtain was used to obtain the inflow
hydrograph of of aadesigned
designedfloodfloodatat
thethe intersection
intersection of aoftributary
a tributary
and and
mainmain
streamstream required
required for
for FLO-
FLO-2D simulation.
2D simulation.
3.2. FLO-2D Model
3.2. FLO-2D Model
The
The FLO-2D
FLO-2D model
model is
is aa product
product of
of FLO-2D
FLO-2D Software
Software Inc. (FLO-2D Software,
Inc. (FLO-2D Software, Inc.,
Inc., Nutrioso,
Nutrioso, AZ,
AZ,
USA). It is a finite volume conservation flood routing model that includes the continuity
USA). It is a finite volume conservation flood routing model that includes the continuity equation equation and
the
andmomentum
the momentum equation, and isand
equation, a valuable tool fortool
is a valuable delineating flood hazards.
for delineating In FLO-2D,
flood hazards. channel
In FLO-2D,
flow is one-dimensional, with the channel geometry represented by either natural, rectangular, or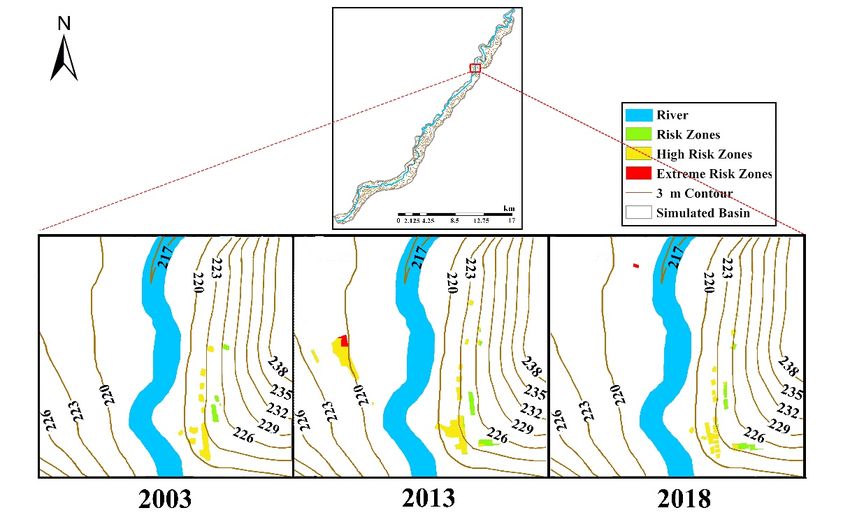
Water 2020, 12, 1815                                                                                6 of 19

trapezoidal cross sections. Overland flow is modeled two-dimensionally as either sheet flow or flow in
multiple channels [20].
     The FLO-2D model is often used to simulate and analyze disasters, such as mudslides and
landslides caused by flash floods. Hubl et al. [21] used the FLO-2D model to simulate two typical
viscous debris flows and showed that the results simulated by the FLO-2D model were good enough,
which proved that the FLO-2D model can be applied to simulate debris flows. Boniello et al. [22]
proved that FLO-2D is a useful instrument for simulating debris flow. It charts the possible inundated
areas, which is useful for local authorities to complete territorial planning to define the hazardous
portions of the territory.
     In this study, the inflow hydrograph and DEM were used as the inlet boundary condition for
FLO-2D. Since the main stream of the Guanshan River was simulated, the discharge distribution
at the intersection of a tributary and the main stream was obtained using TOPMODEL simulation.
After completing the flood estimation, the inflow hydrographs of designed flood at the intersection of a
tributary and the mainstream were input into FLO-2D. Then, the evaluation indexes of mountain flood
disasters, such as maximum flow depth, velocity, and impact force, were simulated based on FLO-2D.

3.3. Risk Assessment Method for Flash Flood Disasters
      Various methods are available for assessing the risk of flash flood disasters, such as publishing
risk index or classifying hazard zones. Zonensein et al. [23] introduced the flood risk index (FRI),
which provides the probability of occurrence of an event and the impacts of a flood, demonstrating
that the methodology is a valuable planning tool for decision makers. Nasiri et al. [24] introduced
a flood vulnerability index (FVI) as a tool for flood risk management that represents areas that are
most vulnerable to flooding and require urgent attention. Hazard degree can be evaluated using
characteristic values, such as water depth, velocity, and so on. Vojtek and Vojteková [11] used water
depth and velocity to confirm hazard degree, and found that the simulation results were consistent
with the actual disaster situation, indicating that the method is reliable for confirming the hazard
degree. Zhang et al. [25] considered that the water depth multiplied by the velocity is a better technique
to develop risk zone maps. In this study, a method of classifying hazard zones was used to assess the
risk of flash flood disasters.
      Flood risk is determined by frequency and intensity [26]. Flood intensity is defined by the flow
depth and velocity. Flood frequency is inversely related to flood magnitude. Large flood events occur
less frequently. Flood hazard level is then defined as a discrete combined function of the event intensity
and frequency (return period) [27]. In this study, the maximum water depth and maximum flow
velocity of each grid were simulated by FLO-2D, so the flood intensity is reported as the maximum
depth h and the maximum discharge per unit width q, which is the product of maximum depth h
and maximum velocity v [28]. According to the “Technical Requirements for Analysis and Evaluation
of Mountain Hazards” proposed by the National Flash flood Disaster Prevention Project Team of
China, the hazard zone level can be determined by the 5-, 20-, and 100-year return periods to confirm
hazard degree [29]. We referred to the measurement standard with those return periods to define the
flood frequency.
      For regional economic development, the distribution of human activities is most important,
including the distribution of population, houses, and fields. To evaluate the relationship between
regional development and flash flood disasters, we selected the distribution of population and houses
in the study areas in 2003, 2013, and 2018, and analyzed the distribution of hazard zones in the
Guanshan River Basin. To obtain accurate distributions of houses and fields, the locations of the study
area were determined from remote sensing images, using Google Earth (Google, Mountain view, CA,
USA) to confirm the hazard degree, so that the houses and fields could be framed.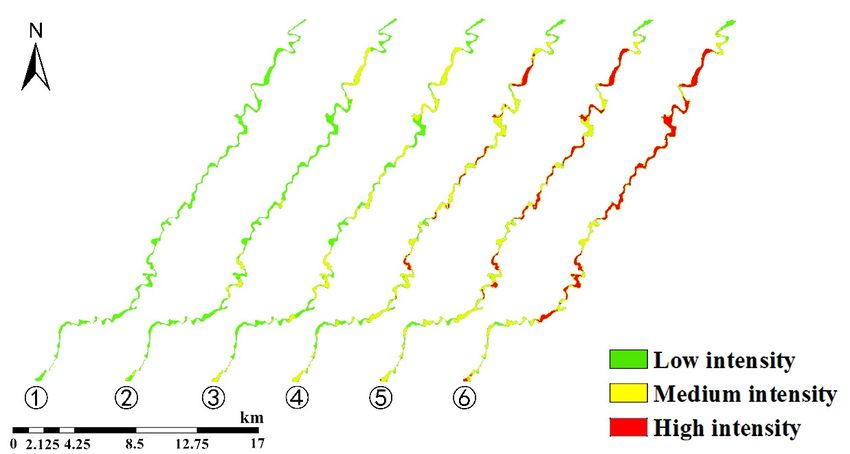
Water 2020, 12, 1815                                                                                7 of 19

      To further evaluate the risk status of flash flood disasters in the Guanshan River Basin, the RSAF
of flash flood disasters was developed, as shown in Equation (1):

                                              α×R+β×H+γ×E
                                    RSAF =                ,                                            (1)
                                                   TA
where R, H, and E represent areas with risk, high risk, and extreme risk, respectively; α, β, and γ
are the weights of R, H, and E, respectively; and TA represents the total area of the simulated basin.
According to the regulations on the prevention and control of geological hazards in China [30], the
level of flash flood disasters is evaluated based on the degree of economic loss, through which it can be
defined as extremely large-scale, large-scale, medium-scale, and small-scale disaster when the direct
economic loss is greater than 10 million RMB (about $1.40 million), 5 million RMB (about $0.70 million)
to 10 million RMB (about $1.40 million), 1 million RMB (about $0.14 million) to 5 million RMB (about
$0.70 million), and less than 1 million RMB (about $0.14 million), respectively. Therefore, the amounts
of economic loss, which are 1, 5, and 10 million yuan, can be taken as the threshold values. To express
the Equation (1) more concisely, the percentages of economic loss were used as the weight; that is, α, β,
and γ are taken as 1/16, 5/16, and 10/16, respectively.
     To compare the risk status of flash flood disasters more clearly, based on RSAF, the increased
ratios of different hazard level in different years were calculated, as shown in Equation (2):

                                                        a−b
                                    Increased Ratio =       × 100%,                                    (2)
                                                         b
where a represents the RSAF of the later period and b represents the RSAF of the early period.
For example, if the RSAF for different hazard levels in 2003 and 2013 are compared, a represents RSAF
in 2013 and b represents RSAF in 2003.

4. Results

4.1. Designed Flood Estimation
     To build the model, the annual peak discharge data were first obtained from the measured
discharge data. The historical survey period was from 1935 to 2018, including two catastrophic floods
and 22 years of measured discharge data, which were arranged from high to low. The unified approach
was used to calculate the frequency, and the empirical frequency of the annual peak discharge of the
Gushan station was calculated. The Pearson III distribution (P-III) curve was used for fitting [31].
According to the estimated fitting, the result was optimized by calculating the empirical data and the
least squares longitudinal deviation of the P-III curve obtained by the fitting, to obtain the frequency
curve of peak discharge of Gushan station, as shown in Figure 4a. The mean of the discharge (Ex) was
241.08 m3 /s, the coefficient of variation (Cv) was 1.85, and the coefficient of skewness (Cs) was 4.591.
     Through the curve, the peak discharges of flood with designed frequencies of 1%, 2%, 5%, 10%,
and 20% were obtained, which were divided by the peak discharge of the flood on 5 August 2012,
which was taken as a typical flood, allowing the magnification factor to be obtained, as shown in Table 2.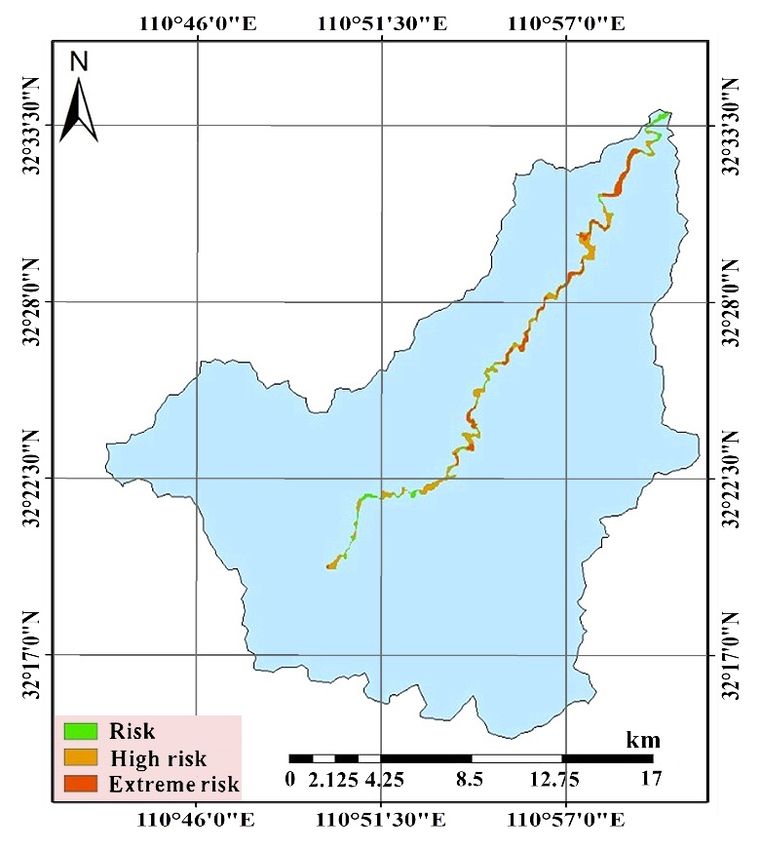
discharge of the Gushan station was calculated. The Pearson III distribution (P-III) curve was used
for fitting [31]. According to the estimated fitting, the result was optimized by calculating the
empirical data and the least squares longitudinal deviation of the P-III curve obtained by the fitting,
to obtain the frequency curve of peak discharge of Gushan station, as shown in Figure 4a. The mean
of the2020,
Water   discharge
            12, 1815 (Ex) was 241.08 m3/s, the coefficient of variation (Cv) was 1.85, and the coefficient  of
                                                                                                       8 of 19
skewness (Cs) was 4.591.

    Water 2020, 12, 1815                                                                                               8 of 20

         Through the curve, the peak discharges of flood with designed frequencies of 1%, 2%, 5%, 10%,
    and 20% were obtained, which were divided by the peak discharge of the flood on 5 August 2012,
    which was taken as a typical flood, allowing the magnification factor to be obtained, as shown in
     Figure2.4.4.Flood
    Table
     Figure       Floodestimation
                        estimationof of Guanshan
                                     Guanshan    River:
                                              River:      (a) frequency
                                                     (a) frequency  curvecurve of discharge
                                                                          of peak peak discharge  of Gushan
                                                                                            of Gushan Station
     Station
     in      in the Guanshan
        the Guanshan           River
                      River Basin; (b)Basin; (b) discharge
                                       discharge           hydrograph
                                                  hydrograph            of flood
                                                              of a typical  a typical
                                                                                 and flood  and theflood.
                                                                                      the designed  designed
     flood.      Table 2. Peak discharge of designed floods and magnification ratio for Gushan Station.
            Table 2. Peak discharge of designed floods and magnification ratio for Gushan Station.
         Peak Discharge of               Return Period of               Peak Discharge of                 Magnification
         Peak Discharge of 3          Return Period of   Peak Discharge of
        Typical  Flood (m /s)
        Typical Flood (m3 /s)
                                         Designed Flood Designed
                                      Designed Flood
                                                              Designed    Flood (m
                                                                 Flood (m3 /s)
                                                                                  3/s)
                                                                                Magnification     Factor
                                                                                              Factor
                                                5-year                           295.56                       0.123
                                           5-year                      295.56                     0.123
                                               10-year
                                          10-year                      633.92    633.92           0.263       0.263
         2410 (5
        2410  (5August
                 August2012)
                         2012)            20-year
                                               20-year                1061.40   1061.40           0.440       0.440
                                          50-year                     1712.70                     0.711
                                               50-year
                                          100-year                    2248.61
                                                                                1712.70           0.933
                                                                                                              0.711
                                               100-year                         2248.61                       0.933

     Because   the flood
         Because           datadata
                   the flood     of the
                                      of Guanshan
                                          the Guanshan River   Basin
                                                            River     are relatively
                                                                   Basin               complete
                                                                           are relatively         andand
                                                                                            complete    the flood    peakpeak
                                                                                                             the flood
and and
     volume   relationship
         volume   relationshipis strong,   the rates
                                   is strong,         of peak
                                               the rates        discharge
                                                           of peak           of the
                                                                     discharge    of designed   floods
                                                                                     the designed        withwith
                                                                                                     floods    different
                                                                                                                     different
designed  frequencies     were  calculated   and  used    to amplify   the discharge    hydrograph
    designed frequencies were calculated and used to amplify the discharge hydrograph of the designed  of  the designed
floods, as shown
    floods,        in Figure
             as shown           4b. 4b.
                         in Figure
     In this study,  the  data
         In this study, the datausedused
                                       to extract the topographic
                                            to extract  the topographic index   werewere
                                                                            index     obtained   fromfrom
                                                                                           obtained     the 10
                                                                                                             them10DEMm DEM
mentioned   above.  The   main   steps  for extracting   the topographic    index   through
    mentioned above. The main steps for extracting the topographic index through ArcGIS       ArcGIS   (Environmental
Systems  Research Institute,
    (Environmental       SystemsRedlands,
                                    Research CA,Institute,
                                                 USA) were      as follows:
                                                             Redlands,    CA,filling
                                                                                 USA)DEM,wereextracting  flow direction,
                                                                                                as follows:    filling DEM,
calculating  accumulation,    dividing    watershed,    and   extracting  slope.   The  frequency
    extracting flow direction, calculating accumulation, dividing watershed, and extracting slope.  distribution    of the The
topographic   index   in Guanshan      River  Basin  is shown    in Figure   5.
    frequency distribution of the topographic index in Guanshan River Basin is shown in Figure 5.

                            Figure 5. Frequency
                                Figure           distribution
                                        5. Frequency          of the
                                                      distribution oftopographic index.
                                                                      the topographic index.

         To use TOPMODEL for hydrological simulation, the accuracy was evaluated according to
    “Standard for hydrological information and hydrological forecasting” GB/T 22482-2008 [32]. The
    assessment indicators selected in this study included the Nash–Sutcliffe model efficiency coefficient
    (NSE), error of runoff volume, peak discharge error, and difference in time between simulated and
    observed peak occurrence. The genetic algorithm was used to optimize parameters in the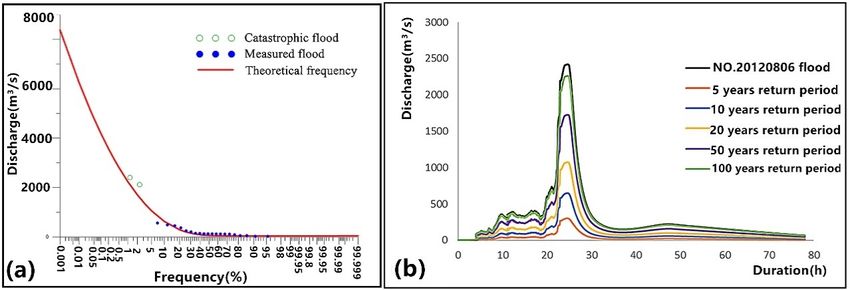
Water 2020, 12, 1815                                                                                              9 of 19

     To use TOPMODEL for hydrological simulation, the accuracy was evaluated according
to “Standard for hydrological information and hydrological forecasting” GB/T 22482-2008 [32].
The assessment indicators selected in this study included the Nash–Sutcliffe model efficiency coefficient
(NSE), error of runoff volume, peak discharge error, and difference in time between simulated and
observed peak occurrence. The genetic algorithm was used to optimize parameters in the TOPMODEL
calibration [33]. The calibration period was chosen from 2009 to 2013, while the validation period was
2014 to 2015. The results of the TOPMODEL calibration and validation are shown in Table 3.

      Table 3. Results of topography-based hydrological model (TOPMODEL) calibration and validation.

                                                                                Difference in Time
                                             Error of              Peak
                        Flood Number                                          between Simulated and
          Period                              Runoff             Discharge                                 NSE
                        (DDMMYYYY)                                                Observed Peak
                                            Volume (%)           Error (%)
                                                                                Occurrence (Hour)
                             19042009          17.42               20.00                0                  0.84
                             27052009          45.90               33.66                1                  0.30
                             08062010          44.77               41.35                0                  0.70
                             19072010          25.32               26.18                0                  0.77
                             02082010           1.98                2.39                1                  0.88
                             25082010          30.15               39.73                0                  0.71
        Calibration
                             06092010          36.12               15.22                0                  0.79
                             19092010          26.80               35.26                0                  0.83
                             10072012          32.89               49.98                0                  0.66
                             06082012          18.91               13.97                0                  0.93
                             21082012           1.64               26.18                0                  0.78
                             11092012          15.06               21.90                0                  0.50
         Average                               24.75               27.15               0.17                0.72
                              18092014         12.14                4.66                0                  0.98
                              28092014         15.79               21.80                1                  0.79
                             202102014         8.85                19.53                0                  0.92
        Validation
                              06042015         28.31                1.01                0                  0.53
                              09082015          4.58               13.04                0                  0.78
                              19082015         19.00               16.13                1                  0.94
         Average                               14.78               12.70               0.33                0.82

     The overall NSE of the validation was 0.84, and the NSE of the validation period was 0.80.
According to the results of the flood simulation and forecast in specific sessions, the results of
calibration and validation were sufficient. The model is suitable for risk assessment.
     In Table 4, T0 (m2 ·h−1 ) represents the lateral downslope transmissivity when the soil is just
saturated; td (h·m−1 ) represents a time delay constant that introduces longer residence times to cater
for deep water table levels; Srmax (m) represents the maximum root zone storage; Q1b (m·h−1 ) represents
the initial interflow in the basin; f 0 (mm·h−1 ) represents the initial infiltration capacity; fc (mm·h−1 )
represents the final infiltration capacity; k represents the decay constant; n represents Manning’s
roughness coefficient [34].

                                         Table 4. TOPMODEL parameters table.

            T0          td         Srmax       Q1b        Ks           f0       fc            k        n
           0.597       3.816       0.680      1.387      0.437       15.885    5.832        3.478     3.766

4.2. Flash Flood Disasters Simulation
     To establish the FLO-2D model, the DEM was imported into the FLO-2D numerical simulation
software. The grid resolution was 10 × 10 m. The watershed boundary of the imported shape format
was recognized as the calculated boundary. The elevation points of each grid were interpolated by at
least two adjacent elevations of imported DEM [20].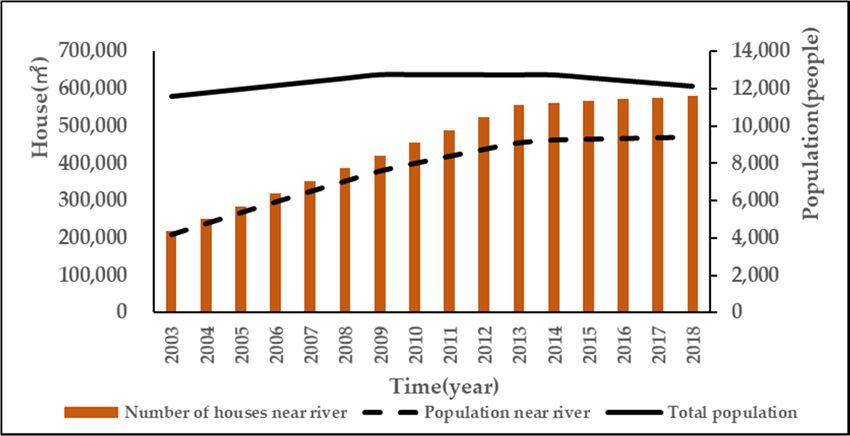
Water 2020, 12, 1815                                                                                        10 of 19

     According to the natural river roughness table [35], for small rivers in a mountainous area,
when there are pebbles and large orbs at the bottom of the river, the roughness ranges from 0.040
to 0.070. For the Courant number of a floodplain and the numerical stability parameter of surface
detention, according to the characteristics of the stream flood, they range from 0.3 to 0.7 and 0.0012
to 0.03, respectively [36]. Finally, by comparing the simulated results with the actual results, the
roughness was selected as 0.06. The Courant number of the floodplain was 0.6, and the numerical
stability parameter of surface detention was 0.03.
     The watershed model based on FLO-2D was used to simulate the measured flood on 5 August 2012,
and the disaster accident point was simulated, including the maximum flow depth, maximum velocity,
and maximum impact force, as shown in Table 5.

         Table 5. Comparison of disasters simulation results and actual situation of No. 20120806 flood.

                        Simulated       Simulated           Simulated       Measured Max
     Accident                                                                                   Percent Error
                       Max Velocity     Max Impact          Max Flow        Water Depth
     Positions                                                                                      (%)
                          (m/s)        Force (MN/m)         Depth (m)           (m)
          1                5.42              7.00              4.98               4.94               0.96
          2                5.36              6.33              5.06               5.09               0.59
          3                0.82              0.12              3.52               3.55               1.02
          4                4.61              3.25              4.41               4.35               1.29
          5                3.44              1.78              4.00               4.06               1.50
          6                6.19              8.65              5.46               5.38               1.48
          7                1.20              0.09              1.30               1.27               2.53

     From the comparison between the simulation results and measured max flow depth in Table 5, the
simulation results were found to be basically consistent with the actual results. The simulated max flow
depths were matched with actual accident situations, such as Positions 1, 2, 3, 4, and 6. We found that
the percent errors of the simulated and measured max flow depth were not greater than 3%. As shown
in Table 1, in the actual investigation in Position 3, the bridge was inundated. This is consistent with
the height of the bridge from the riverbed. In the actual investigation at Position 2, the department
of highway management was destroyed, and the simulated water velocity and impact force values
were larger than at other points, which is consistent with the disaster situation. Therefore, after the
parameter calibration, the watershed model based on FLO-2D was found to be accurate and reliable
and could be used to simulate flash flood disasters for Guanshan River.
     Based on the TOPMODEL and FLO-2D model, the designed flood disasters were calculated,
which are shown in Figure 6.
Water 2020, 12, 1815 11 of 19
Water 2020, 12, 1815 11 of 20
Figure 6. Simulation of No. 20120806 flood and designed floods (O– 1 O
6 indicate 5-, 10-, 20-, 50-, and
100-year
Figure 6.return periods
Simulation of and
No. No. 20120806
20120806 floodflood, respectively).
and designed floods (ƻ
1 –ƻ
6 indicate 5-, 10-, 20-, 50-, and
100-year return periods and No. 20120806 flood, respectively).
4.3. Hazard Map of Flash Flood Disasters
According
4.3. Hazard Maptoofthe Technical
Flash Requirements for Analysis and Evaluation of Mountain Flood Disasters,
Flood Disasters
China [29], considering the actual local situation, the maximum depth h and maximum discharge per
According to the Technical Requirements for Analysis and Evaluation of Mountain Flood
unit width q were used to define the flood intensity, as shown in Table 6.
Disasters, China [29], considering the actual local situation, the maximum depth h and maximum
discharge per unit width q were used to define the flood intensity, as shown in Table 6.Water 2020, 12, 1815 12 of 19
Water 2020, 12, 1815 12 of 20
Table 6.
Table Definition of
6. Definition of flood
flood intensity.
intensity.
Flood Flood
Flood Flood
MaximumMaximum
Depth h Depth Maximum
Maximum
Relationship Discharge Discharge
per Unit perWidth
Level Intensity h (m) Relationship Unit Width q (m 2 /s)
Level Intensity (m) q (m /s)
2
1 1Low Low 0 < h < 1 0m< h < 1 m And And 00flood frequencies, the hazard distribution of the Guanshan River was calculated. The hazard level
distribution was obtained from the calculation of the hazard distribution of the Guanshan River, and
then the area of each hazard level was analyzed. The results are shown in Table 8. The hazard
distribution map of Guanshan River was obtained, as shown in Figure 8.
Water 2020, 12, 1815 13 of 19
Table 8. Hazard distribution of Guanshan River.
Percentage of
Percentage
Table 8. Hazard distribution of Guanshan River. of the
Flood Return Period Area the Area of The
Hazard Level Frequency total Area of
(years)
Flood Return Area (km 2)
Percentage of the Simulated
Percentage of the Basin
Hazard Level Frequency Hazard
Total Area of Zones (%)Area of the
Period (Years) (km2 )
Hazard Zones (%)
(%)
Simulated Basin (%)
Risk 100 Low 1.72 25.99 10.52
Risk 100 Low 1.72 25.99 10.52
HighHigh
riskrisk 20 20 MediumMedium3.02 3.02 45.74 45.74 18.47 18.47
Extreme
Extreme risk risk 5 5 High High1.87 1.87 28.28 28.28 11.44 11.44
TotalTotal
areaarea
of of 16.35
simulated basin 16.35
simulated basin
Figure
Figure 8.
8. Distribution
Distribution of
of flash
flash flood
flood disasters
disasters in
in Guanshan
Guanshan River.
River.
Figure 8 shows that the hazard distribution of Guanshan River is dense along the river. river. The high
risk zones account for the highest proportion, which is 45.74%, mainly distributed in the middle and
upper reaches; followed by the extreme risk zones, accounting for 28.28%, mainly distributed in the
middle and lower reaches; the the risk
risk zones
zones accounting
accountingfor for25.99%,
25.99%,mainly
mainlydistributed
distributedin
inthe
theupstream.
upstream.
showsthat
This shows thatthe
therisks
risksare
aregreater
greater if people
if people livelive in the
in the middle
middle andand lower
lower reaches.
reaches. Therefore,
Therefore, we
we then
then further analyzed the hazard distribution in human
further analyzed the hazard distribution in human settlements. settlements.
4.4. Risk Status Assessment for Flash Flood Disaster
In the past few decades, China’s economy has developed quickly. According to census data,
the total population in the Guanshan Basin has fluctuated in the past few years, as shown in Figure 9.
The population along the Guanshan River first increased and then declined slightly. Figure 10 shows
that houses along the Guanshan River followed the same rule. In the Guanshan River Basin, over time
and with economic development, more people who originally lived in the mountains have migrated
near to the river to seek better living conditions.Water 2020, 12, 1815 14 of 20
In the past few decades, China′s economy has developed quickly. According to census data, the
total 4.4.
population
Risk StatusinAssessment
the Guanshan
for FlashBasin
Flood has fluctuated in the past few years, as shown in Figure 9.
Disaster
The population along the Guanshan River first increased and then declined slightly. Figure 10 shows
In the past few decades, China′s economy has developed quickly. According to census data, the
that houses along the Guanshan River followed the same rule. In the Guanshan River Basin, over
total population in the Guanshan Basin has fluctuated in the past few years, as shown in Figure 9.
time The
Water andpopulation
2020, with
12, 1815economic development,
along the Guanshan River more people who
first increased originally
and then lived
declined in the
slightly. mountains
Figure 10 shows14have
of 19
migrated near to the river to seek better living conditions.
that houses along the Guanshan River followed the same rule. In the Guanshan River Basin, over
time and with economic development, more people who originally lived in the mountains have
migrated near to the river to seek better living conditions.
Figure
Figure 9.
9. Distribution
FigureDistribution of
9. Distribution flood
of of
flood disasters
disastersin
disasters
flood inNo.
in No. 20120806
No. flood
20120806flood
20120806 flood and
and
and hazard
hazard
hazard map
map
map of
of human
human
of human settlements.
settlements.
settlements.
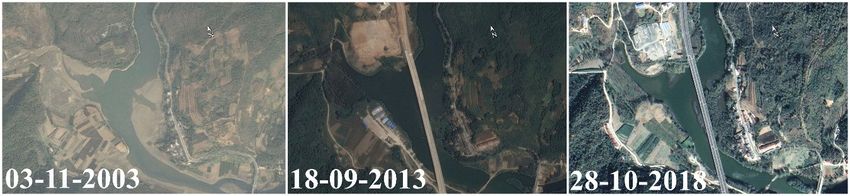
Figure
Figure 10. Changes
10. Changes in in housesalong
houses alongthetheGuanshan
Guanshan RiverRiverinin2003,
2003,2013, and
2013, 2018.
and (Images
2018. obtained
(Images obtained
Figure
from10.SPOT-5
Changes in houses
Satellite of along
Google the Guanshan River in 2003, 2013, and 2018. (Images obtained
Earth).
from SPOT-5 Satellite of Google Earth).
from SPOT-5 Satellite of Google Earth).
DueDue to the
to the closerelationship
close relationship between
betweenthe theflash
flashflood hazard
flood zoneszones
hazard and human
and humansettlements, we
settlements,
compared
Due to thetheclose
human settlementsbetween
relationship with flashtheflood hazard
flash floodzones on spatial
hazard zones and
andtemporal
human scales. Based we
settlements,
we compared the human settlements with flash flood hazard zones on spatial and temporal scales.
on the the
compared census
human data,settlements
by selecting satellite remote
withsatellite
flash floodsensing
hazard images
zones with better quality
on spatial for inversion, weBased
Based on the census data, by selecting remote sensing images with and
better temporal scales.
quality for inversion,
determined the population and house distribution in the Guanshan River Basin in 2003, 2013, and
on the
we census data,
determined the by selecting and
population satellite
house remote sensing images
distribution with betterRiver
quality for in
inversion, we
2018, and analyzed the distribution of hazard zones in thein the Guanshan
Guanshan River Basin. The Basin 2003,
distribution of 2013,
determined
and 2018, and the population and house distribution in the Guanshan River Basin in 2003, 2013, and
houses andanalyzed
fields were theobtained
distribution of hazard zones
by determining in the Guanshan
the location of the studyRiver
area Basin.
on remoteThesensing
distribution
2018, and
of houses analyzed
imagesand
the
fieldsGoogle
through
distribution
were obtained
Earth.
of hazard zones in the Guanshan River Basin.
by determining the location of the study area on remote sensing The distribution of
houses and
images through fields
According were
Google obtained by determining the location of the study
Earth. (1), the RSAF of flash flood disasters in 2003, 2013, and 2018 were
to Equation area on remote sensing
images throughas
calculated,
According toGoogle
shown
Equation Earth.
in Table 9. RSAF
(1), the To more clearly
of flash compare
flood the risk
disasters status2013,
in 2003, of flash
andflood
2018 disasters in
were calculated,
as shown in Table 9. To more clearly compare the risk status of flash flood disasters in 2003, 2013,were
According
2003, 2013, and to Equation
2018, (1),
according the
to theRSAF of
calculated flash
RSAF, flood
the disasters
increased in
ratios 2003,
of 2013,
different and
hazard 2018
levels and
calculated,
2013 as
andshown
2018,inaccording 2003,
to the2018in Table 9.RSAF,
and 2003,
calculated To more
and the clearly
2018 and 2013compare
increased were the riskasstatus
calculated,
ratios of different shown
hazardofinflash
Tableflood
levels 9. disasters
in 2013 in
and 2003,
2003, 2013,
2018 and andand
2003, 2018, according
2018 to were
and 2013 the calculated RSAF,
calculated, the increased
as shown ratios of different hazard levels
in Table 9.
in 2013 and 2003, 2018 and 2003, and 2018 and 2013 were calculated, as shown in Table 9.
Table 9. Hazard area of human settlements in Guanshan River.
Year Hazard Area (m2 ) RSAF Increased Ratio
2003 to 2003 to 2013 to
2003 2013 2018 2003 2013 2018
Hazard Level 2013 2018 2018
Risk 13,416 38,210 36,133 0.05 0.15 0.14 185% 169% −5%
High risk 38,141 72,261 57,571 0.73 1.38 1.10 89% 51% −20%
Extreme risk 9564 29,283 24,700 0.37 1.12 0.94 206% 158% −16%
All 61,121 139,754 118,404 1.15 2.65 2.18
From Figure 11 and Table 9, over time, the three levels of hazard areas basically showed the trend
of rising first and then declining slightly. This trend is basically consistent with the trend in populationRisk 13,416 38,210 36,133 0.05 0.15 0.14 185% 169% −5%
High risk 38,141 72,261 57,571 0.73 1.38 1.10 89% 51% −20%
Extreme risk 9564 29,283 24,700 0.37 1.12 0.94 206% 158% −16%
All 61,121 139,754 118,404 1.15 2.65 2.18
Water 2020, 12, 1815 15 of 19
From Figure 11 and Table 9, over time, the three levels of hazard areas basically showed the
trend of rising first and then declining slightly. This trend is basically consistent with the trend in
change along
population the river.
change alongThe thehigh-risk zones
river. The were always
high-risk larger
zones were than those
always largerofthan
risk those
and extreme risk
of risk and
zones for the same year. That means, for the Guanshan River Basin, the risk of flash flood
extreme risk zones for the same year. That means, for the Guanshan River Basin, the risk of flash disasters in
human
flood settlements
disasters first increased
in human andfirst
settlements then declinedand
increased slightly.
then declined slightly.
Figure
Figure 11.
11. Distribution
Distribution of
of flash
flash flood
flood disasters
disasters in
in the
the human
human settlements
settlements of
of the
the Guanshan
Guanshan River
River in
in
recent years. The blue river is just a sketch, as its bed is often bare.
recent years. The blue river is just a sketch, as its bed is often bare.
On the
the spatial
spatial scale,
scale, the
the population
population and and houses
houses along
along the
the river
river in
in the
thedownstream
downstream areaarea increased
increased
more than in the upper and middle reaches. Therefore, Therefore, thethe distribution
distribution of of high
high risk
risk and
and extreme
extreme risk
risk
zones in flash flood disasters in downstream areas was always greater than in the upper and middle
areas. This may be be because,
because,in inthe
thedownstream
downstreamarea, area,the
the water
water resources
resources areare more
more abundant,
abundant, whilewhile
the
the terrain
terrain is flatter
is flatter andand transportation
transportation is is more
more convenient,sosodownstream
convenient, downstreamareas areasare
are more
more livable and
residents may migrate there more.
According
According to to the
the calculated
calculated RSAF,
RSAF, regardless
regardless ofof year,
year, high
high risk
risk zones
zones have
have the
the greatest
greatest impact,
impact,
followed by extreme risk zones, and the smallest are risk zones. Although
followed by extreme risk zones, and the smallest are risk zones. Although the extreme risk areas the extreme risk areas are
not large,
are not the the
large, riskrisk
of flash flood
of flash flooddisasters
disastersis is
thethe
highest,
highest, sosothey
theyhave
haveaagreater
greaterimpact
impacton on the
the risk
risk
status
status of flash flood disasters. This This shows
shows that
that RSAF
RSAF intuitively
intuitively reflects
reflects the
the risk
risk status
status of
of flash flood
disasters ininthetheGuanshan
Guanshan River
River Basin.
Basin. The flood
The flood hazardhazard map at
map is good is judging
good atthejudging the spatial
spatial distribution
distribution of risk.itHowever,
of risk. However, it is just
is just a static a static evaluation
evaluation factor andfactor and still
still needs needs
a more a more comprehensive
comprehensive factor to
factor to intuitively
intuitively and dynamically
and dynamically quantifyquantify
the floodthe flood
risk. risk.isRSAF
RSAF actuallyis actually
a furthera further
summary summary of
of typical
typical flood hazards
flood hazards maps,into
maps, taking taking into account
account changeschanges
in human in settlements
human settlements over
over time, time,can
which which can
be used
be
forused for a comprehensive
a comprehensive assessmentassessment during regional
during regional long-term long-term
planning. planning.
In regard to the increased ratios, compared with 2003, in 2013, the extreme risk zones had the
largest increased ratio, and in 2018, the risk zones had the largest increased ratio. Compared with
2013, in 2018, the reduction ratio of high risk zones was the largest, followed by the extreme high
zones. Since 2003, with the development of the regional economy, more residents moved to the river
valley, mainly concentrated in risk and extreme risk zones, which increased the overall risk of flash
flood disasters. From 2013 to 2018, the number of residents living in high risk and extreme risk zones
decreased. Most likely due to the huge losses caused by the flash flood disasters on 5 August 2012,
local residents moved away from the high risk and extreme risk zones. Meanwhile, the reduction in
the risk zones was not obvious.Water 2020, 12, 1815 16 of 19
Due to economic development, people often move to economically better towns along the river to
seek better living conditions. However, for the choice of house relocation, the high risk and extreme
risk zones of flash flood disasters should be avoided as much as possible, to ensure greater security.
5. Discussion
In this study, the FLO-2D model was used for flood simulation. It is sometimes calibrated and
verified by comparing the experimental results with the physical model [37]. In most cases, calibration
and verification data are rare [38]. To perform calibration and verification, scholars conduct mountain
surveys in the study area [39], or record actual measurements and compare the simulated results with
the actual situation [40]. With regard to the calibration or validation of the model result, to produce
reliable results, we used as much accurate and high-quality input data as possible, conducted field
surveys in the early stages, and obtained data of the measured max flow depth to determine actual
conditions of flash flood disasters and to enable comparison with the FLO-2D simulated results.
As for flash flood disaster risk assessment, the maximum water depth and maximum flow velocity
of each grid were used to divide hazard degrees in this study. This method has also been applied
in other places (e.g., Vojtek and Vojteková [11] and Kourgialas and Karatzas [41]). There are several
approaches for defining water depth–velocity hazard categories. Hazard categories were modified
according to Loat [28] in our study. In addition, the actual situation of flash flood disasters in China
were considered, and the hazard levels were divided into three levels, according to 5-, 20-, and
100-year return periods [29], to better describe the flash flood disaster situation in the study area.
To further assess the risk status of flash flood disasters in different years, a method called RSAF was
developed to intuitively reflect the risk status of flash flood disasters in the Guanshan River Basin.
In this study, according to the regulations on the prevention and control of geological hazards in
China [30], the amounts of economic loss were taken as the threshold values, so that the actual situation
in China could be considered when selecting RSAF parameters.
To consider the flood damage, the indirect flood damage was evaluated by analyzing the flash
flood disasters in human settlements. Direct flood damage to buildings [42] was further considered in
this study, to consider floodwater hydrodynamics in the vulnerability assessment of buildings located
in flood prone areas [43].
6. Conclusions
We selected the Guanshan River Basin as the research area, simulated the inflow hydrograph
using TOPMODEL, and built a watershed model based on FLO-2D to simulate the No. 20120806 flood.
Compared with the actual disaster situation, the parameters were calibrated, and the FLO-2D model
applicable to the Guanshan River area was established. The floods designed with different frequencies
were estimated, and the disaster assessment parameters, such as maximum flow depth, maximum
velocity, and maximum impact force, were obtained, and the designed flood intensity was analyzed.
According to the classification of hazard levels, the hazard distribution map of the Guanshan River was
drawn. Compared with the population distribution of Guanshan River in the past 15 years, the map
shows that the probability of loss and casualties caused by flash flood disasters increased first and then
declined slightly. The main findings of this study are as follows:
Simulating the hazard distribution of flash flood disasters in Guanshan River, No. 20120806
flood was selected as a typical flood and the designed floods were chosen with 5-, 10-, 20-, 50-, and
100-year return periods. The inflow hydrographs were simulated by TOPMODEL and the maximum
flow depth, maximum velocity, and maximum impact force were simulated by FLO-2D. According
to the classification criteria of flash flood disasters along Guanshan River, the hazard distribution
map of flash flood disasters for Guanshan River was drawn, which showed that the flood hazards of
Guanshan River are densely distributed along the river, especially in the middle and lower reaches.
The simulated disaster distribution is basically consistent with the actual disaster situation. Therefore,
the hazard distribution map of flash flood disasters of Guanshan River was found to be reasonable.Water 2020, 12, 1815 17 of 19
(1) Simulating the hazard distribution of flash flood disasters in Guanshan River. No. 20120806
flood was selected as a typical flood and the designed floods were chosen with 5-, 10-, 20-, 50-, and
100-year return periods. The inflow hydrographs were simulated by TOPMODEL, and the maximum
flow depth, maximum velocity, and maximum impact force were simulated by FLO-2D. According
to the classification criteria of flash flood disasters along Guanshan River, the hazard distribution
map of flash flood disasters for Guanshan River was drawn, which showed that the flood hazards of
Guanshan River are densely distributed along the river, especially in the middle and lower reaches.
The simulated disaster distribution is basically consistent with the actual disaster situation. Therefore,
the hazard distribution map of flash flood disasters of Guanshan River was found to be reasonable.
(2) Developing the risk status assessment factor (RSAF) for flash flood disasters and then calculating
the increased ratio, so that the risk status of flash flood disasters in different years could be assessed
intuitively. Using the assessment, the risk trend of flash flood hazard in the study area was obtained
intuitively during regional economic development. RSAF is a further summary of typical flood hazards
maps, considering changes in human settlements over time, which is conducive to the comprehensive
evaluation of regional long-term planning. Therefore, during regional economic development planning,
RSAF can provide a reference to help people to avoid the risk of flash flood disasters, and thus reduce
economic losses. From a methodological perspective, the importance of the study is in the proposed
RSAF, which can be used for a comprehensive assessment of the risk of flash flood disasters during
regional economic planning. Further case studies in other regions should be undertaken to verify the
general applicability of the RSAF.
(3) Comparing the population distribution of the Guanshan River Basin in the past 15 years,
we found that, in the human settlement, the hazard distribution area has expanded, and the probability
of loss and casualty caused by flash flood disasters is increasing, which means that the risk of a flash
flood hazard is consistent with the regional development of Guanshan River. According to the RSAF,
although the area of extreme risk zones is not large, it has a greater impact on the risk status, due to
having the highest risk of flash flood disasters. According to the increased ratio, since 2003, with
the development of the regional economy, more residents moved to the risk and extreme risk zones,
which increased the overall risk of flash flood disasters. From 2013 to 2018, most likely due to the
huge losses caused by the flash flood disaster on 5 August, 2012, local residents moved away from
the high risk and extreme risk zones. The findings provide practical guidance for flood control and
disaster prevention in the Guanshan River Basin and showed that the risk assessment for the flash
flood disasters must be considered when planning the regional economic development, otherwise,
development problems may be encountered.
Author Contributions: Conceptualization, N.C. and Y.Z. (Yanjun Zhang); methodology, N.C. and Y.Z.
(Yanjun Zhang); software, N.C.; validation, N.C. and J.W.; formal analysis, W.D.; investigation, N.C. and
Y.Z. (Yixuan Zou); resources, N.C. and J. W; data curation, N.C. and X.X.; writing—original draft preparation,
N.C.; writing—review and editing, N.C. and Y.Z. (Yanjun Zhang); visualization, N.C.; supervision, Y.Z. (Yanjun
Zhang); project administration, Y.Z. (Yanjun Zhang); funding acquisition, Y.Z. (Yanjun Zhang). All authors have
read and agreed to the published version of the manuscript.
Funding: This research was funded by the National Key Research and Development Plan Project of China
(No. 2017YFC1502503) and Major Program of National Natural Science Foundation of China (No. 41790431).
Conflicts of Interest: The authors declare no conflict of interest.
References
1. Oruonye, E.D. Socio-economic impact assessment of flash flood in Jalingo metropolis, Taraba State, Nigeria.
Int. J. Environ. Sci. 2012, 1, 135–140.
2. Saber, M.; Hamaguchi, T.; Kojiri, T.; Tanaka, K. Flash flooding simulation using hydrological modeling
of wadi basins at nile river based on satellite remote sensing data. Annu. Dis. Prev. Res. Inst. Kyoto
Univ. 2010. Available online: https://repository.kulib.kyoto-u.ac.jp/dspace/handle/2433/129361 (accessed on
11 June 2020).You can also read