Long-term groundwater recharge rates across India by in situ measurements
←
→
Page content transcription
If your browser does not render page correctly, please read the page content below

Hydrol. Earth Syst. Sci., 23, 711–722, 2019
https://doi.org/10.5194/hess-23-711-2019
© Author(s) 2019. This work is distributed under
the Creative Commons Attribution 4.0 License.

Long-term groundwater recharge rates across India by
in situ measurements
Soumendra N. Bhanja1,2 , Abhijit Mukherjee1,3,4 , R. Rangarajan5 , Bridget R. Scanlon6 , Pragnaditya Malakar1 , and
Shubha Verma7
1 Department  of Geology and Geophysics, Indian Institute of Technology Kharagpur, Kharagpur, West Bengal 721302, India
2 Facultyof Science and Technology, Athabasca University, Athabasca, Alberta T9S3A3, Canada
3 School of Environmental Science and Engineering, Indian Institute of Technology Kharagpur, Kharagpur,

West Bengal 721302, India
4 Applied Policy Advisory for Hydrogeoscience (APAH) Group, Indian Institute of Technology Kharagpur,

West Bengal 721302, India
5 National Geophysical Research Institute, Uppal Road, Hyderabad 500 007, India
6 Bureau of Economic Geology, Jackson School of Geosciences, The University of Texas at Austin,

Austin, Texas 78713, USA
7 Department of Civil Engineering, Indian Institute of Technology Kharagpur, Kharagpur, West Bengal 721302, India

Correspondence: Soumendra N. Bhanja (soumendrabhanja@gmail.com)
and Abhijit Mukherjee (amukh2@gmail.com, abhijit@gg.iitkgp.ernet.in)

Received: 5 June 2018 – Discussion started: 17 July 2018
Revised: 22 December 2018 – Accepted: 15 January 2019 – Published: 7 February 2019

Abstract. Groundwater recharge sustains groundwater dis-            in most of the river basins across India, indicating human in-
charge, including natural discharge through springs and the         fluence in prevailing recharge rates. The spatial variability in
base flow to surface water as well as anthropogenic dis-            recharge rates could provide critical input for policymakers
charge through pumping wells. Here, for the first time, we          to develop more sustainable groundwater management in In-
compute long-term (1996–2015) groundwater recharge rates            dia.
using data retrieved from several groundwater-level mon-
itoring locations across India (3.3 million km2 area), the
most groundwater-stressed region globally. Spatial varia-
tions in groundwater recharge rates (basin-wide mean: 17 to
960 mm yr−1 ) were estimated in the 22 major river basins           1   Introduction
across India. The extensive plains of the Indus–Ganges–
Brahmaputra (IGB) river basins are subjected to prevalence          India represents ∼ 18 % of the global population but occu-
of comparatively higher recharge. This is mainly attributed to      pies < 3 % of the global land area (Food and Agriculture Or-
occurrence of coarse sediments, higher rainfall, and intensive      ganization of the United Nations, 2013). Agricultural activity
irrigation-linked groundwater-abstraction inducing recharge         is intensive, and parts of India support the highest rate of ir-
by increasing available groundwater storage and return flows.       rigated arable land globally (Siebert et al., 2013). The World
Lower recharge rates (< 200 mm yr−1 ) in most of the central        Bank and Government of India (1998) estimate that ground-
and southern study areas occur in cratonic, crystalline frac-       water contributes ∼ 9 % to India’s GDP. However, few stud-
tured aquifers. Estimated recharge rates have been compared         ies have reported groundwater recharge at a limited num-
favorably with field-scale recharge estimates (n = 52) based        ber of locations (Goel et al., 1975; Bhandari et al., 1982;
on tracer (tritium) injection tests. Results show that precipita-   Athavale et al., 1992, 1998; Rangarajan et al., 1995, 1997,
tion rates do not significantly influence groundwater recharge      1998; Rangarajan and Athavale, 2000; Scanlon et al., 2010;
                                                                    Fig. 1). Out of the total irrigation-linked freshwater with-

Published by Copernicus Publications on behalf of the European Geosciences Union.
712                       S. N. Bhanja et al.: Long-term groundwater recharge rates across India by in situ measurements

                                                                       (October–November). Figure 2 shows annual precipitation
                                                                       patterns between 1996 and 2015. Droughts occurred in 2002,
                                                                       2004, 2009 and 2014 in India (Fig. 2). Precipitation data
                                                                       also reveal distinct spatial variations that range from hu-
                                                                       mid to arid climates. Twenty-two major river basins have
                                                                       been characterized in India (Fig. 1; Bhanja et al., 2017b).
                                                                       The largest river basin in the region is the Ganges basin in
                                                                       terms of area, followed by Indus basin and Godavari basin
                                                                       (Fig. 1; Bhanja et al., 2017b). Brahmaputra (basin 2a) and
                                                                       Barak (basin 2c) basins have the highest annual rainfall oc-
                                                                       currence (> 2000 mm yr−1 ; Table 1), while the Indus basin
                                                                       (basin 1) receives the minimum amount of rainfall (Table 1).
                                                                       India includes a range of hydrogeological settings (Fig. 3)
                                                                       that vary between highly fertile alluvial formations within
                                                                       Indus–Ganges–Brahmaputra (IGB) basin aquifers and less
                                                                       permeable, fractured rock aquifers in parts of central and
                                                                       southern India. Thus, the IGB basin is intensively cultivated
                                                                       leading to comparatively higher rates of groundwater with-
                                                                       drawal.
                                                                          Recharge data are critical for developing sustainable
                                                                       groundwater management policies in India. Understanding
Figure 1. Map of India showing the 22 major river basins and loca-     the controls on groundwater recharge is also valuable for
tions (circles) of 52 field-scale recharge measurements used in this   managing recharge. Currently there are almost no restrictions
study, which were derived from the tritium injection; numbers be-      on groundwater development in India. Electricity policies in
side these locations correspond to sites reported in Table 1. River    India actually promote the overdevelopment of groundwa-
basin numbers are shown in inset. Field-scale recharge data are        ter. Groundwater has played a large role in agricultural pro-
taken from the following studies and unpublished estimates: Goel       duction, supported in large part by intensive irrigation and
et al. (1975), Athavale et al. (1998, 1992), Rangarajan and Athavale   resulting in poverty reduction (Zaveri et al., 2016). How-
(2000), Bhandari et al. (1982) and Rangarajan et al. (1995, 1997,      ever, low recharge rates relative to rates of pumping have
1998, 2000).
                                                                       resulted in large groundwater-level declines, particularly in
                                                                       northwestern India (Bhanja et al., 2017a). The region would
                                                                       face groundwater drought if not managed properly. Bhanja
drawal, more than 50 % is attributed to groundwater in India           et al. (2017a) showed replenishment of groundwater storage
(Central Ground Water Board, 2011).                                    as a function of implementation of sustainable management
   Groundwater recharge can be defined as “the downward                policies in parts of the study area.
movement of water” that reaches the water table (Healy,                   The objective of this study was to estimate spatial variabil-
2010). Recharge can occur directly from the infiltration of            ity in groundwater recharge across India and compare with
rainfall as well as indirectly via irrigation return flows, leak-      hydrogeologic environments, precipitation and irrigation in-
age from surface water bodies or a combination of the two              tensities to better understand controls on recharge variabil-
(Scanlon et al., 2006). In India, the large-scale, anthro-             ity. Unique aspects of this study include the availability of
pogenic redistribution of water impacting recharge has oc-             a network of ∼ 19 000 groundwater-level monitoring loca-
curred through both canal-driven and groundwater-fed irri-             tions with ∼ 2 decades of data (1996 to 2015), the range
gation (Mukherjee et al., 2007; MacDonald et al., 2016). In            of hydroclimatic (arid to humid) and hydrogeologic settings
addition, dry-season groundwater-fed irrigation can increase           (sedimentary to cratonic) sampled, and the varying intensity
available groundwater storage, enabling increased recharge             of irrigation. Recharge estimates were compared with inde-
during the subsequent monsoons (Revelle and Lakshmi-                   pendent field-scale recharge estimates from 52 locations dis-
narayana, 1975; Shamsudduha et al., 2011).                             tributed across India to assess the reliability of the regional-
   In India, groundwater recharge (Fig. 1) is believed to be           scale estimates. Controls on spatial variability of recharge
derived primarily from a continuous spell of rainfall dur-             were also assessed, including precipitation and irrigation in-
ing the monsoon season (extending from June to Septem-                 tensity across the 22 major river basins (Fig. 1). The river
ber); the majority of the total annual precipitation (> 74 %)          basins provide natural subdivisions of the country that reflect
across this region has been occurring during the monsoon               varying hydroclimatic, hydrogeologic and anthropogenic ac-
(Guhathakurta and Rajeevan, 2008). Precipitation varies sub-           tivity (Fig. 1; Table 1).
stantially across India; southern India also receives a mod-
erate amount of precipitation during the pre-winter months

Hydrol. Earth Syst. Sci., 23, 711–722, 2019                                           www.hydrol-earth-syst-sci.net/23/711/2019/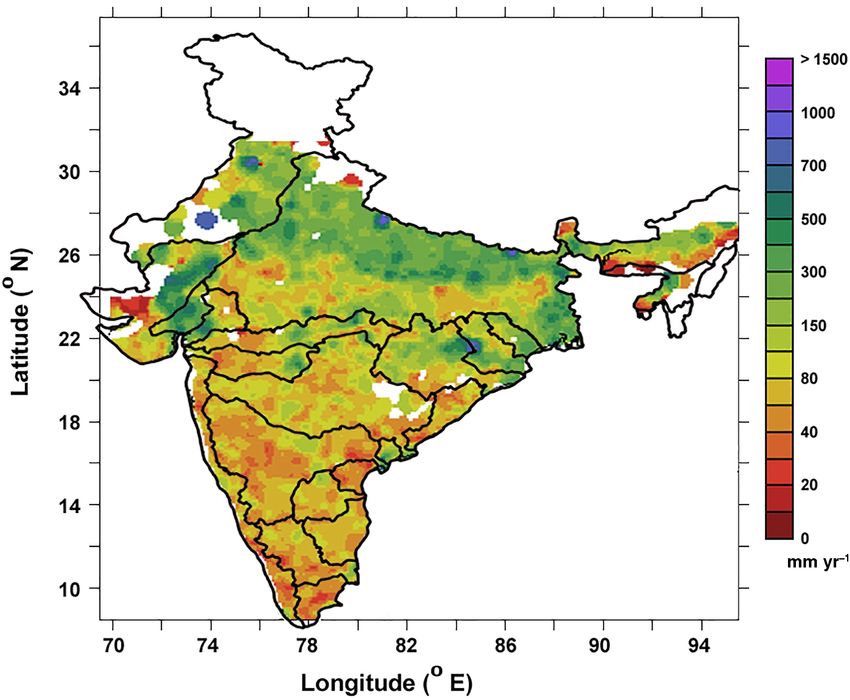
S. N. Bhanja et al.: Long-term groundwater recharge rates across India by in situ measurements                                       713

Figure 2. Maps showing total annual precipitation (mm) over the study area from 1996 to 2015.

Figure 3. Aquifer types, transmissivity (m2 day−1 ) and horizontal hydraulic conductivity values (m day−1 ). Transmissivity and horizontal
hydraulic conductivity values are obtained from the Central Ground Water Board (2012) and Groundwater Resource Estimation Methodology
(1997). IGB basin aquifers are shown with blue line.

www.hydrol-earth-syst-sci.net/23/711/2019/                                              Hydrol. Earth Syst. Sci., 23, 711–722, 2019
714 S. N. Bhanja et al.: Long-term groundwater recharge rates across India by in situ measurements
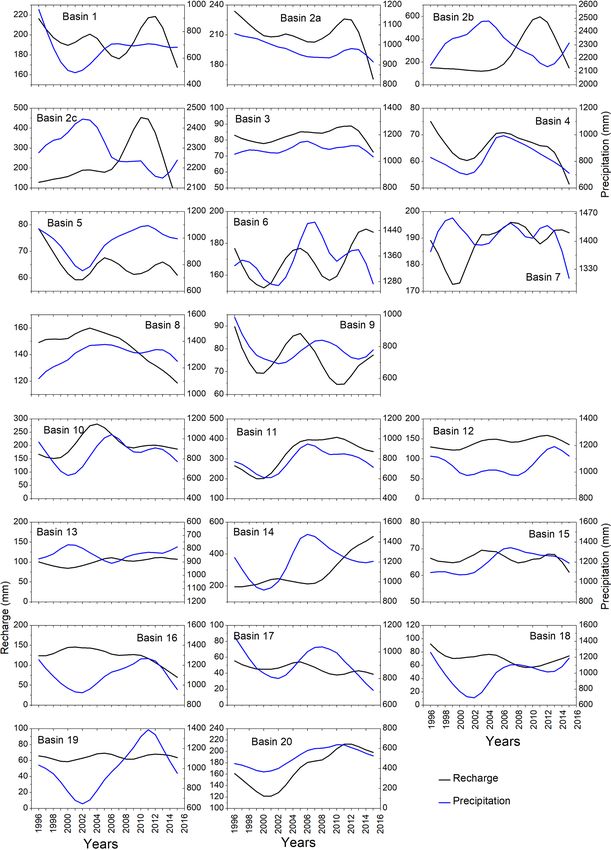
Table 1. Basin-wide annual mean recharge rates (mm yr−1 ), and average precipitation rates in 1996–2015.
ID Basins No. of Rg Precipitation
wells (mm yr−1 ) (mm yr−1 )
1 Indus basin (Indian part) 233 126–263 668
2a Ganges basin 1048 143–264 979
2b Brahmaputra basin 113 94–960 2300
2c Barak and other basins 12 77–802 2291
3 Godavari basin 384 60–111 1094
4 Krishna basin 377 42–98 831
5 Cauvery basin 162 48–92 971
6 Subarnarekha basin 24 121–221 1351
7 Brāhmani and Baitarni basin 56 128–242 1414
8 Mahānadi basin 173 111–200 1300
9 Pennār basin 46 42–131 779
10 Mahi basin 30 49–420 853
11 Sābarmatı̄ basin 47 140–532 782
12 Narmada basin 94 69–186 1057
13 Tapi basin 71 56–159 836
14 West-flowing rivers south of Tapi basin 261 95–628 1205
15 East-flowing rivers between Mahānadi and Godavari basin 51 33–97 1204
16 East-flowing rivers between Godavari and Krishna basin 18 71–188 1104
17 East-flowing rivers between Krishna and Pennar basin 27 17–95 914
18 East-flowing rivers between Pennar and Cauvery basin 84 44–116 993
19 East-flowing rivers south of Cauvery basin 71 41–85 995
20 West-flowing rivers of Kutch and Saurashtra, including Lūni basin 86 84–267 512
2 Data and methods 2.2 Groundwater recharge estimation using the
water-table fluctuation (WTF) method
2.1 Groundwater-level monitoring
One of the major challenges is the absence of high-
Seasonal (i.e., quarterly or four times per year) ground-based resolution, observed data of climatic parameters and other
monitoring data (n > 15 000) for 20 years (from 1996 to controlling factors that could be used in groundwater
2015) were a part of the Central Ground Water Board’s recharge measurement. High spatiotemporal variability of
(CGWB, Government of India) groundwater monitoring mis- groundwater recharge is another concern for the regional-
sion. Most (∼ 85 %) of the studied wells represent shal- scale recharge estimates (Healy, 2010). In the absence of
low, unconfined aquifers (Central Ground Water Board, field-scale data to estimate recharge, simpler methods, such
2014); however, these aquifers have not been character- as the water-table fluctuation (WTF) technique, are more
ized in CGWB reports and products. Initially, groundwater- widely used to estimate recharge (Rg ; Healy and Cook,
level data were filtered for attaining a temporally continu- 2002). Rg may be defined as
ous dataset in the study area for each year. The data were
collected once during the months of January, May, August Rg = 1h × Sy , (1)
and November in individual years (Groundwater Resource
Estimation Methodology, 1997). Outliers were removed fol- where 1h represents seasonal changes in groundwater levels.
lowing Tukey’s fence approach (Tukey, 1977), reducing the Specific yield (Sy ) of the aquifer material is one of the im-
usable number of monitoring data points to 3468. The an- portant components for the recharge estimation. Sy informa-
nual change in groundwater levels was determined using the tion was retrieved following the Central Ground Water Board
highest and lowest groundwater head elevation (highest and (2012) and Bhanja et al. (2016). Mean Sy values vary be-
lowest groundwater level generally occur in post-monsoon tween 0.02 and 0.13, varying with identified aquifers (Figs. 3
and pre-monsoon times, respectively) for each year. Finally, and 4a). The IGB basins are heavily irrigated, with intensive
gridded (0.1◦ × 0.1◦ )1h data were obtained following the groundwater withdrawals (Fig. 4b; Supplement Fig. S1) rel-
ordinary kriging technique. ative to other parts of the country.
Hydrol. Earth Syst. Sci., 23, 711–722, 2019 www.hydrol-earth-syst-sci.net/23/711/2019/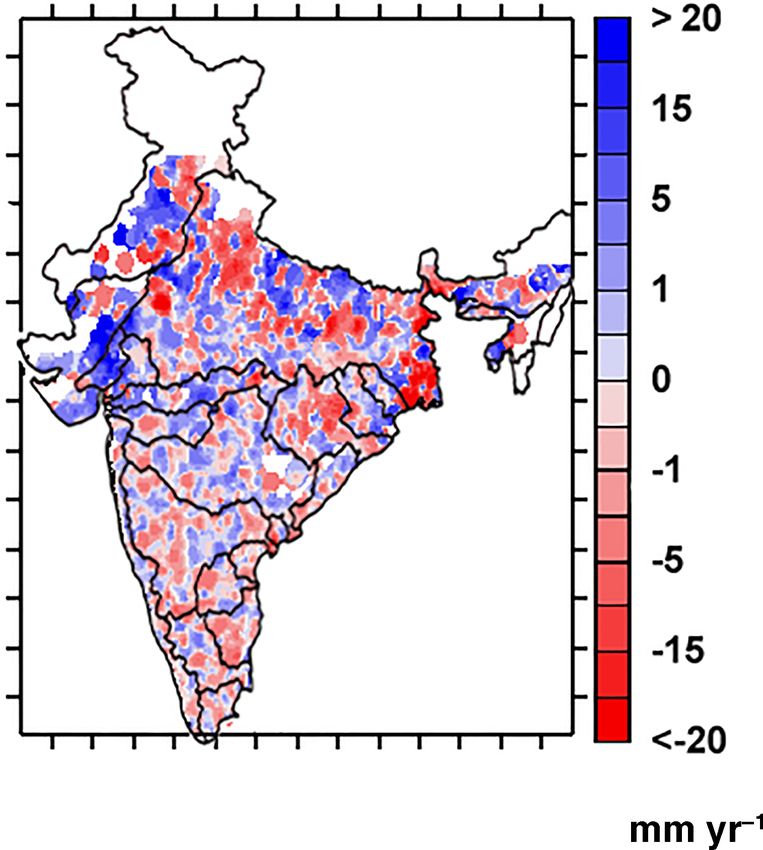
S. N. Bhanja et al.: Long-term groundwater recharge rates across India by in situ measurements                                   715

2.3    Field-scale recharge estimation using tritium                 to lower precipitation in 2009 (Fig. 2), with 22 out of 26 me-
       injection approach                                            teorological subdivisions declared as rainfall deficit in India
                                                                     (National Climate Centre, 2013). Linear regression analysis
A tracer in the form of ions, isotope or gases move with wa-         of recharge rates between 1996 and 2015 show simultane-
ter and can be tracked to estimate water infiltration through        ous occurrence of increased and decreased trends in recharge
unsaturated zone (Healy, 2010). Here, the tritium injection          rates in different parts of India (Fig. 7). Parts of the Ganges
method has been used to estimate recharge rates in 52 lo-            basin (basin 2a) have been experiencing rapid declines in
cations across India (Fig. 1). The equivalent depth of water         recharge rates, while parts of western and northwestern In-
of the peak movement can be represented as the total in-             dia are experiencing increases in recharge in the study period
filtrated water flux (Healy, 2010). The piston-flow method,          (Fig. 7). Non-linear trend analysis shows high temporal vari-
which has been a major assumption in tracer movement tech-           ation in recharge in all of the studied basins (Fig. 8); maxi-
nique, is linked with the vertically downward movement of            mum recharge amplitudes are found in basins 2b, 2c, 11 and
water and dissolved solutes without mixing and change in             14 (Fig. 8). The basins are located in comparatively higher
velocity (Healy, 2010). Tritium injection is performed dur-          precipitation zones of northeastern and western–coastal In-
ing the pre-monsoon seasons, and the soil core is collected          dia, respectively.
after the monsoon in order to estimate the monsoon recharge
rate (Rangarajan and Athavale, 2000). More details on the            3.2   Groundwater recharge estimates as a function of
tritium injection method can be found in the Supplement and                climate, hydrogeology and irrigation
in Rangarajan et al. (2000).
                                                                     Comparatively higher rates of precipitation partly explain the
2.4    Non-linear trend analysis                                     high recharge rates in the IGB basin. Precipitation data show
                                                                     high annual variability in all of the basins (Fig. 9). Highly
Non-linearity in the recharge and precipitation data can be
                                                                     fertile sedimentary formations of IGB basin facilitate both
represented through Hodrick–Prescott (HP) trend analysis
                                                                     direct and indirect recharge. Higher agricultural groundwater
(Hodrick and Prescott, 1997), which separates cyclical com-
                                                                     withdrawal in the IGB basin (Fig. 4b) leads to decreases in
ponents present (ct ) in the data (yt ) from the trend (Tt ) after
                                                                     water storage, which can result in increased recharge by gen-
solving the following equations:
                                                                     erating more recharge space. Subsequently, recharge rates
yt = Tt + ct ,                                             (2)       are not homogenous throughout the IGB basins (Figs. 5
        XT                                                           and 6). The unconsolidated formations of the IGB basin are
Min(T ) t=1 ((yt − Tt )2 + λ((Tt+1 − Tt ) − (Tt − Tt−1 ))2 ),        highly transmissive for the water flow (transmissivity values
                                                           (3)       varies from 250 to 4000 m2 day−1 ; Fig. 3). Horizontal hy-
                                                                     draulic conductivity values are found to be higher in the IGB
where λ is a constant (Hodrick and Prescott, 1997; Ravn and          basin (hydraulic conductivity varies from 10 to 800 m day−1 ;
Uhlig, 2002).                                                        Fig. 3). As a result, intense groundwater withdrawal at a re-
                                                                     gion within the IGB basin would have a profound impact
3     Results and discussions                                        on the groundwater storage on the surrounding regions (par-
                                                                     ticularly the areas within the periphery of the pumping in-
3.1    Recharge estimates from the water-table                       fluence). This would facilitate the creation of the additional
       fluctuation method                                            recharge space within the entire region. In contrast, compar-
                                                                     atively lower transmissivity and hydraulic conductivity val-
Calculation of the Rg , based on water-level data from 1996          ues in aquifers of western, central and southern India restrict
to 2015, exhibits both spatial and temporal variability over         water to flow in the horizontal direction (Fig. 3). This in-
the years (Fig. 5). In general, the years of lowest ground-          hibits the horizontal flow of water after a pumping event in
water recharge, i.e., 2002, 2004, 2009 and 2014, corre-              those regions. Basin-wide mean recharge rates are found to
spond to years of lowest precipitation (Figs. 2 and 5). An           be variable over the years (Fig. 9). Highest interannual vari-
Rg exceeding 300 mm yr−1 is found over most regions of               ability has been obtained in basins 2b, 2c and 14 (Fig. 9);
the IGB basin (Figs. 5 and 6). Central and southern India            the basins are also experiencing highest precipitation rates
have been subjected to comparatively lower recharge rates            (Table 1; Fig. 9). In contrast, basins located in Indian craton,
(< 200 mm yr−1 ). Basin-wide data show highest recharge              i.e., basins 3, 4, 5 and 19, exhibit lowest interannual vari-
rates in basins 1, 2a, 2b, 2c, 10, 11, 14 and 20 (Fig. 6; Ta-        ability (Fig. 9). Lower recharge rates are found in central
ble 1); parts of the basins are composed of alluvial sedi-           and southern parts of India (Figs. 5 and 6). The crystalline
ments that are also intensively irrigated and are linked to          aquifers in these regions (Mukherjee et al., 2015) are not
groundwater withdrawal. The highest annual recharge rate             conducive enough for precipitation-based infiltration through
was calculated for 2010 in most basins. High recharge rates          the subsurface. The observation is consistent with Sukhija et
in 2010 are attributed to increased space for recharge related       al. (1996), who also found a lower recharge rate in fractured

www.hydrol-earth-syst-sci.net/23/711/2019/                                           Hydrol. Earth Syst. Sci., 23, 711–722, 2019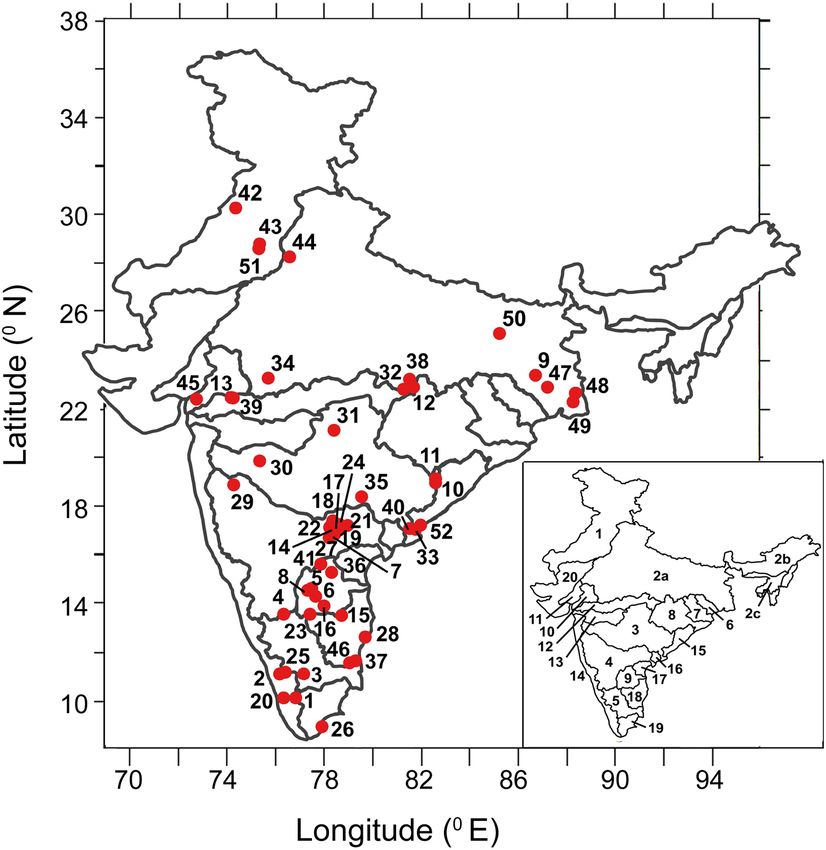
716                      S. N. Bhanja et al.: Long-term groundwater recharge rates across India by in situ measurements

Table 2. Field-scale recharge (Rn ) estimates across 52 locations (Fig. 1), river basin ID number, hydrogeology and prevailing precipitation
rates (mm yr−1 ).

                        Location    Location name             River basin    Hydrogeologic     Rn     Precipitation
                        ID                                            ID     setting           mm        mm yr−1
                        1           Noyil                              14    Granite            69      1768–3776
                        2           Ponnāni                           14    Granite            61      1305–3781
                        3           Vattamalaikarai                     5    Granite            61        83–1796
                        4           West Suvarnamukhi                   4    Granite            39        264–979
                        5           Marvanka                            9    Granite            42       343–1017
                        6           Chitravathi                         9    Granite            25       307–1149
                        7           Aurepalle                           4    Granite           105       322–1201
                        8           Mannı̄la                            9    Granite            24       376–1035
                        9           Gandheswari                        2a    Granite           179       728–1909
                        10          Putra                               3    Granite           166       868–2621
                        11          Parlijori                           3    Granite           159      1045–2687
                        12          Jaithari, Shahdol                  2a    Granite            98       879–1802
                        13          Upper Hatni                        12    Granite            97       513–1574
                        14          Gaetec                              4    Granite            46       368–1147
                        15          Gurukanipalle                      18    Granite            98       589–1686
                        16          Tavalam                             9    Granite            34       468–1213
                        17          Maheswaram                          4    Granite            22       368–1147
                        18          Hyderabad                           4    Granite            37       535–1168
                        19          Gummalabavigudem                    4    Granite            41       532–1190
                        20          Pazhayannur, Tirusūr              14    Granite            71      1753–4409
                        21          Wailepalle                          4    Granite            75       318–1541
                        22          Jangaon                             4    Granite            43       318–1541
                        23          Baisagara, Karnat                  18    Granite            64       463–1086
                        24          Kongal, Telangana                   4    Granite            27       441–1057
                        25          Agali, Palakkad                    14    Granite           149       706–2520
                        26          Siil, Tuticorin                    19    Granite            63       354–1749
                        27          Mādhāram                          4    Granite            55       488–1097
                        28          Kalpakkam, Chennai                 18    Granite           174       167–1043
                        29          Kakudi                              4    Basalt             46        211–922
                        30          Purna                               3    Basalt             56        340–932
                        31          Jam                                 3    Basalt            131       554–1353
                        32          Shahdol                            2a    Basalt             71       767–1673
                        33          East Godavari                       3    Basalt             90       609–1884
                        34          Ghātiya                           2a    Basalt            171       473–1715
                        35          Lower Maner basin                   3    Sediment          117       585–1808
                        36          Kunderu                             9    Sediment           29       491–1443
                        37          Neyveli                            18    Sediment          181       277–2337
                        38          Shahdol                            2a    Sediment          103       829–1742
                        39          Upper Hatni                        12    Sediment          113       384–1440
                        40          East Godavari                      15    Sediment          135       644–1660
                        41          Kalugotla                           9    Sediment          106       479–1272
                        42          Punjab                              1    Alluvium           56        197–828
                        43          Haryana                             1    Alluvium           70        112–738
                        44          Western Uttar Pradesh              2a    Alluvium           20        195–874
                        45          Sābarmatı̄                        10    Alluvium          107       418–1485
                        46          Neyveli                            18    Alluvium          161        51–1850
                        47          Gandheswari                        2a    Alluvium          137      1041–1744
                        48          24 Parganas North                  2a    Alluvium          198       385–2260
                        49          24 Parganas South                  2a    Alluvium           21       386–2251
                        50          Nalanda                            2a    Alluvium           82       500–1973
                        51          Churu                               1    Alluvium           62        152–676
                        52          Sudagadda                          15    Alluvium          105        197–828

Hydrol. Earth Syst. Sci., 23, 711–722, 2019                                              www.hydrol-earth-syst-sci.net/23/711/2019/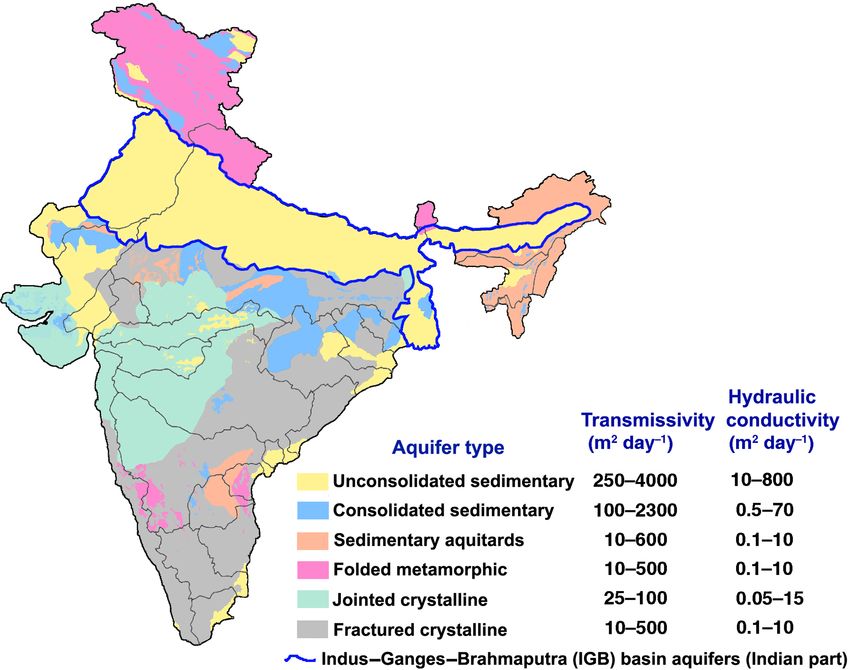
S. N. Bhanja et al.: Long-term groundwater recharge rates across India by in situ measurements                                               717

Figure 4. Maps of (a) specific yield data (modified from Bhanja et al., 2016). Blank areas represent areas of no data availability; (b) state-wide
groundwater abstraction for irrigation (mm; estimates are for the year 2009; Central Ground Water Board, 2012).

Figure 5. Maps showing gridded (0.1◦ × 0.1◦ ) groundwater recharge (mm yr−1 ) calculated using WTF method. Blank areas represent areas
of no data availability.

regions. Deeply weathered, lateritic soils that have developed             3.3    Comparison with field-scale recharge estimates
on cratons often have low-matrix permeabilities due to con-
centration of kaolinite and development of ferricretes (lat-               We present field-scale recharge rates (Rn ; Fig. 1) derived
erites; Taylor and Howard, 1999). These low-matrix perme-                  from the tritium injection approach (Rangarajan et al., 2000)
abilities promote infiltration via discontinuities. Soil perme-            in Table 2. The recharge rates were estimated in four dif-
abilities are substantially less than those of the sorted alluvial         ferent land use types, i.e., granite, basalt, sediment and al-
soils in the IGB basin.                                                    luvium. Rn varies within a range of 22–179 mm in loca-
                                                                           tions within granite setting and the values reach 46–171 mm

www.hydrol-earth-syst-sci.net/23/711/2019/                                                   Hydrol. Earth Syst. Sci., 23, 711–722, 2019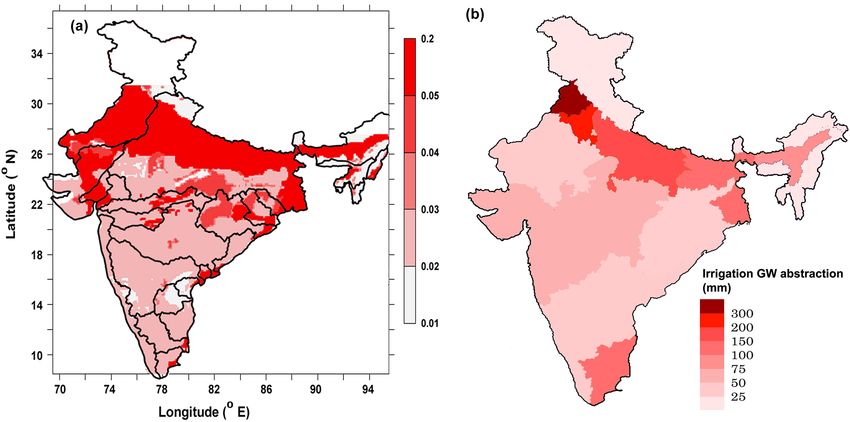
718                      S. N. Bhanja et al.: Long-term groundwater recharge rates across India by in situ measurements

                                                                    through the unsaturated zone traced by radioisotopes (Healy,
                                                                    2010). Also, the Rn includes only monsoon recharge, while
                                                                    the Rg includes both monsoon and pre-monsoon recharge
                                                                    that is dominated by the irrigation return flow. Hence, con-
                                                                    tributions from indirect recharge via irrigation return flows
                                                                    and recharge amplified by dry-season abstraction for irriga-
                                                                    tion are ignored in Rn estimates. Rg was found to be lower
                                                                    than Rn in some of the locations (location numbers 10, 11,
                                                                    25, 28, 40 and 46 in Figs. 1 and 10). Each of the six locations
                                                                    is subjected to comparatively lower rates of irrigation-linked
                                                                    groundwater withdrawal (Fig. 4b). Therefore, the irrigation
                                                                    return flow and creation of additional recharge space are al-
                                                                    most negligible in these locations. Furthermore, the locations
                                                                    are also experiencing comparatively higher rates of precipi-
                                                                    tation (Table 2). As the Rg will not consider a fraction of
                                                                    recharge particularly during aquifer full condition (Healy and
                                                                    Cook, 2002), it is likely the major reason for the observation
Figure 6. Map of mean recharge in the study period (1996–2015).     of lower Rg values than Rn values in these six locations.
Blank areas represent areas of no data availability.
                                                                    3.4   Groundwater recharge as a function of
                                                                          precipitation

                                                                    Recharge rates are significantly (p value < 0.01) correlated
                                                                    with precipitation in 10 out of the 22 basins. Non-linear trend
                                                                    analysis between basin-wide recharge rates and precipitation
                                                                    show good match in basins 2a, 3, 4, 12 and 20 (Fig. 8). In
                                                                    contrast, recharge and precipitation trends are negatively cor-
                                                                    related in basins 2b, 2c, 7, 16 and 18 (Fig. 8). In order to
                                                                    study the relationship in more detail, we used the Granger
                                                                    causality analysis (Granger, 1988). Results show precipita-
                                                                    tion significantly (p value < 0.01) causes Rg in six basins,
                                                                    i.e., 8, 11, 12, 13, 15 and 16. Most of these basins are not in-
                                                                    tensively irrigated; groundwater withdrawal rates are found
                                                                    to be lower in these regions, and irrigation groundwater with-
                                                                    drawal was found to be less than 75 mm in all of the basins
                                                                    (Fig. 4b). Therefore, natural processes, i.e., precipitation, still
                                                                    influence recharge rates in those basins. Alternatively, the re-
Figure 7. Maps of positive and negative trends of groundwater       lationship between recharge and precipitation is statistically
recharge in 1996–2015. Basin boundaries are overlaid. Blank areas   insignificant in other basins, which are more intensively irri-
represent areas of no data availability.                            gated (50 to more than 300 mm; Fig. 4b). As a result, precip-
                                                                    itation influence is found to be less dominant in recharge in
                                                                    these regions.
in basalt regions (Table 2 and Fig. 10). Recharge rates are
found to be comparatively higher in the sediment and allu-          3.5   Assumptions and limitations
vial regions, with rates of 29–181 and 20–198 mm, respec-
tively (Table 2 and Fig. 10). Similarly, Rg values also exhibit     Minimal reliance on assumptions in measurement is an
higher recharge in sediment and alluvium regions (Fig. 10).         advantages of using the WTF method (Healy and Cook,
   Values of Rg from this study compare favorably with              2002). Furthermore, the method can be followed to esti-
site-scale determinations in 42 out of the total 52 locations       mate recharge for a large region, simultaneously (Healy and
(Fig. 10). However, the Rg was found to be larger than the          Cook, 2002). Uncertainty in groundwater storage coefficients
recharge rates in location identification (ID) numbers 44, 45,      (e.g., Sy ) influences the magnitude of computed recharge.
49 and 50 in Figs. 1 and 10). Three out of four locations are       In the WTF method, recharge rates exhibit minimum values
located in IGB basin, which experiences intensive groundwa-         in groundwater discharge regions. The antecedent recession
ter abstraction for irrigation (Fig. 4b). This discrepancy may      during the peak groundwater level (Healy and Cook, 2002),
be coming from the assumption that direct recharge is only          which is a component of base flow and discharge, is difficult

Hydrol. Earth Syst. Sci., 23, 711–722, 2019                                         www.hydrol-earth-syst-sci.net/23/711/2019/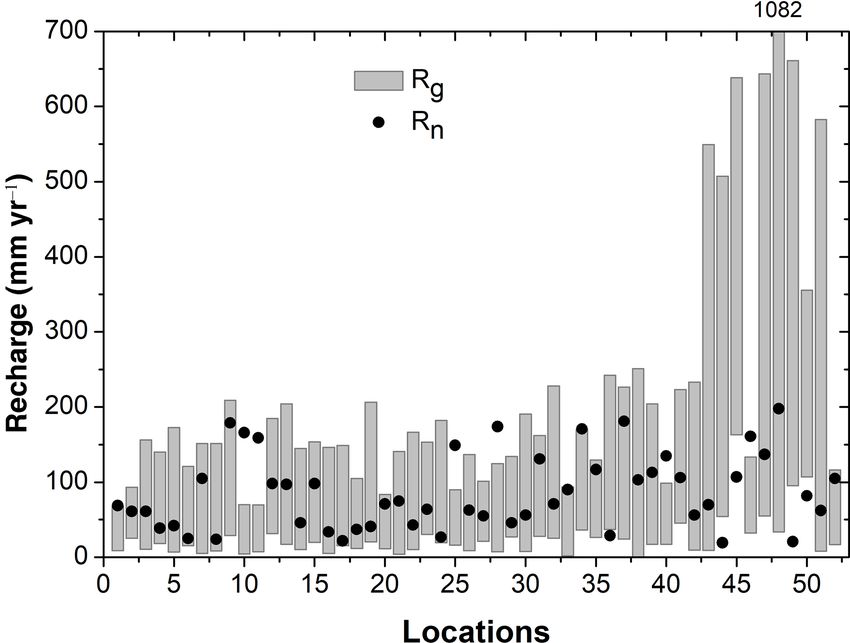
S. N. Bhanja et al.: Long-term groundwater recharge rates across India by in situ measurements                                      719

Figure 8. Basin-wide estimates of Hodrick–Prescott trend analysis of Rg (mm yr−1 ) and precipitation (mm yr−1 ). For basin locations, see
Fig. 1.

www.hydrol-earth-syst-sci.net/23/711/2019/                                             Hydrol. Earth Syst. Sci., 23, 711–722, 2019
720 S. N. Bhanja et al.: Long-term groundwater recharge rates across India by in situ measurements
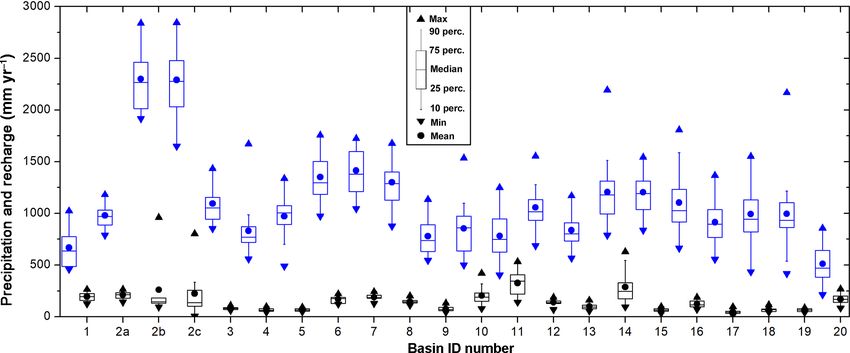
Figure 9. Basin-wide box-whisker plot of precipitation (blue) and recharge rates (black). Symbols representing the mean, median, maximum
value (max), minimum value (min), 10th percentile, 25th percentile, 75th percentile and 90th percentile are shown in inset of the bottom
figure.
paratively higher rates of precipitation, high permeability and
intense groundwater abstraction, either alone or in combina-
tion, are the major reasons. In contrast, in central and south-
ern India, comparatively lower recharge occurrence is at-
tributed to lower permeability fractured-crystalline cratonic
rocks. Comparatively lower precipitation and lower irriga-
tion rates are also influencing recharge rates in those regions.
Recharge rates based on WTF compare favorably with in-
dependent recharge estimates from tracer data in 42 out of
52 locations. Pre-monsoon time recharge and recharge from
the irrigation return flow are the reasons for this mismatch
in the four locations within alluvium formation. Controls
on recharge include precipitation in less intensively irrigated
basins. Results from this study should provide valuable input
for policymakers developing more sustainable groundwater
management plans.
Figure 10. Comparison of groundwater recharge rates obtained
from the present study (annual range) and some of the earlier stud-
ies conducted over the point locations shown in Fig. 1. Recharge Data availability. Groundwater level data were obtained from the
estimates exceeding 700 mm yr−1 data are indicated on the top of Central Ground Water Board (CGWB), Government of India (Cen-
the column. tral Ground Water Board, 2017). Precipitation data were obtained
from the India Meteorological Department (IMD) (http://www.imd.
gov.in, India Meteorological Department, 2016).
to measure accurately and hence results in underestimation
of recharge during that time.
Supplement. The supplement related to this article is available
online at: https://doi.org/10.5194/hess-23-711-2019-supplement.
4 Conclusions
Groundwater recharge is computed from in situ observations Author contributions. SNB and AM conceived the study. SNB re-
between 1996 to 2015 in 22 major river basins across India. trieved the data and performed the analysis. Tritium injection anal-
ysis has been performed by RR. SNB and AM wrote the paper with
Differential spatial patterns of climate, geology and with-
inputs from RR, BRS, PM and SV.
drawal linked to irrigation are the major reasons for spatial
heterogeneity in groundwater recharge in India. Higher val-
ues (> 300 mm yr−1 ) of groundwater recharge rates are ob-
served in alluvial plains of northern and eastern India. Com-
Hydrol. Earth Syst. Sci., 23, 711–722, 2019 www.hydrol-earth-syst-sci.net/23/711/2019/S. N. Bhanja et al.: Long-term groundwater recharge rates across India by in situ measurements 721
Competing interests. The authors declare that they have no conflict Goel, P. S., Datta, P. S., Rama, Sanghal, S. P., Hans Kumar,
of interest. Prakash Bahadur, Sabherwal, R. K., and Tanwar, B. S.: Tritium
tracer studies on ground water recharge in the alluvial deposits
of Indo-Gangetic plains of western U.P., Punjab and Haryana,
Acknowledgements. Soumendra N. Bhanja acknowledges the in: Proceedings of Indo-German Workshop on Approaches and
CSIR (Government of India) for their support in providing the SPM Methodologies for Development of Ground Water Resources,
fellowship. Soumendra N. Bhanja also acknowledges U.S. De- edited by: Athavale, R. N., NGRI, Hyderabad, 309–322, 1975.
partment of State for the Fulbright fellowship. We acknowledge Granger, C. W.: Causality, cointegration, and control, J. Econ. Dyn.
the Central Ground Water Board of India and the IMD, India, for Control, 12, 551–559, 1988.
the water-level data and precipitation data, respectively. We thank Groundwater Resource Estimation Methodology: Report of the
Robert C. Reedy, UT Austin, for his help with the improvement of groundwater resource estimation committee, Ministry of Water
the figures. We thank Charudutta M. Nirmale for his help in data Resources, Government of India, New Delhi, 1997.
retrieval. Guhathakurta, P. and Rajeevan, M.: Trends in the rainfall pattern
over India, Int. J. Climatol., 28, 1453–1469, 2008.
Edited by: Graham Fogg Healy, R. W.: Estimating groundwater recharge, Cambridge Univer-
Reviewed by: two anonymous referees sity Press, New York, 245 pp., 2010.
Healy, R. W. and Cook, P. G.: Using groundwater levels to estimate
recharge, Hydrogeol. J., 10, 91–109, 2002.
Hodrick, R. J. and Prescott, E. C.. Postwar US business cycles: an
References empirical investigation, J. Money Credit Bank., 29, 1–16, 1997.
India Meteorological Department: Data Products of NCC,
Athavale, R. N., Rangarajan, R., and Muralidharan, D.: Measure- Government of India, available at: http://www.imd.gov.in/
ment of natural recharge in India, J. Geol. Soc. India, 39, 235– advertisements/20170320_advt_34.pdf, last access: 25 May
244, 1992. 2016.
Athavale, R. N., Rangarajan, R., and Muralidharan, D.: Influx and MacDonald, A. M., Bonsor, H. C., Ahmed, K. M., Burgess, W. G.,
efflux of moisture in a desert soil during a one year period, Water Basharat, M., Calow, R. C., Dixit, A., Foster, S. S. D., Gopal,
Resour. Res., 34, 2871–2877, 1998. K., Lapworth, D. J., and Lark, R. M.: Groundwater quality and
Bhandari, N., Gupta, S. K., Sharma, P., Premsagar, Ayachit, V., and depletion in the Indo-Gangetic Basin mapped from in situ obser-
Desai, B. I.: Hydrogeological investigations in Sabarmati basin vations, Nat. Geosci., 9, 762–766, 2016.
and coastal Saurashtra using radioisotope methods, Final scien- Mukherjee, A., Fryar, A. E., and Howell, P. D.: Regional hy-
tific report, PRL, Ahmedabad, India, 220 pp., 1982. drostratigraphy and groundwater flow modeling in the arsenic-
Bhanja, S. N., Mukherjee, A., Saha, D., Velicogna, I., affected areas of the western Bengal basin, West Bengal, India,
and Famiglietti, J. S.: Validation of GRACE based Hydrogeol. J., 15, 1397–1418, 2007.
groundwater storage anomaly using in-situ groundwater Mukherjee, A., Saha, D., Harvey, C. F., Taylor, R. G., Ahmed, K.
level measurements in India, J. Hydrol., 543, 729–738, M., and Bhanja, S. N.: Groundwater systems of the Indian Sub-
https://doi.org/10.1016/j.jhydrol.2016.10.042, 2016. Continent, J. Hydrol. Regional Studies, 4, 1–14, 2015.
Bhanja, S. N., Mukherjee, A., Rodell, M., Wada, Y., Chat- National Climate Centre: India Meteorological Department, Mon-
topadhyay, S., Velicogna, I., Pangaluru, K., and Famiglietti, J. soon report 2012, Pune, 193 pp., 2013.
S.: Groundwater rejuvenation in parts of India influenced by Rangarajan, R. and Athavale, R. N.: Annual replenishable ground
water-policy change implementation, Sci. Rep.-UK, 7, 7453, water potential of India – an estimate based on injected tritium
https://doi.org/10.1038/s41598-017-07058-2, 2017a. studies, J. Hydrol., 234, 38–53, 2000.
Bhanja, S. N., Rodell, M., Li, B., Saha, D., and Rangarajan, R., Deshmukh, S. D., Prasada Rao, N. T. V., and
Mukherjee, A.: Spatio-temporal variability of ground- Athavale, R. N.: Natural recharge measurements in Shahdol dis-
water storage in India, J. Hydrol., 544, 428–437, trict, Madhya Pradesh using injected tritium method, Tech. Re-
https://doi.org/10.1016/j.jhydrol.2016.11.052, 2017b. port No. NGRI-95-GW-174, Hyderabad, 26 pp., 1995.
Central Ground Water Board: Dynamic groundwater resources, Rangarajan, R., Deshmukh, S. D., Ramesh, G. V. ., Prasad, A. L.
Govt. of India, Ministry of Water Resources, Faridabad, 225 pp., V., and Athavale, R. N.: Natural recharge studies using injected
2009. tritium technique in Bankura, North 24 Paraganas and South 24
Central Ground Water Board: Aquifer Systems of India, Govt. of Paraganas districts of West Bengal, Hyderabad, Tech. Report No.
India, Ministry of Water Resources, Faridabad, 92 pp., 2011. NGRI-97-GW-214, 45 pp., 1997.
Central Ground Water Board: Ground Water Year Book, India, Rangarajan, R., Deshmukh, S. D., Sarma, M. V. B. M., Kesava Ram-
2013–2014, Govt. of India, Ministry of Water Resources, Farid- prasad, B., and Athavale, R. N.: Natural recharge measurements
abad, 76 pp., 2014. in GAETEC watershed near Hyderabad city, Andhra Pradesh,
Central Ground Water Board: Ground Water level (Post Tech. Report No. NGRI-98-GW-223, Hyderabad, 25 pp., 1998.
Monsoon 2016) Data, Government of India, available at: Ravn, M. O. and Uhlig, H.: On adjusting the Hodrick-Prescott filter
http://www.india-wris.nrsc.gov.in/GWL/GWL.html?UType= for the frequency of observations, Rev. Econ. Stat., 84, 371–376,
R2VuZXJhbA==?UName=, last access: 20 June 2017. 2002.
Food and Agriculture Organization of the United Nations: FAO Sta- Revelle, R. and Lakshminarayana, V.: The Ganges Water Machine,
tistical Yearbook 2013, World Food and Agriculture, Rome, 289 Science, 188, 611–616, 1975.
pp., 2013.
www.hydrol-earth-syst-sci.net/23/711/2019/ Hydrol. Earth Syst. Sci., 23, 711–722, 2019722 S. N. Bhanja et al.: Long-term groundwater recharge rates across India by in situ measurements Scanlon, B. R., Keese, K. E., Flint, A. L., Flint, L. E., Gaye, C. B., Taylor, R. G. and Howard, K. W. F.: Lithological evidence for the Edmunds, W. M., and Simmers, I.: Global synthesis of ground- evolution of weathered mantles in Uganda by tectonically con- water recharge in semiarid and arid regions, Hydrol. Process., 20, trolled cycles of deep weathering and stripping, Catena, 35, 65– 3335–3370, 2006. 94, 1999. Scanlon, B. R., Mukherjee, A., Gates, J., Reedy, R. C., and Sinha, Tukey, J. W.: Exploratory Data Analysis, Addison-Wesley, Reading, A. K.: Groundwater recharge in natural dune systems and agri- Massachusetts, 1977. cultural ecosystems in the Thar Desert region, Rajasthan, India, World Bank and Government of India: India-water resources man- Hydrogeol. J., 18, 959–972, 2010. agement sector review: groundwater regulation and management Shamsudduha, M., Taylor, R. G., Ahmed, K. M., and Zahid, A.: report, World Bank Government of India, Washington D.C., New The impact of intensive groundwater abstraction on recharge to Delhi, 1998. a shallow regional aquifer system: evidence from Bangladesh, Zaveri, E., Grogan, D. S., Fisher-Vanden, K., Frolking, S., Lam- Hydrogeol. J., 19, 901–916, 2011. mers, R. B., Wrenn, D. H., Prusevich, A., and Nicholas, R. E.: Siebert, S., Henrich, V., Frenken, K., and Burke, J.: Update of Invisible water, visible impact: groundwater use and Indian agri- the global map of irrigation areas to version 5, University of culture under climate change, Environ. Res. Lett., 11, 084005, Bonn/FAO, Bonn, Germany, Rome, Italy, 10, 2660–6728, 2013. https://doi.org/10.1088/1748-9326/11/8/084005, 2016. Sukhija, B. S., Nagabhushanam, P., and Reddy, D. V.: Groundwa- ter recharge in semi-arid regions of India: an overview of results obtained using tracers, Hydrogeol. J., 4, 50–71, 1996. Hydrol. Earth Syst. Sci., 23, 711–722, 2019 www.hydrol-earth-syst-sci.net/23/711/2019/
You can also read