Multiscale Analysis of the Strength Deterioration of Loess under the Action of Drying and Wetting Cycles - Hindawi.com
←
→
Page content transcription
If your browser does not render page correctly, please read the page content below
Hindawi
Advances in Materials Science and Engineering
Volume 2021, Article ID 6654815, 12 pages
https://doi.org/10.1155/2021/6654815

Research Article
Multiscale Analysis of the Strength Deterioration of Loess under
the Action of Drying and Wetting Cycles

 Yang Bai , Wanjun Ye, Yuntao Wu, and Yiqian Chen
 School of Architecture and Civil Engineering, Xi’an University of Science and Technology, Xi’an 710054, Shaanxi, China

 Correspondence should be addressed to Yang Bai; baiyang19920613@163.com

 Received 1 February 2021; Revised 2 March 2021; Accepted 25 March 2021; Published 2 April 2021

 Academic Editor: Hamed Akhavan

 Copyright © 2021 Yang Bai et al. This is an open access article distributed under the Creative Commons Attribution License, which
 permits unrestricted use, distribution, and reproduction in any medium, provided the original work is properly cited.

 To study the strength degradation mechanism of compacted loess during dry-wet cycles, 0–5 dry-wet cycles tests and many triaxial
 compression tests were carried out on loess with an optimal moisture content. During the dry-wet cycles, the loess samples were
 analyzed by nuclear magnetic resonance and scanning electron microscopy. Studies have shown that at the macro level, with
 increasing numbers of wet and dry cycles and increasing cycle amplitude, the cohesive force and internal friction angle of the loess
 decrease, and the shear strength of the loess deteriorates significantly. At the micro level, with the number of wet and dry cycles
 increasing, the connection between particles changes from surface-to-surface contacts to point-to-point or point-to-surface
 contacts. The edges and corners of the particles decrease, the roundness increases, the large pores gradually decrease, the small
 pores gradually increase, and the fractal dimension gradually increases. In terms of microscopic view, the NMR test shows that
 with increasing numbers of dry-wet cycles, the T2 peak curve increases, the curve width increases slightly, the peak area gradually
 increases, and the porosity increases. From the macroscopic, mesoscopic, and microscopic multiscale analysis, the structure of
 loess is degraded under the action of dry and wet cycles; the strength of the loess is degraded significantly after 0 to 3 cycles and
 then gradually stabilizes. These research results can provide a certain reference value for the management of loess collapse
 geological disasters in semiarid climates.

1. Introduction theoretical basis for the engineering practice of disaster
 prevention and mitigation in the process of project site
In Northwest China, loess is distributed everywhere. selection, construction, and operation in the loess area.
However, due to the complex terrain, vertical and horizontal Many scholars have conducted various studies on the
ravines, harsh environment, and unique climate in the loess effects of dry-wet cycles on soil properties. Ma et al. [3]
area, and under natural and anthropogenic actions, loess is performed X-ray microcomputer tomography on shale and
extremely prone to disasters such as landslides, collapses, Quaternary red clay using 3D microtomography imaging
and soil erosion, which seriously endanger engineering technology to analyze the pore structure changes in the
construction and the safety of people’s lives and property samples at depth under the action of dry-wet cycles. Razouki
and restrict the sustainable development of the local et al. [4] conducted a systematic experimental study on the
economy [1, 2]. This article focuses on water, a key factor strength and deformation of gypsum-rich sand used in
that causes loess collapse, and studies loess bodies through subgrade construction under the action of dry-wet cycles
the evaporation of water, that is, dry-wet cycles; the results and obtained certain results. Pasculli et al. [5] observed the
reveal the mechanism of loess structural degradation from a significant influence of dry-wet cycles on the crushing of
multiscale perspective. The study has important academic pumice and the resulting structural collapse during labo-
value, scientific significance, and essential practical value ratory tests. Wu et al. [6] studied the mechanical properties
and significance for the construction of basic projects in the of improved expansive soil under the action of dry-wet
future. The research results will also provide a more scientific cycles and provided a reference for the construction of
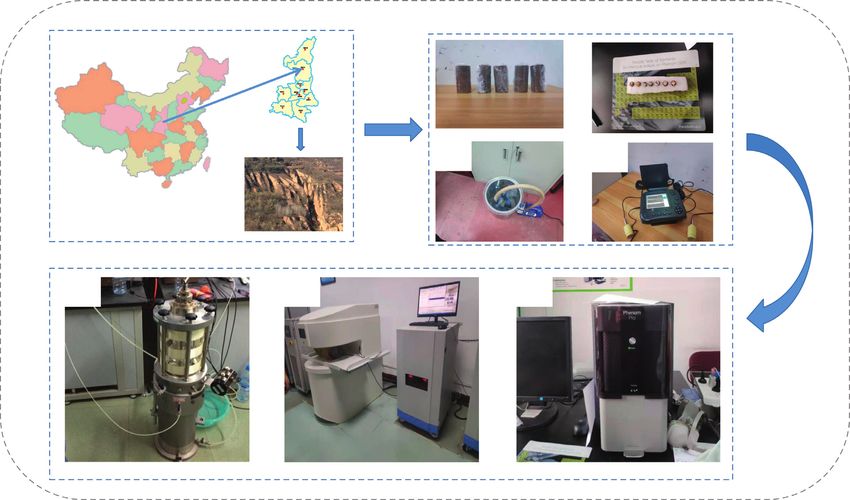
2 Advances in Materials Science and Engineering

roadbeds and other projects. de Oliveira et al. [7] used X-ray loess from the mesostructure. Based on the macroscopic
computed tomography to study the porosity changes in triaxial test, the author used electron scanning microscopy
cultivated soil under the action of dry-wet cycles; Liu et al. (SEM) and nuclear magnetic resonance (NMR) technology
[8] used triaxial strength tests, nuclear magnetic resonance, to analyze the pore structure of loess under different cycles
and scanning electron microscopy on expansive soil under and conducted a multiscale analysis of the changes in the
the action of dry-wet cycles to study the macromechanical mechanical properties of loess under the action of dry-wet
behavior and the microstructure damage to the regularity of cycles from different perspectives. This study aims to provide
soil. a reference for the management of loess collapse geological
 For studying loess, the current research mainly fo- disasters in semiarid areas.
cuses on the mechanical properties of loess under dry-wet
and loading cycles. For example, Ye et al. [9] initially 2. Experimental Procedure
explored the influence of water migration on the strength
of compacted loess and its mechanism under the action of 2.1. Experimental Material. In this article, a landslide loess
dryness and wetness in seasonal frozen soil regions; Chou from Yan’an was used to provide soil samples for laboratory
et al. [10] analyzed the influence of structure, dryness and experiments. The sample taken is the S1 loess from the
wetness, initial moisture content, wet weight, and load middle Pleistocene (Q3) loess sequence. To analyze the
size on the collapsibility coefficient of different structural physical properties of the soil samples, the soil samples taken
loess under the action of dryness and wetness; Su et al. were subjected to laboratory geotechnical experiments, and
[11] used scanning electron microscopy (SEM) to the basic physical properties of the soil samples were ob-
quantitatively analyze the swelling and shrinking de- tained as shown in Table 1.
formation characteristics of undisturbed loess under the
action of wet and dry cycles and the evolution of cracks;
Hu et al. [12] carried out a dry-wet cycle triaxial test 2.2. Experimental Process. The test process is shown in
considering the three relevant factors of dry density, dry- Figure 1. The main test equipment included (a) a negative
wet cycle amplitude, and lower limit water content of a pressure vacuum saturation instrument, (b) an ultrasonic
dry-wet cycle and obtained compacted loess strength testing analyzer, (c) a standard unsaturated soil triaxial test
degradation curves under the influence of the different system produced by the British GDS company, (d) a nuclear
factors; Li et al. [13] conducted a laboratory study on magnetic resonance instrument, and (e) a scanning electron
undisturbed loess and used direct shear tests to analyze microscope.
the changes in shear strength of undisturbed loess under
dry-wet conditions. The results showed that the me- 2.3. Test Plan and Principle. The test plan is designed based
chanical properties of loess under the two conditions on loess from the Luochuan Plateau to study the changes in
greatly deteriorated; Wen Shaojie, Zhang Zelin, and grain pores and test the degradation of loess strength under
Zhang Jun [14–16] studied the mechanical properties of repeated dry-wet cycles.
loess under dynamic action and obtained useful results.
 The actions of water and soil also have certain influences
on the stability of slopes. Tang [17] studied the effect of 2.3.1. Dry-Wet Cycle Test. According to on-site soil
chemical damage by water on the elastic modulus of rock sampling, indoor water content measurement, and data
and found that the influences of the chemical action of an collection, the water content varies greatly (ωmax � 25%
aqueous solution and the rock soil on the elastic modulus of and ωmin � 8%). Therefore, to study the changes in the
rock are closely related. Wang [18] analyzed the regular physical and mechanical properties of loess under the
change in the shear strength of the soil under the action of action of dry-wet cycles, dry-wet cycle tests were carried
water-soil chemistry and obtained the impact of the ion out with different numbers and amplitudes of cycles. The
concentrations in the aqueous solution on the original undisturbed soil sample was taken from the site to the
viscosity of the soil under the action of water. Cohesion and laboratory, and the dripping method and natural air
inherent cohesion have significant weakening effects but drying method were used to change the moisture content
have little effect on the angle of internal friction. Through of the undisturbed soil; a moisture content of 16% was
research on the physical and mechanical properties of clay selected as the control point for the dry-wet cycle tests,
under variations in the water chemical environment, Yan and 0, 1, 2, 3, 4, and 5 dry-wet cycles were conducted and
[19] showed that the variation in the water chemical envi- tested. The quality of the control sample was used to
ronment has an important influence on the mechanical determine the changes in moisture content. When the
properties of clay and proposed to establish a theoretical moisture content reached the control point, a triaxial
framework of soil mechanics based on the coupling of consolidation undrained shear test was performed. To
chemistry and mechanics. In summary, the basic mechanical expedite the test process, an electric constant-tempera-
properties of loess have been studied extensively, and many ture heating and drying oven was added to dry the soil
conclusions have been obtained. The author has also con- samples; the prepared soil samples were placed with
ducted a study on the degradation of the internal structure of initial water content in the temperature-controlled oven,
loess under the action of dry-wet cycles [20]. However, there and the dripping method was then used to evenly
is no deep research on the changes in the pore structure of moisturize the samples at room temperature before
Advances in Materials Science and Engineering 3

 Table 1: Test statistics of various physical and mechanical parameters of Yan’an loess.
 Moisture Natural density Particles Dryness density Liquid Plastic Plastic
Statistics Void ratio e
 content w(%) ρ(g/cm3 ) proportion Gs ρ(g/cm3 ) limit wL limit wP index IP
Max 22.75 1.84 1.28 2.73 1.58 33.4 21.7 10.8
Min 12.81 1.42 0.76 2.71 1.21 26.4 18.6 8.5
Average 16.5 1.58 0.96 2.72 1.38 30.26 20.61 9.45

 (a) (b)

 (c) (d) (e)

 Figure 1: Test process diagram.

drying. This was the first dry-wet cycle; the process was According to the test, multiple sets of triaxial undis-
then repeated to obtain the third and fifth dry-wet cycle turbed soil samples were prepared by the water distribution
soil samples. The schematic diagram of the dry and wet method to obtain samples with optimal moisture content.
cycle process is shown in Figure 2. Using conventional triaxial tests, each group of soil samples
 was subjected to dry-wet cycle tests with different cycle
 numbers and amplitudes under the conditions with con-
2.3.2. Loess Strength Degradation Tests. To fully investigate fining pressuresσ 3 � 100kPa, 200kPa, and300kPa and a
the effect of dry and wet cycles on the strength degradation shear rate of 0.2 mm/min to study the strength and dry-wet
of compacted loess, 4 types of dry and wet cycle paths were cycles of unsaturated loess. The experiments adopted the
set up; the test numbers were a, b, c, and d, and the lower method of the consolidated undrained (CU) shear test. The
limit moisture contents were set to 17.8%, 12.8%, 7.9%, and GDS triaxial instrument was used to perform triaxial tests on
2.9%, respectively; the corresponding dry-wet cycle am- the Luochuan Plateau loess. The dimensions of the con-
plitudes (A) were 6.2%, 11.2%, 16.2%, and 21.2%. The aim ventional triaxial samples were diameter � 3.91 cm and
of this procedure was to simulate the cyclical process of height H � 8.0 cm. To study the regularity of the strength
saturation at different depths (rising water level), dehu- degradation of loess under the action of dry-wet cycles, the
midification (falling water level), resaturation, and further stress-strain curve of unsaturated loess for dry-wet cycles
dehumidification after the completion of compacted loess was studied under the condition of controlled confining
construction. For the saturation of the sample, the vacuum pressure.
saturation method was adopted. The moisture content after
the test was approximately 25%, the difference did not
exceed 0.1%, and the saturation was more than 98%; the 2.3.3. Scanning Electron Microscope Tests. The scanning
drying method (40°C) was used for the dehumidification electron microscope tests used the Phenom Pro desktop
process. scanning electron microscope made by Holland Feiner; the
4 Advances in Materials Science and Engineering

maximum total magnification was 130,000 times, and the stress-strain curve can be changed from weak softening to
vacuum time was less than 1 minute. hardening, and the amplitude of the hardening curve be-
 The soil samples were scanned after different dry-wet comes increasingly obvious. The position of the strain curve
cycles from the initial moisture content, and approximately is lowered, and the variation range of the principal stress
1–3 cm was selected after the dry-wet cycles. The samples difference shows a decreasing trend, indicating that the loess
were fully dried before scanning, and the surface was coated strength is gradually deteriorating; a comparative analysis of
with gold to better reflect the signal. the compacted loess stress-strain curves for different dry-wet
 cycle paths can be obtained. As the number of dry-wet cycles
 increases, the stress-strain curve of each dry and wet cycle
2.3.4. NMR Tests. The nuclear magnetic resonance tests used path moves toward the bottom. Under the same number of
the NMRC12-010V nuclear magnetic resonance pore ana- cycles, the greater the cycle amplitude is, the lower the shear
lyzer introduced by the School of Architecture and Civil strength.
Engineering of Xi’an University of Science and Technology.
According to the principle of low-field NMR, the hydrogen
nucleus is regarded as a good signal carrier. Under the action 3.2. Triaxial Shear Strength of Compacted Loess under Dry Wet
of an external magnetic field, the hydrogen nucleus can be Cycles. To further analyze the changes in the triaxial shear
considered a small magnetic needle. The torque generated by strength of compacted loess under the action of dry-wet
the external magnetic field aligns the spin axis of the hy- cycles, the triaxial shear strength of each cycle path for
drogen nucleus with the direction of the magnetic field. The different numbers of dry-wet cycles is statistically analyzed,
nuclei in the magnetic field are arranged in one direction. and the triaxial shear strength and the dry-wet cycles are
According to quantum mechanics theory, when a hydrogen established. Their relationship “n” is shown in Figure 4.
nucleus is in an external magnetic field, protons are Figure 4 illustrates that, for the same number of dry-wet
decomposed into two energy states: high energy and low cycles, as the confining pressure increases, the shear strength
energy. The difference in energy states means that the of the soil gradually increases. Under the same confining
number of spins parallel to the external magnetic field is pressure, with increasing numbers of initial cycles, the shear
slightly greater than the number of nuclear spins opposite to strength of the soil gradually decreases. Another phenom-
the external magnetic field. The difference between the two enon is clearly observed in the figure. The shear strength
numbers forms the magnetization vector M0, which pro- decreases the most during a dry-wet cycle. When
vides a measurement signal for NMR. Usually, we use NMR σ3 � 100 kPa and the dry-wet cycle path is “a”, after the first
relaxation measurements to express the porosity, pore size dry-wet cycle, the soil shear strength decreases by 11.3%.
distribution, and other information of a porous medium. When the dry-wet cycle path is “b”, the soil shear strength
 The relationship between the pore size in the loess and decreases by 31.7%. When the dry-wet cycle path is “c”, the
the relaxation time T2 is obtained: soil shear strength decreases by 40.2%. When the dry-wet
 1 S cycle path is “d”, the shear strength of the soil decreases by
 � ρ2 . (1) 51.0%; from the 2nd cycle to the 5th cycle, the shear strength
 T2 V Porosity
 tends to be stable.
 The saturated sample that had undergone the dry-wet The figure also shows that the triaxial shear strength of
cycle together with the PVC pipe was placed into the NMR the sample soil is significantly affected by the dry-wet cycle
room for testing, and the test parameters were adjusted. The path (dry-wet cycle amplitude). The triaxial shear strength of
specific parameters were as follows: RF delay different circulation paths increases with the number of dry-
RFD � 0.002 ms; analog gain GF1 � 20 dB; digital gain wet cycles, and its slope of the curve gradually decreases.
DRG1 � 3; 90° pulse width P1 � 34 s; 180° pulse width Before 3 cycles, the decrease is greater; when the number of
P2 � 68 s; preamplification multiple PRG � 1; waiting time cycles is 1, the curve is the steepest, and the slope is the
TW � 2000 ms; echo time TE � 0.21 ms; number of echoes largest. After 3 cycles, the curve tends to become stable.
NGCH � 2000; accumulation times NS � 16; main frequency Comparing and analyzing the different dry-wet cycle paths
sf � 12 MHz; frequency drift ol � 479043.8 Hz. under the same confining pressure and the intensity value
 corresponding to the lowest point of the relationship curve
3. Analysis of Test Results for the number of dry-wet cycles, it can be determined that
 the intensity value of dry-wet cycle path “d” is the smallest,
3.1. Stress-Strain Relationship. The triaxial shear stress- followed by path “c” and path “b”, and path ”a” has the
strain relationship curves for compacted loess with different largest intensity value.
dry-wet cycles and different dry-wet cycle paths are shown in According to the Mohr-Coulomb theory, the shear
Figure 3. Due to space limitations, only the stress-strain strength index, cohesion c, and internal friction angle φ can
curve of each dry-wet cycle path at a confining pressure of be obtained. The relationship between the cohesive force c,
100 kPa is listed here, which represents the stress value of the the internal friction angle φ, and the number of dry-wet
undisturbed loess at a certain strain. cycles n is shown in Figures 5 and 6. Figure 5 indicates that
 The figure shows that under the action of wet and dry the cohesive force of compacted loess decreases sharply and
cycles, with increasing numbers of wet-dry cycles, the stress- then gradually increases with the increase in the number of
strain curve evolves to having no peak point, the shape of the dry-wet cycles, and the curve has an obvious turning point;
Advances in Materials Science and Engineering 5

 performed on the samples at the optimal moisture content
 28 after the 0th, 1st, 3rd, and 5th cycles, and different dry-wet
 conditions were obtained. The T2 spectrum curve under the
 Wet Wet Wet Wet Wet Wet number of cycles is shown in Figure 7.
 Moisture content (%)

 24 Figure 7 shows one higher peak and two lower peaks,
 and the relaxation time at the peak position is concen-
 trated between 1 and 10 ms. After 0 dry-wet cycles, the
 20 curve is the lowest, and the distribution interval is the
 narrowest, indicating that the pores are the smallest at this
 time. With the increase in the number of dry-wet cycles,
 16 the peak of the T2 spectrum curve and the position of the
 Dry Dry Dry Dry Dry
 higher peak clearly move upward. This wave peak exhibits
 slight fluctuations. In the 1st and 3rd dry-wet cycles, the
 12 curve peak shifts greatly, and the distribution becomes
 0 1 2 3 4 5
 wider. The total integrated area under the T2 spectrum
 Dry-wet cycles (times)
 curve is the total pore volume. This relationship can be
 Moisture content analyzed. With 1 to 3 wet-dry cycles, the pore changes are
 more obvious, and the pore changes then tend to become
Figure 2: Schematic diagram of the dry and wet cycle process.
 stable, indicating that the first three wet and dry cycles
 significantly change the pore structure of the loess,
the relationship between the turning point and the number resulting in obvious degradation.
of wet and dry cycles is evident. The curve before the turning According to the principle of NMR, the T2 relaxation is
point is steeper and has a larger slope than the curve beyond related to the pore size of compacted ancient soil. Therefore,
the turning point. The cohesion and internal friction angle considering the structural characteristics of the test block,
change greatly with 0 to 3 cycles. After 3 dry and wet cycles, the surface relaxation strength is 3.0 μm/s. Assuming that the
the cohesion forces for pathways “a”, “b”, “c”, and “d” pores in the test block are ideally spherical and (S/V)
decrease by 14.19 kPa, 30.14 kPa, 65.2 kPa, and 79.66, re- pore � 3/r, the relationship between pore radius and relax-
spectively. The slope of the curve between the cohesive force ation time is as follows:
and internal friction angle of loess and the number of dry-
wet cycles is gradually reduced, and the slope of the curve r � 9.0T2 . (2)
slowly becomes flat after 3 cycles.
 The main reason for the deterioration of the cohesive force For the sake of comparison, this study follows Lei [22] to
is that the adsorption strength continuously decreases with the classify and calibrate the microscopic pores of loess. The
dry-wet cycles, and the adsorption strength is closely related to pore sizes are divided into four categories: large pores
the pore characteristics of the soil. From a mesoscopic point of (D > 32 µm), medium pores (8 µm ≤ D ≤ 20 µm), small pores
view, the matrix suction in the soil is caused by the surface (2 µm)≤D < 8 µm), and micropores (D < 2 µm). According to
tension of the liquid bridges. During the dehumidification the above formula, combined with the spectrum area, the
process, the moisture content of the soil decreases, and the percentages of each pore size range are calculated, and the T2
volume of the liquid bridges connecting the soil particles de- spectrum relaxation time distribution of the sample can then
creases. The volume of the liquid bridges connecting the soil be converted into the pore size distribution. According to the
particles decreases, and the matrix suction becomes larger. pore sizes, the pore size distribution map can be drawn. To
When the soil is cracked by the critical matrix suction, the liquid more intuitively reflect the regular pore size change in the
bridges between the soil particles are broken, resulting in cracks soil and the pore size distribution of the pores, the test soil
in the soil [21]. An increase in the cyclic amplitude prolongs the pore sizes are divided into (0, 2), [2, 8], (8, 32], and (32, 6000]
cracking process, resulting in an increase in the degrading effect (unit: μm, the same below), for a total of 4 groups. This
of cohesion. When the water content is relatively low, the calculation can obtain the average content distributions of
suction force of the matrix is very large, and as the water content various pore sizes inside the soil samples after different
decreases, the possibility of liquid bridge rupture gradually numbers of dry and wet cycles, as shown in Figure 8.
increases, resulting in an increasing number of cracks. For the Figure 8 shows that, with increasing numbers of dry-wet
internal friction angle, since the wear and fragmentation of cycles, the micropores gradually decrease, the small pores
particles are the main causes of its deterioration, it is mainly fluctuate irregularly, the medium-sized pores gradually in-
controlled by the flux of the change in water content, so it is crease, and the number of large pores is very low. The reason
significantly impacted by the cycle amplitude. is that after the dry-wet cycles, the micropores and small
 pores gradually transform into small- and medium-sized
 pores. The effect of water in the humidification process
3.3. Evolution of Loess Pore Cumulative Volume Distribution causes the small particles on the surfaces of large particles to
under the Action of Dry-Wet Cycles. To further explore the be lost with the flow of water, and the initial structure is
differences in the evolution of the pore structure in the loess damaged. The pores continue to evolve into small- and
samples after several dry-wet cycles, NMR tests were medium-sized pores, increasing the number of medium-
6 Advances in Materials Science and Engineering

 600 600

 500 500

 400 400

 σ1 – σ3 (kPa)
 σ1 – σ3 (kPa)

 300 300

 200 200

 100 100

 0 0
 0 2 4 6 8 10 12 14 16 0 2 4 6 8 10 12 14 16
 ε (%) ε (%)

 n=0 n=3 n=0 n=3
 n=1 n=4 n=1 n=4
 n=2 n=5 n=2 n=5
 (a) (b)
 600 600

 500 500

 400 400
 σ1 – σ3 (kPa)

 σ1 – σ3 (kPa)

 300 300

 200 200

 100 100

 0 0
 0 2 4 6 8 10 12 14 16 0 2 4 6 8 10 12 14 16
 ε (%) ε (%)
 n=0 n=3 n=0 n=3
 n=1 n=4 n=1 n=4
 n=2 n=5 n=2 n=5
 (c) (d)

Figure 3: Stress-strain curves under different dry-wet cycle paths at a confining pressure of 100 kPa. (a) Dry and wet cycle path a. (b) Dry
and wet cycle path b. (c) Dry and wet cycle path c. (d) Dry and wet cycle path d.

sized pores. In addition, as tiny particles and soluble salts on presents results for only 0 and 5 times. Electron micrographs
the surface of the pellets are washed away, the number of magnified 3000 times after the dry and wet cycles are shown
pores inside the pellets increases, and the total porosity in Figure 9.
increases. During the dehumidification process, the soil The pores and cracks analysis system (PCAS) software is
shrinks. Dry shrinkage develops cracks and microcracks in used for microscopic quantitative analysis of the particle
the soil, which increase the porosity of the compacted loess. pores and fracture images [23]. After the SEM image is
Figure 7 shows that the spectrum area increases with in- vectorized by the software, the changes in the abundance,
creasing numbers of wet and dry cycles. average shape factor, and fractal dimension of the shape
 distribution during the dry and wet cycles are analyzed to
 reveal the changes in the soil structure at the micro level.
3.4. Granular Structure Effect under the Action of Dry-Wet
Cycles. To analyze the changes in the particle structure of the
loess samples after several cycles of drying and wetting, SEM 3.4.1. Soil Abundance. The ratio of the short axis of a soil
experiments were performed on the samples at the optimal particle to its long axis is the pore abundance C [24], and the
moisture content after 0, 1, 3, and 5 cycles. This article expression for soil particle abundance is
Advances in Materials Science and Engineering 7

 1000 1000

 900 900

 800 800
 σ1 – σ3 (kPa)

 σ1 – σ3 (kPa)
 700 700

 600 600

 500 500

 400 400

 300 300

 200 200
 0 1 2 3 4 5 0 1 2 3 4 5
 Dry-wet cycles (times) Dry-wet cycles (times)

 σ3 = 100kPa σ3 = 100 kPa
 σ3 = 200kPa σ3 = 200 kPa
 σ3 = 300kPa σ3 = 300 kPa

 (a) (b)

 1000 1000

 900 900

 800 800

 700 700
 σ1 – σ3 (kPa)

 σ1 – σ3 (kPa)

 600 600

 500 500

 400 400

 300 300

 200 200
 0 1 2 3 4 5 0 1 2 3 4 5
 Dry-wet cycles (times) Dry-wet cycles (times)

 σ3 = 100kPa σ3 = 100 kPa
 σ3 = 200kPa σ3 = 200 kPa
 σ3 = 300kPa σ3 = 300 kPa

 (c) (d)

Figure 4: The relationships between the triaxial shear strength and the number of dry-wet cycles for different circulation paths. (a) Dry and
wet cycle path a. (b) Dry and wet cycle path b. (c) Dry and wet cycle path c. (d) Dry and wet cycle path d.

 B approximately 65% to 70.4% of the total, which shows that
 C� . (3) the overall shape of the pores tends to be oblate and qua-
 L
 sispherical, with few elongated and round pores. As the dry-
 In the formula, C, B, and L represent the pore abun- wet cycles progress, the abundance gradually increases in the
dance, pore minor axis length, and pore major axis length, range from 0.4 to 0.7, and the other values generally show a
respectively, where the C value ranges between 0 and 1. The decreasing trend, indicating that the dry-wet cycles increase
closer the C value is to 1, the more circular the pores are; the roundness of soil particles through the effect of water on
otherwise, the pores tend to be elongated. the edges and corners of the particles. The obvious scouring
 According to Figure 10, the distribution of pore abun- effect, combined with the friction between particles, pro-
dance values before and after shearing in each group of motes changes in the abundance of particle units.
pictures basically shows a normal distribution; the values are
mainly concentrated between 0.4 and 0.9, accounting for
approximately 84.5% to 90.5% of the total. Among them, the 3.4.2. Average Shape Factor of Microscopic Pores of Soil
distribution is mostly between 0.5 and 0.8, accounting for Samples. The average shape factor [25] is denoted by F:
8 Advances in Materials Science and Engineering

 120
 2000

 100
 1500

 Signal amplitude
 Cohesion (kPa)

 80
 1000
 60

 500
 40

 0
 20
 0.01 0.1 1 10 100 1000 10000
 0 1 2 3 4 5 Relaxation time (ms)
 Dry-wet cycles (times)
 Dry-wet cycle Dry-wet cycle
 Dry-wet cycles Dry-wet cycles (0 times) (3 times)
 (path a) (path c)
 Dry-wet cycle Dry-wet cycle
 Dry-wet cycles Dry-wet cycles (1 times) (5 times)
 (path b) (path d)
 Figure 7: T2 spectrum distribution under different dry-wet cycles.
Figure 5: The relationship between wet and dry cycles and
cohesion.

 60
 32
 50
 Percentage of pores (%)

 30
 Internal friction angle (°)

 28 40

 26 30
 24
 20
 22

 20 10

 18 0
 (0, 2] [2, 8) [8, 32) [32, 6000)
 16 Aperture (µ)
 0 1 2 3 4 5
 Dry-wet cycles (times) Dry-wet cycle Dry-wet cycle
 (0 times) (3 times)
 Dry-wet cycles Dry-wet cycles
 Dry-wet cycle Dry-wet cycle
 (path a) (path c)
 (1 times) (5 times)
 Dry-wet cycles Dry-wet cycles
 (path b) (path d) Figure 8: Pore content distribution of each group.
Figure 6: The relationship between the number of wet and dry
cycles and the angle of internal friction.
 after 3 cycles. The reason why 0 to 3 cycles have great impacts
 on the original structure of the soil is analyzed. The struc-
 ni�1 Fi tures and shapes of the soil particles change greatly, and the
 F� . (4) roundness of the soil increases greatly. The original aggre-
 n
 gate structure of the soil is also destroyed, and damage
 In the formula, “F” is the pore morphology coefficient, occurs. The attached debris begins to leave the aggregates,
“P” is the circumference of a circle with the same area as the causing the soil particle structure to become chaotic. After 3
pore, and “S” is the actual circumference of the pore. cycles, the structural damage tends to be stable, and the
 Figure 11 shows the changes in the average shape co- shape coefficient changes a little.
efficient after different dry-wet cycles. The figure illustrates
that, with increasing numbers of dry-wet cycles, the average
shape coefficient curve continuously decreases; the decrease 3.4.3. Change in Fractal Dimension of Morphological
is greater before 3 cycles, and the curve tends to stabilize Distribution. The linear relationship between the equivalent
Advances in Materials Science and Engineering 9

 (a) (b)

 Figure 9: SEM images after different numbers of wet and dry cycles: (a) 0 cycles and (b) 5 cycles.

 40 0.63

 35
 0.62
 30
 Average shape factor

 0.61
 Percentage content

 25
 0.60
 20

 15 0.59

 10 0.58

 5
 0.57
 0
 0 1 2 3 4 5
 0.1~0.2

 0.2~0.3

 0.3~0.4

 0.4~0.5

 0.5~0.6

 0.6~0.7

 0.7~0.8

 0.8~0.9

 Dry-wet cycles (times)

 Soil particle abundance Average shape factor

 Dry-wet cycle (0 times) Dry-wet cycle (3 times) Figure 11: Change in the average shape coefficient after different
 Dry-wet cycle (1 times) Dry-wet cycle (5 times) wet and dry cycles.

Figure 10: Variations in soil particle abundance under the action of
dry-wet cycles. implies that, during the dry-wet cycles of the unearthed
 samples, the connections between soil particles are broken
 due to the dry-wet cycles, and the cementation is weakened.
area and the perimeter of the fractal dimension of the shape The original cemented structure is continuously destroyed,
distribution is calculated: decomposed, and polished to form irregular particles. Thus,
 the particle fractal dimension changes.
 D
 Log(Perimeter) � × Log(Area) + C. (5)
 2
 4. Multiscale Mechanism Analysis of Loess
 In the formula, Perimeter is the equivalent perimeter of Collapse under the Action of Dry-Wet Cycles
the pore, Area is the equivalent area of the pore, “D” is the
fractal dimension of the pore shape distribution, and “C” is The scale effect means that a certain spatial structural
the fitting constant. characteristic can be expressed only at a certain sampling
 Figure 12 is a graph showing the relationship between scale. Different research scales can determine the strength
the number of dry-wet cycles and the fractal dimension. degradation of loess under different numbers of dry-wet
 The figure reveals that the fractal dimension decreases cycles. On the microscopic scale, the pores of loess samples
with increasing numbers of dry and wet cycles; the decrease that have not been subjected to dry-wet cycles are small and
is the largest after the first cycle, and the decreasing trend unevenly distributed. The minerals are connected directly
tends to become stable after the third cycle. This relationship and firmly. After the dry-wet cycles, the connections
10 Advances in Materials Science and Engineering

 1.40

 1.35

 Fractal dimension
 1.30

 1.25

 1.20
 0 1 2 3 4 5
 Dry-wet cycles (times)

 Fractal dimension
 Figure 12: The relationship between the number of wet and dry cycles and the fractal dimension.

 Microporosity Intergranular Skeleton Small pores Small pores Mesopore Particle breakage
 pores particles

 Figure 13: Schematic diagram of the fine microstructure of loess before and after dry and wet cycles.

between loess particles gradually change from surface-to- dehumidification process, the soil shrinks. Dry shrinkage
surface contacts and surface-to-edge contacts to edge-to- develops cracks and microcracks in the soil, which increases
edge contacts and point-to-edge contacts. On the micro- the porosity of the compacted loess. Under the action of the
scopic scale, according to the NMR analysis, the pores and dry-wet cycles, the tiny pores gradually turn into small- and
micropores of the samples are transformed into small pores medium-sized pores, the soil particles are partially broken
and small pores into medium-sized pores after the sample under the action of water, and the overall porosity increases,
undergoes wet-drying cycles. The overall porosity increases, changing the loess structure, which in turn reduces the
indicating that the strength of the soil is degraded and at- macroscopic strength of the loess.
tenuated under the action of the dry-wet cycles; the mac- Under the action of water, the physical and mechanical
roscopic triaxial tests can directly show that the cohesive properties of loess undergo remarkable changes, but the
force and internal friction angle of the loess after the dry-wet generation of cracks in the loess body is a precondition for
cycles decrease, and the intensity of shear resistance is re- these changes. Loess slope construction generally occurs in
duced. From the micro-, meso-, and macroscales, the in- the dry season. The surface of the newly excavated slope is
ternal structure of the loess is damaged and deteriorates affected by weather conditions such as wind and sun. The
under the action of dry and wet cycles. water on the surface of the slope continuously evaporates,
 The changes in soil particles, pores, and clots before and and the water inside the slope continuously migrates to the
after the dry-wet cycles are drawn as a schematic diagram in surface of the slope. The moisture within a certain range of
Figure 13. The liquid bridges between soil particles break, the slope surface continues to decrease, and the matrix
resulting in cracks in the soil; on the other hand, as the suction of the soil continually increases, causing the soil to
surfaces of the aggregates are washed clear of tiny particles shrink and deform. When the generated stress is greater
and soluble salts, the number of pores inside the aggregates than the strength of the soil, cracks form inside the soil.
increases, and the total porosity increases. During the The generation of loess cracks involves physical and
Advances in Materials Science and Engineering 11

chemical interactions between water and soil. Due to the 5. Conclusions
presence of strong hydrophilic clay minerals such as
montmorillonite, illite, and kaolinite in loess and given the (1) After many triaxial tests with different numbers of
effects of collapsibility and shrinkage during water loss, dry and wet cycles, the stress-strain curve hardening
rifts form. The formation of vertical joints in loess is phenomenon is obvious. Under the action of the first
mainly due to the uneven thickness of the loess that reflects 3 dry-wet cycles, the cohesion and the angle of in-
undulating topography and to the uneven collapse and ternal friction decrease sharply, and the shear
deformation under the action of water, which leads to the strength of the loess deteriorates significantly; the
generation of internal joints. As the loess continues to loess stabilizes after 3 cycles. Given different circu-
accumulate, when the top pressure increases, the soil at the lation paths, for circulation path d (large circulation
top of the joint fissure is stressed. When the strength of the amplitude), the shear strength of the soil is reduced
soil is reached, the inner joint fissure expands in the by 51%, and the strength deterioration of the loess is
vertical direction to form a vertical joint. Under the action the most significant.
of water, the slope gradually becomes saturated from the (2) On the mesoscale, using nuclear magnetic resonance
surface to the interior of the slope. Under the action of the analysis, during the processes of drying and wetting,
water wedge pressure, the original fissures open, expand, the tiny particles on the surfaces of soil particles are
and deepen. When the moisture content in loess increases, lost with the flow of water; the initial structure is
the thickness of the combined water increases, and the damaged, and the micro- and small pores evolve to
distance between the clay particles increases; the van der small- and medium-sized pores. The number of
Waals force, the water glue connection and the capillary medium-sized pores increases; in addition, as the
force between the particles decrease, while the water-re- tiny particles and soluble salts on the surfaces of the
sistant cement softens and the connection strength de- pellets are washed away, the number of pores inside
creases. When the moisture content of the soil sample the pellets increases, and the total porosity increases.
increases during a dry-wet cycle, the volume of bound (3) Microscopically, using scanning electron microscopy,
water and gravitational water entering the loess clay with increasing numbers of dry and wet cycles, the
particles also increases, and the distance between the clay internal structural units of loess change significantly,
particles wedged by water increases, which leads to an and the particle connections weaken. The connections
increase in the water content between the particles. The gradually change from surface-to-surface contacts and
faster the force decreases, the greater the softening degree surface-to-edge contacts to edge-to-edge contacts and
of the water-resistant cement, and the greater the reduc- edge-to-point contacts. The integrity of the loess con-
tion in the friction coefficient between grains and the tinues to decrease, and internal passages continue to
friction between grains; these changes lead to an increase develop.
in the shear strength of the loess sample. When the hy- (4) After multiscale analysis of the loess samples, the
drostatic pressure and hydrodynamic pressure generated generation of loess cracks can be preliminarily de-
by the humidification process are greater than the tensile termined to involve physical and chemical interac-
strength of the soil, on the one hand, new cracks are tions between water and soil. Due to the presence of
generated within the soil; on the other hand, these cracks strong hydrophilic clay minerals such as montmo-
are connected to each other, resulting in destruction of the rillonite, illite, and kaolinite in the loess, cracks are
integrity and uniformity of the soil. At the same time, the formed under the effects of water soaking and
cohesive force between soil particles is weakened, resulting shrinking. The development of vertical joints in loess
in structural damage and reduced soil strength. The is mainly due to the uneven thickness of the loess
Luochuan loess has high contents of clay particles, mainly because of the undulating topography and to the
montmorillonite, illite, and kaolinite, and these clay uneven collapse and deformation under the action of
minerals disintegrate. The greater the clay content, the water, which leads to the generation of internal
greater the water absorption of the soil, the greater the joints.
moisture change, and the greater the disintegration.
During the humidification process, the easily disintegrated
particles of the loess clay minerals swell, disintegrate, and
 Data Availability
break. Due to the uneven distribution of mineral com- The data used to support the findings of this study are
ponents, structures, and water aggregates in the loess body, available from the corresponding author upon request.
the generation of microcracks is aggravated, and such
microcracks inevitably cause stress concentrations in the Conflicts of Interest
soil and further accelerate the development and connec-
tion of cracks. In this way, the humidification and de- The authors declare that they have no conflicts of interest.
humidification processes near the surface of the slope
continue to cyclically change, the shear strength of the Acknowledgments
slope continuously decreases, and the cracks in the soil
continue to expand. When a certain dominant surface in The authors gratefully acknowledge the financial support
the soil is penetrated, the loess slope collapses. from the National Natural Science Foundation of China
12 Advances in Materials Science and Engineering

(grant no. 42072319) and the Key Science and Technology loess in Haidong area,” Chinese Journal of Geotechnical En-
Program of Shaanxi Province (grant no. 2017ZDXM-SF- gineering, vol. 41, no. S2, pp. 137–140, 2019.
082). [15] Z. L. Zhang, S. R. Wu, H. M. Tang, T. Wang, and P. Xing,
 “Dynamic characteristics and microcosmic damage effect of
 loess and mudstone,” Chinese Journal of Rock Mechanics and
References Engineering, vol. 36, no. 5, pp. 1256–1268, 2017.
 [16] J. Zhang, J. J. Zheng, W. Z. Cao, and H. J. Lai, “Dynamic
 [1] D. Sh. Liu, Loess and the Environment, Science Press, Beijing, characteristics of saturated compacted loess under cyclic
 China, 1985. loads,” Chinese Journal of Geotechnical Engineering, vol. 35,
 [2] P. D. Qiao and Z. J. Li, Engineering Geology in Loess Area, no. S1, pp. 322–327, 2013.
 China Water Conservancy and Hydropower Press, Beijing, [17] L. S. Tang and S. J. Wang, “Discussion on the mechanism and
 China, 1994. quantitative method of rock water chemical damage[J],”
 [3] R. M. Ma, Ch. F. Cai, Zh. X. Li et al., “Evaluation of soil Chinese Journal of Rock Mechanics and Engineering, vol. 21,
 aggregate microstructure and stability under wetting and no. 3, pp. 314–319, 2002.
 drying cycles in two Ultisols using synchrotron-based X-ray [18] J. Wang, P. Cao, Y. L. Zhao, and H. B. Chai, “Influence of
 micro-computed tomography,” Soil and Tillage Research, chemical action of water-soil on soil shear strength[J],”
 vol. 149, pp. 1–11, 2015, ISSN 0167-1987. Journal of Central South University (Science and Technology),
 [4] S. S. Razouki and M. Bushra, “Salem, Impact of soaking–drying vol. 41, no. 1, pp. 245–250, 2010.
 cycles on gypsum sand roadbed soil,” Transportation Geotechnics, [19] R. T. Yan, Z. T. Zeng, W. Q. Xu, Z. T. Zeng, H. Miao, and
 vol. 2, pp. 78–85, 2015, ISSN 2214-3912. C. F. Wei, “Research progress on the physical and mechanical
 [5] A. Pasculli, N. Sciarra, L. Esposito, and A. W. Esposito, properties of clay under the variation of hydrochemical en-
 “Effects of wetting and drying cycles on mechanical properties vironment,” Journal of Yangtze River Scientific Research In-
 of pyroclastic soils,” Catena, vol. 156, pp. 113–123, 2017, ISSN stitute, vol. 31, no. 6, pp. 41–47, 2014.
 0341-8162. [20] W. J. Ye, Y. Bai, C. Y. Cui, and X. Duan, “Deterioration of the
 [6] Y. K. Wu, K. J. Shi, Y. Han, T. Han, J. L. Yu, and D. D. Li, internal structure of loess under dry-wet cycles,” Advances in
 “Experimental study on strength characteristics of expansive Civil Engineering, vol. 2020, Article ID 8881423, 17 pages,
 soil improved by steel slag powder and cement under dry–wet 2020.
 cycles,” Iranian Journal of Science and Technology, Transac- [21] S. H. Zheng, J. L. Jin, H. L. Yao, and X. R. Ge, “Analysis of
 tions of Civil Engineering, 2020. initial cracking behavior of expansive soil due to evaporation,”
 [7] J. A. T. de Oliveira, A. Fabio, M. Cássaro, and L. F. Pires, Rock and Soil Mechanics, vol. 27, no. 12, pp. 2229–2233, 2006.
 “Estimating soil porosity and pore size distribution changes [22] X. Y. Lei, “Pore distribution characteristics of longdong loess
 due to wetting-drying cycles by morphometric image anal- in northern Shaanxi,” Chinese Science Bulletin, no. 3,
 ysis,” Soil and Tillage Research, vol. 205, 2021 ISSN 0167-1987, pp. 206–209, 1985.
 Article ID 104814. [23] C. Liu, B. Shi, J. Zhou, and C. Tang, “Quantification and
 [8] K. Liu, W. J. Ye, H. J. Gao, and Q. Dong, “Multi-scale effects of characterization of microporosity by image processing, geo-
 mechanical property degradation of expansive soils under metric measurement and statistical methods: application on
 drying-wetting environments,” Chinese Journal of Rock Me- SEM images of clay materials,” Applied Clay Science, vol. 54,
 chanics and Engineering, vol. 39, no. 10, pp. 2148–2159, 2020. no. 1, pp. 97–106, 2011.
 [9] W. J. Ye, Y. Q. Chen, D. F. Zhang, and Y. Bai, “Macro and [24] R. L. Hu, “Quantitative research progress of clay micro-
 micro experimental study on the influence of moisture mi- structure,” in Proceedings of the Fifth National Engineering
 gration on the strength of compacted loess under freeze- Geology Conference, vol. 6, Engineering Geology Committee
 thaw,” China Journal of Highway and Transport, vol. 1-12 of Chinese Geological Society, Hui County, China, 1996.
 http://kns.cnki.net/kcms/detail/61.1313.U.20200929.1323. [25] Q. S. Meng, C. Yang, X. Z. Xu, X. W. Lei, and S. L. Sui,
 004.html. “Analysis of microstructure of soft clay before and after its
[10] Y. L. Chou, S. S. Jia, Q. H. Zhang, W. Cao, and Y. Sheng, “The improvement with dynamic consolidation by drainage,” Rock
 influence of freeze-thaw action on loess collapsibility coeffi- and Soil Mechanics, no. 7, pp. 1759–1763, 2008.
 cient considering soil structure,” Rock and Soil Mechanics,
 vol. 39, no. 8, pp. 2715–2731, 2018.
[11] L. J. Su, Q. Zhao, H. Liu, W. J. Qian, J. T. He, and J. X. Yang,
 “Swelling and shrinkage behaviors and evolution law of crack
 morphology of undisturbed loess during wetting-drying cy-
 cles,” Journal of Tianjin University (Science and Technology),
 vol. 54, no. 3, pp. 255–267, 2021.
[12] Ch. M. Hu, Y. L. Yuan, X. Y. Wang, Y. Mei, and Zh. Liu,
 “Experimental study on strength deterioration model of
 compacted loess under wetting-drying cycles,” Chinese
 Journal of Rock Mechanics and Engineering, vol. 37, no. 12,
 pp. 2804–2818, 2018.
[13] L. Li, K. Zhang, Q. L. Zhang et al., “Experimental study on the
 loess strength degradation characteristics under the action of
 dry-wet and freeze- thaw cycles,” Journal of Glaciology and
 Geocryology, vol. 38, no. 4, pp. 1142–1149, 2016.
[14] Sh. J. Wen, W. Y. Zhang, and C. Q. Zeng, “Experimental study
 on dynamic shear modulus and damping ratio of undisturbed
You can also read