Seasonal Rainfall Variability in Ethiopia and Its Long-Term Link to Global Sea Surface Temperatures - MDPI
←
→
Page content transcription
If your browser does not render page correctly, please read the page content below
water
Article
Seasonal Rainfall Variability in Ethiopia and Its
Long-Term Link to Global Sea Surface Temperatures
Asmaa Alhamshry 1,2 , Ayele Almaw Fenta 1, * , Hiroshi Yasuda 1 , Reiji Kimura 1 and
Katsuyuki Shimizu 3
 1   Arid Land Research Center, Tottori University, 1390 Hamasaka, Tottori 680-0001, Japan;
     D17A4111U@edu.tottori-u.ac.jp (A.A.); hyasd@tottori-u.ac.jp (H.Y.); rkimura@tottori-u.ac.jp (R.K.)
 2   National Research Centre, 33 Elbehooth Street, Dokki 12622, Egypt
 3   Faculty of Agriculture, Tottori University, 4-101 Koyama-cho Minami, Tottori 680-8553, Japan;
     shimizu@tottori-u.ac.jp
 *   Correspondence: ayelealmaw@tottori-u.ac.jp

 Received: 26 November 2019; Accepted: 19 December 2019; Published: 21 December 2019

 Abstract: Investigating the influence of sea surface temperatures (SSTs) on seasonal rainfall is a crucial
 factor for managing Ethiopian water resources. For this purpose, SST and rainfall data were used to
 study a wide range of inhomogeneous areas in Ethiopia with uneven distribution of rainfall for both
 summer (1951–2015) and spring (1951–2000) seasons. Firstly, a preliminary subdivision of rainfall
 grid points into zones was applied depending on spatial homogeneity and seasonality of rainfall.
 This introduced new clusters, including nine zones for summer rainfall peak (July/August) and five
 zones for spring rainfall peak (April/May). Afterward, the time series for each zone was derived by
 calculating the rainfall averaged over grid points within the zone. Secondly, the oceanic regions that
 significantly correlated with the Ethiopian rainfall were identified through cross-correlations between
 rainfalls averaged over every homogeneous zone and the monthly averaged SST. For summer rainfall
 as a main rainy season, the results indicated that the Gulf of Guinea and southern Pacific Ocean had
 a significant influence on rainfall zones at a lag time of 5–6 and 6–7 months. Besides, for summer
 rainfall zones 8 and 9 at lag time 5–6 months, the common SST regions of the southern Pacific Ocean
 showed the opposite sense of positive and negative correlations. Thus, the difference in SSTs between
 the two regions was more strongly correlated (r ≥ 0.46) with summer rainfall in both zones than others.
 For the spring season, the results indicated that SST of the northern Atlantic Ocean had a strong
 influence on spring rainfall zones (3 and 5) at a lag time 6–7 months, as indicated by a significant
 correlation (r ≥ −0.40). Therefore, this study suggests that SSTs of southern Pacific and northern
 Atlantic oceans can be used as effective inputs for prediction models of Ethiopian summer and spring
 rainfalls, respectively.

 Keywords: teleconnections; sea surface temperature (SST); cross-correlation; peak rainfall; arid regions

1. Introduction
     Globally, rainfall variability across time and space affects all aspects of human activity, especially
agricultural economies and social activities. In particular, rainfall is the most significant meteorological
parameter in Ethiopia, as approximately 85% of the Ethiopian labor force is employed in rain-fed
agriculture which highly depends on low or high amounts of rainfall availability vital for crop
production [1]. Moreover, the Ethiopian Electric and Power Corporation (EEPCo) declared that the
local hydropower contributed to more than 98% of the energy production in 2005, 2006, and 2007 [2].
     The geographical location and topographic complexity of Ethiopia produce high rainfall variability
in the region across space and time [3]. Spatial variations include the rainfall seasonal cycle, amount,

Water 2020, 12, 55; doi:10.3390/w12010055                                           www.mdpi.com/journal/water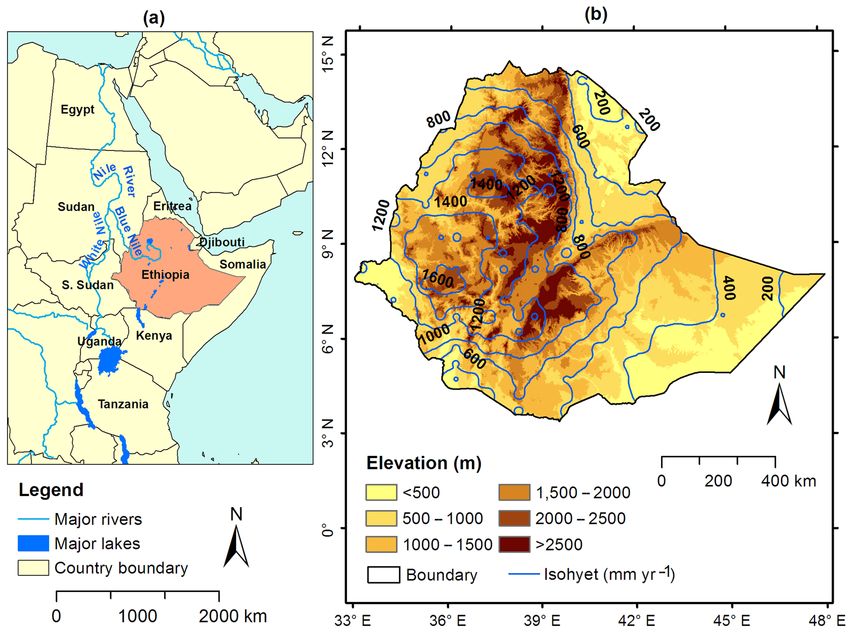
Water 2020, 12, 55                                                                                   2 of 19

onset, and cessation times, and length of growing season [3,4], but sometimes, rainfall can be temporally
varied from days to decades in terms of the direction and magnitude of rainfall trends over regions and
seasons [5,6]. Moreover, these spatiotemporal variations in rainfall are attributed to, in Ethiopia, the
variable altitudes [3] and over the Pacific, Atlantic, and Indian oceans [7–9], the variable sea surface
temperatures (SSTs), including the interannual and interseasonal variations in the strength of monsoon
over the Arabian Peninsula [4,7,8].
      Diro et al. in 2011 [2] described the highlands of Ethiopia to exhibit three cycles of seasonal
rainfall: spring mid-rainy season (February–May), summer rainy season (June–September), and dry
season (October–January), locally known as Belg, Kiremt, and Bega seasons, respectively. In addition,
Korecha and Barnston [9] investigated the climatological factors influencing rainfall over the region:
(i) migration of the intertropical convergence zone (ITCZ) meridionally; (ii) warm lows formed over
the Arabian landmasses and Sahara; (iii) formation of sub-tropical high pressure over the Azores;
(iv) flow of cross-equatorial moisture from the southern, central, and equatorial parts of the Indian
Ocean, tropical Africa, and Atlantic Ocean, respectively; (v) flow of the upper-level tropical easterly jet
over Ethiopia; and (vi) low-level Somali jet.
      Different studies have shown that SST can provide crucial predictive information regarding
hydrological variability in different regions of the globe [10–12]. For instance, most previous
studies [1,2,4,7–10,13,14] have focused only on addressing the linkage between summer rains
(June–September) that contribute to about 65–95% of the total annual rainfall in Ethiopia [15] and
global SSTs. Generally, the majority of previous studies relied on SST as a main predictor of Ethiopian
seasonal rainfall. For example, El Niño/Southern Oscillation (ENSO) as a large-scale phenomenon has a
significant influence on the interannual variability of Ethiopian rains [13,16,17], while the effect of SSTs
of Pacific Ocean, Indian Ocean, and Gulf of Guinea on the summer rainfall of Ethiopia was indicated
in [2,18,19]. Meanwhile, low-level winds from the Atlantic and Indian oceans influenced rainfall of
summer (Kiremt) season [7,8,14]. A few of these studies indicated some correlations between SSTs over
Gulf of Guinea and southern Atlantic Ocean and summer rainfall over Ethiopia [2,4,7,8]. Moreover,
associations between the spring rains (March–May) as a main rainfall season over the southern part of
Ethiopia and SST are much less investigated. For example, two studies only [20,21] used SST anomalies
from the Pacific, Indian, and Atlantic oceans to predict spring rainfall.
      Generally, the majority of previous studies imply that the teleconnections between SST and
Ethiopian rainfall are complicated on both spatial and temporal scales and still not well investigated.
Therefore, the objective of this study is directed toward more understanding the characteristics of
interannual variability of rainfall in the country and investigating clearly the influence of global SSTs
on Ethiopian rainfall peaks at various regions and seasons (summer and spring), to reinforce the
skill of rainfall predictions that would be valuable for operations of reservoirs [22], assessment and
allocation of water resources [23,24], and for mitigation of disasters related to rainfall such as flooding
and drought [25]. Also, better understanding of the rainfall variability plays a key role in several
applications including hydrological analysis [26–31] and soil erosion risk assessment [32–36].
      For these aforementioned purposes, based on the Climate Research Unit (CRU) database of rainfall
and SST data over the period 1951–2015, it would be valuable to divide Ethiopia into homogenous
rainfall zones due to high spatial variability of rainfall over the country. Different previous studies have
relied on principal component analysis for zonation [37,38], but this technique delivered no significant
results in case of complex variability of rainfall, as in Ethiopia [39]. For Ethiopia, there is no previous
study for comprehensive regional zoning depending on spatial patterns of teleconnections for various
seasons of rainfall. Only the summer rainfall seasons (June–September) were regionally classified
in previous studies [1,2,13] based on interannual correlations of rainfall amounts and homogenous
annual cycles of rainfall from rain gauges.
      In this regard, this study considered two main seasons (summer and spring) of rainfall over
Ethiopia to define the homogenous rainfall zones based on SST to rainfall teleconnections besides other
factors mentioned in a previous study [13] such as standardized rainfall cross-correlations, annual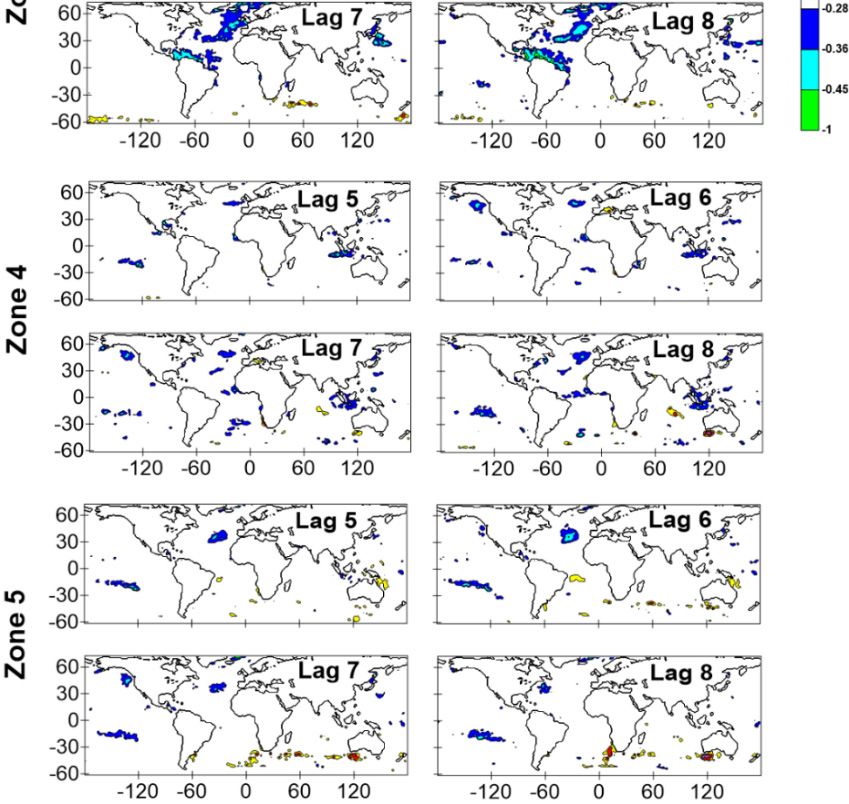
Water 2020, 12, 55 3 of 19
Water 2020, 12, 55 3 of 19
annual cycles of rainfall, and geographical vicinity. Moreover, correlation analysis was applied to
cycles of rainfall, and geographical vicinity. Moreover, correlation analysis was applied to investigate
investigate the links between global SSTs in different oceanic regions and Ethiopian summer and
the links between global SSTs in different oceanic regions and Ethiopian summer and spring rainfalls.
spring rainfalls. SST is a main indicator because of its slowly varying rate of change and the high
SST is a main indicator because of its slowly varying rate of change and the high ocean–atmosphere
ocean–atmosphere coupling [2]. Finally, these significantly correlated SST areas with Ethiopian
coupling
rainfall [2]. Finally, these
are suggested significantly
to sufficiently correlated
enhance SST areas
the seasonal withpredictions
rainfall Ethiopian over
rainfall are suggested
Ethiopia in furtherto
sufficiently
studies. enhance the seasonal rainfall predictions over Ethiopia in further studies.
2. Materials and Methods
2. Materials and Methods
2.1. Study Area
2.1. Study Area
The entire Ethiopian domain has an overall area of 1.13 × 10⁶ km2 and spans from latitude 3◦ to
The longitude
15◦ N and entire Ethiopian
33◦ todomain has region
48◦ E. The an overall area of 1.13 × 10
is distinguished
6 km2 and spans from latitude 3° to
by highly complex topography in the
15° N and longitude 33° to 48° E. The region is distinguished by highly complex topography in the
northern and central highlands and by the lowland of the East African Rift Valley in the traversed
northern and central highlands and by the lowland of the East African Rift Valley in the traversed
northeast–southwest portion. Altitudes range between hundreds of meters below sea level in the
northeast–southwest portion. Altitudes range between hundreds of meters below sea level in the
northeastern regions to thousands of meters above sea level in the northern highlands (Figure 1). Based
northeastern regions to thousands of meters above sea level in the northern highlands (Figure 1).
on seasonal rainfall cycle, Ethiopia can be divided into three main regions: (i) northern and central
Based on seasonal rainfall cycle, Ethiopia can be divided into three main regions: (i) northern and
western areas with one rainy season whose peak occurs in July/August; (ii) southern part with two
central western areas with one rainy season whose peak occurs in July/August; (ii) southern part with
seasons of short rainfall (September–November) and long rainfall (March–May); and (iii) eastern and
two seasons of short rainfall (September–November) and long rainfall (March–May); and (iii) eastern
central
and centralofparts
parts the country with two
of the country rainy
with twoperiods called spring
rainy periods called season (February–May)
spring season and summer
(February–May) and
rainy season (June–September) [40].
summer rainy season (June–September) [40].
Figure
Figure 1. 1.Location
Locationmap
mapofofthe
thestudy
study area:
area: (a)
(a) Location
Location of
of Ethiopia
Ethiopiainineastern
easternAfrica;
Africa;(b)
(b)AAmap
map ofof
Ethiopia
Ethiopia showingthe
showing themean
meanannual
annualrainfall
rainfall distribution
distribution at
at 200
200 mm
mminterval
intervalisohyets
isohyets(blue
(bluelines) based
lines) based
onon ClimateResearch
Climate ResearchUnit
Unit(CRU:
(CRU:https://www.cru.uea.ac.uk/data)
https://www.cru.uea.ac.uk/data) datadataofof1951‒2015.
1951-2015.The
Thebackground
background
provides elevation data extracted from a 90 m resolution Shuttle Radar Topographic
provides elevation data extracted from a 90 m resolution Shuttle Radar Topographic Mission Mission (SRTM:
(SRTM:
http://srtm.csi.cgiar.org/).
http://srtm.csi.cgiar.org/).
TheThe interannual
interannual rainfall
rainfall in Ethiopia
in Ethiopia is highly
is highly variable
variable duringduring all seasons.
all seasons. Previous Previous
studies studies
[4,7,8,13]
[4,7,8,13]that
observed observed that this variability
this variability is basically
is basically influenced
influenced by large-scale
by large-scale phenomena
phenomena (e.g., (e.g.,
ENSO), ENSO),
while
while other studies based on modeling suggested SSTs of Indian and Pacific
other studies based on modeling suggested SSTs of Indian and Pacific oceans influence Ethiopian oceans influence
Ethiopian
rainfall [18]. rainfall [18]. Investigating
Investigating this relation
this large-scale large-scale relation
between between
SST SST ofoceanic
of different different oceanic
regions andregions
rainfall
and rainfall over Ethiopia is defined as teleconnection. Definitely, rainfall is related historically
over Ethiopia is defined as teleconnection. Definitely, rainfall is related historically to different climate to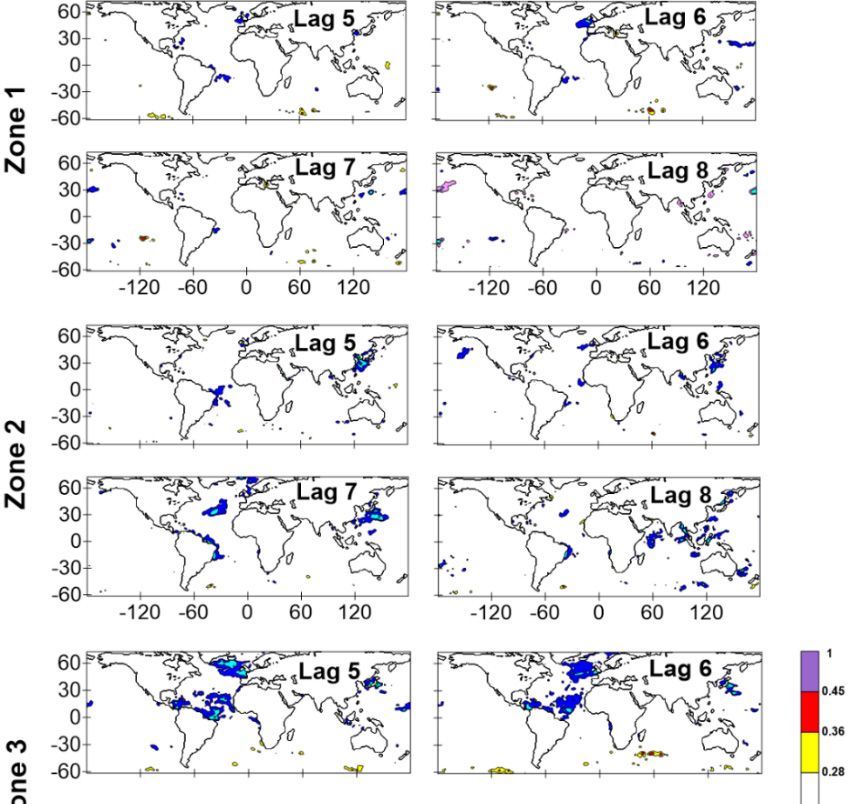
Water 2020, 12, 55                                                                                   4 of 19

parameters. However, SST is the prominent indicator due to its slow rate of change that helps for
long-term investigations [2]. Therefore, variable teleconnections motivate more accurate regional-scale
prediction models for seasonal rainfalls over the country.
      The northwestern and central highlands of Ethiopia are considered main water resources not
only for Ethiopia, but also for Sudan and Egypt where the Blue Nile basin contributes more than 50%
of the Nile River flow [41]. Furthermore, at highlands (>1500 m), 90% of Ethiopian people reside
and depend mainly on rain-fed agriculture, with a high percentage of labor forces (89%) involved in
smallholder agriculture, while the remaining population lives at lowlands (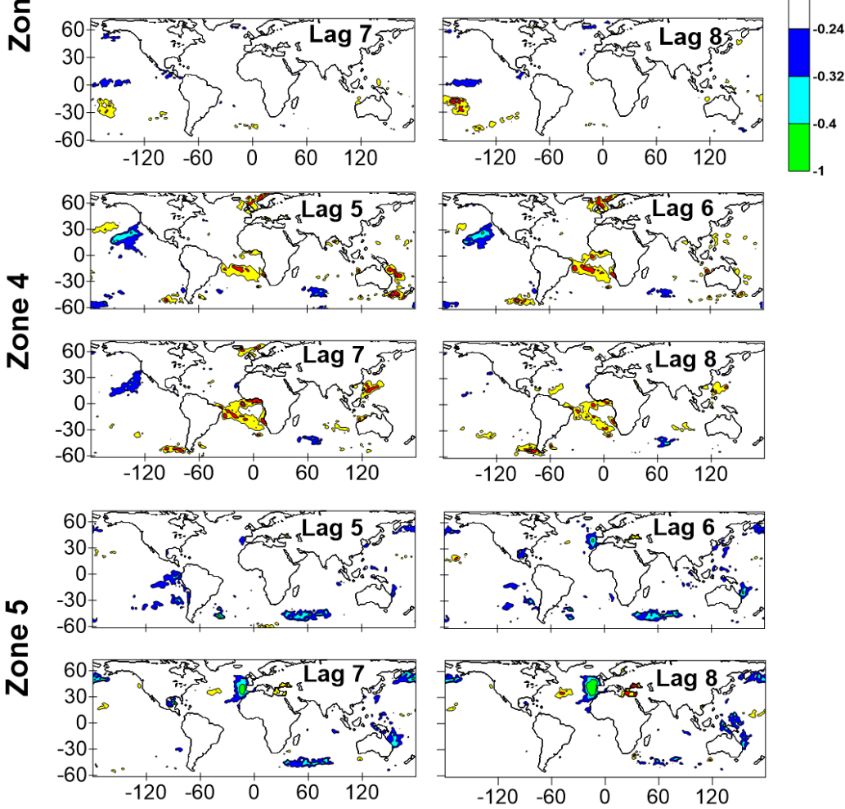
Water 2020, 12, 55                                                                                            5 of 19

2.3.2. Standardization
    Standardization was conducted for each zone to detect statistically considerable changes in rainfall,
where the dependent variable of annual zone rainfall was regressed on the independent variable of
time. Here, the data used covered 65 (1951–2015) and 50 (1951–2000) years for summer and spring
seasons, respectively. Next, the temporal tendency was examined for statistical significance of the
Pearson correlation coefficient (r) following Student’s t-test as explained in detail by Hirsch et al. [58].
The statistical significance of the trend was evaluated (at 0.01 significance level) against the null
hypothesis of no trend for the series of data.

2.3.3. Correlation Analysis
       The cross-correlation between SST at each grid point and averaged rainfall over every homogenous
zone was used to identify the potential coverabilities or teleconnections between global SSTs and
averaged rainfall peaks of summer July/August (JA) and spring April/May (AM) over Ethiopia.
Here, the Pearson product-moment correlation coefficient (r) was a crucial element for evaluating the
teleconnection (remote linkage) between rainfall and SST at different significance levels. The value
of (r) varied from +1 (perfectly positive correlation) to −1 (perfectly negative correlation), while zero
indicated no link. Student’s t-test was applied against the null hypothesis of no correlation for the
assessment of statistical significance [59]. Estimation of the statistical significance of a variable in
time series has been explained in different previous studies [58,60], whereas the significance of lag-1
correlation coefficient was firstly introduced by Anderson in 1942 [61], followed by Kendall and Stuart
in 1948 [62]. Higher-order lags were used when the first-order correlation insufficiently depicted
the serial dependence [63]. For this purpose, lagged (r) was calculated for lags from 0 to 9 months,
i.e., calculating (r) until October/November and July/August of the previous year to summer and
spring peaks, respectively, for identification of lags that show significant correlations [11,64]. The
normal distribution of SST data followed the distribution explained in previous studies [11,65]. Table 1
shows the calculated correlation coefficients |r| corresponding to statistical significance levels. For this
study, the concentration was on the significance at 1% level (two-tailed) with the calculated correlation
coefficients of 0.32 and 0.36 for summer and spring rainfalls, respectively.

      Table 1. Calculated values of Pearson’s correlation coefficient (r) corresponding to significance levels.

                                          Correlation Coefficient (r)      Correlation Coefficient (r)
               Significance Level (α)
                                           Summer Rainfall (n = 65)          Spring Rainfall (n = 50)
                        0.05                          0.24                             0.28
                        0.01                          0.32                             0.36
                       0.001                          0.40                             0.45

3. Results and Discussion

3.1. Zoning of Ethiopia Based on Seasonal Rainfall
     Figure 2 displays the country of Ethiopia being divided into two main subregions: (i) northern
and central regions with nine zones (1–9) for summer rainfall and (ii) southern region with five zones
(1–5) for spring rains. The average cross-correlations between and within zones were tested for various
times for the optimal selection of a proper number of zones, as shown in Tables 2 and 3, with a
reasonable homogeneity delineating a new classification for Ethiopia into nine summer and five spring
zones. In case of high spatial and temporal variability of Ethiopian rainfall, it would be crucial to
delineate boundaries and define the country into homogenous zones, as the optimal zonation would
be valuable for hydrologic modeling, prediction, ecological, and climate classification, or for any other
analysis [66,67]. For this purpose, different research studies have been undertaken. For example,
Korecha and Sorteberg [68] indicated that the National Meteorological Agency of Ethiopia divides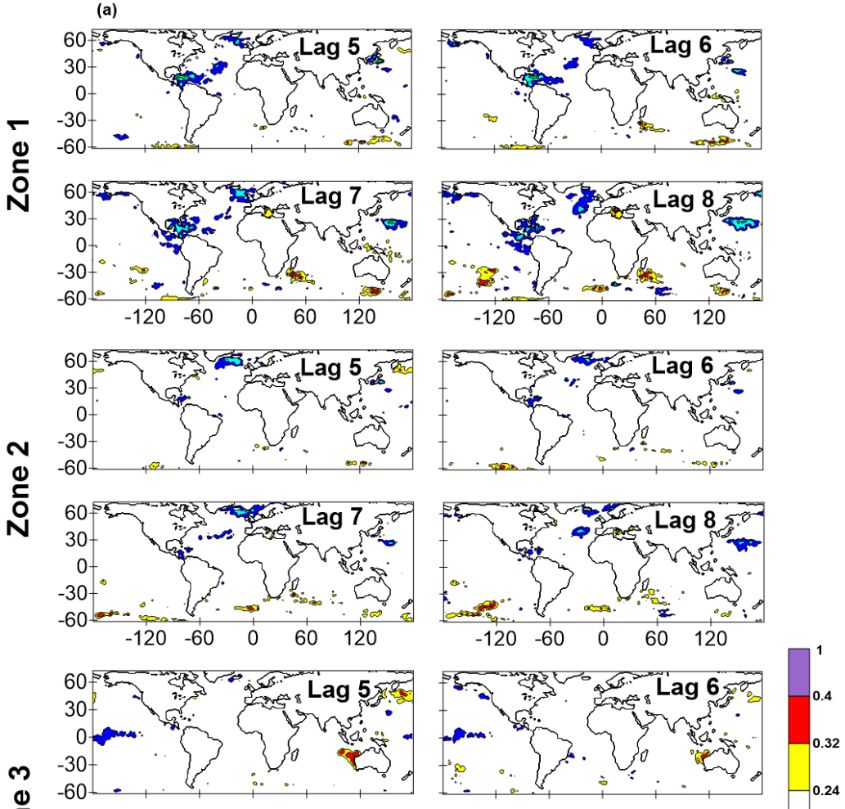
Water 2020, 12, 55 6 of 19
Water 2020, 12, 55 6 of 19
any other analysis [66,67]. For this purpose, different research studies have been undertaken. For
example, Korecha and Sorteberg [68] indicated that the National Meteorological Agency of Ethiopia
the region
divides the into eight
region homogenous
into zones depending
eight homogenous on the main
zones depending on thesystems of atmospheric–oceanic
main systems of atmospheric–
circulation and rain production. Moreover, Gissila et al. [13] grouped
oceanic circulation and rain production. Moreover, Gissila et al. [13] grouped Ethiopia Ethiopia into fourintoclusters
four
based on seasonal rainfall cycles and homogeneity of interannual rainfalls at 24 rain
clusters based on seasonal rainfall cycles and homogeneity of interannual rainfalls at 24 rain gauges. gauges. Despite
following
Despite the samethe
following methodology of the latter
same methodology study,
of the both
latter this both
study, studythisandstudy
Diro and
et al.’s [57]etproduced
Diro al.’s [57]
different results. Here, the country was divided into nine summer peak
produced different results. Here, the country was divided into nine summer peak (JA) zones (JA) zones and five
andspring
five
peak (AM) zones based on CRU seasonal rainfall data covering Ethiopia (381
spring peak (AM) zones based on CRU seasonal rainfall data covering Ethiopia (381 grid points), grid points), whereas
Diro et al.
whereas [57]etdelineated
Diro five homogenous
al. [57] delineated summer rainfall
five homogenous summerregionsrainfall(June–September) and six spring
regions (June–September) and
zones
six (February–May)
spring dependingdepending
zones (February–May) on the dataon from
the33 rainfall
data fromstations andstations
33 rainfall considering the interannual
and considering the
variation of seasonal rainfalls. Additionally, a number of recent studies carried
interannual variation of seasonal rainfalls. Additionally, a number of recent studies carried outout [21,52,69] obtained
different zoning
[21,52,69] outcomes.
obtained Therefore,
different zoning the classification
outcomes. of Ethiopia
Therefore, the into homogenous
classification of zones could
Ethiopia be
into
different fromzones
homogenous one study
could to
beanother,
differentbecause
from one of study
the high variability
to another, in large-scale
because forces
of the high producing
variability in
rainfall over the country.
large-scale forces producing rainfall over the country.
Figure 2.
Figure Homogenousrainfall
2.Homogenous rainfallzones
zonesover
overEthiopia
Ethiopiaobtained
obtainedfrom
fromcorrelation
correlationanalyses
analysesusing
usingmonthly
monthly
rainfall variability
rainfall variability of
of summer
summer rainfall
rainfall peaks
peaks July–August
July–August (JA)
(JA) and
and spring
spring rainfall
rainfall peaks
peaks April–May
April–May
(AM).
(AM).
Table 2. Mean cross-correlation (mean intergrid correlation) between and within nine summer zones.
Table 2. Mean cross-correlation (mean intergrid correlation) between and within nine summer zones.
Summer Zones 1 2 3 4 5 6 7 8 9
Summer Zones 1 2 3 4 5 6 7 8 9
1 1 1.0001.000 - - - - -- -- -- - - - - - -
2 2 0.3610.3611.000
1.000 - - - - -- - - - - - - - -
3 0.603 0.548 1.000 - - - - - -
3 0.603 0.548 1.000 - - - - - -
4 0.786 0.371 0.676 1.000 - - - - -
4 0.786 0.371 0.676 1.000 - - - - -
5 0.274 0.748 0.473 0.374 1.000 - - - -
6 5 0.4090.2740.536
0.748 0.863
0.473 0.436
0.374 1.000
0.371 -
1.000 - - - - - -
7 6 0.1640.4090.240
0.536 0.586
0.863 0.107
0.436 0.371
0.140 1.000
0.683 - 1.000 - - - -
8 7 0.3050.1640.332
0.240 0.531
0.586 0.325
0.107 0.140
0.388 0.683
0.387 1.000
0.302 - 1.000 - -
8 0.3050.146
0.332 0.531 0.325 0.388 0.387 0.302 1.000 -
9 0.369 0.630 0.359 0.144 0.324 0.397 0.562 1.000
9 0.369 s0.146 s 0.630 0.359 0.144 0.324 0.397 0.562 1.000
Table 3. Mean cross-correlation (mean intergrid correlation) between and within five spring zones.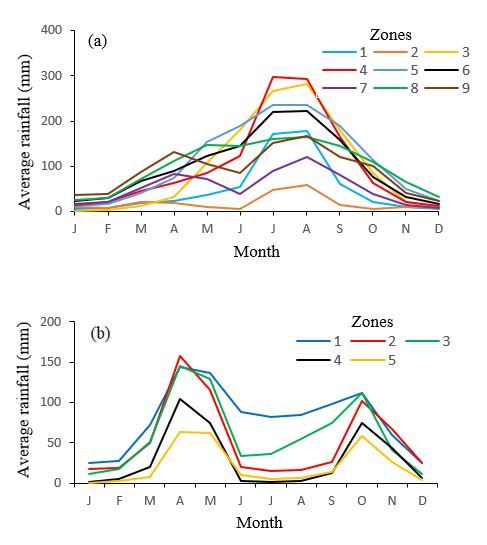
Water 2020, 12, 55                                                                                          7 of 19

Water 2020, 12, 55                                                                                       7 of 19
       Table 3. Mean cross-correlation (mean intergrid correlation) between and within five spring zones.

                             Spring Zones
                     Spring Zones       1       1     2 2        33     4    4 5        5
                                  1           1.000      -       -      -        -
                          1           1.000           -            -         -           -
                                  2           0.067 1.000        -      -        -
                          2           0.067         1.000          -         -           -
                          3       3 0.596     0.596 0.556
                                                       0.556   1.000
                                                                1.000   -    - -         -
                          4       4 0.690     0.690 0.174
                                                       0.174   0.649
                                                                0.649 1.0001.000 -       -
                          5       5 0.211     0.211 0.702
                                                       0.702   0.604
                                                                0.604 0.5500.550
                                                                               1.000   1.000

3.2. Temporal Variation of Rainfall
3.2. Temporal Variation of Rainfall

3.2.1. Annual Rainfall Cycle
               shows the
     Figure 3 shows     the mean
                              mean monthly
                                    monthly rainfall
                                                rainfall values
                                                         values calculated
                                                                 calculated for each
                                                                                  each zone.
                                                                                       zone. Apparently,
                                                                                              Apparently, thethe
northern and central Ethiopian regions displayed
                                               displayed a regime of monomodal
                                                                         monomodal summer
                                                                                        summer rainfall
                                                                                                 rainfall cycle
                                                                                                          cycle
(June–September) with rainfall peaks
(June–September)                     peaks in July/August
                                                July/August (hereafter
                                                               (hereafter JA),
                                                                          JA), which
                                                                                which is
                                                                                       is consistent
                                                                                          consistent with
                                                                                                      with that
                                                                                                           that
reported  by Diro
reported by Diro  et al. [2]. In contrast, the southern   region of the country  experienced  bimodal  rainfall
                              In contrast, the southern region of the country experienced bimodal rainfall
cycles for spring or long rainfall (March–May) with rainfall peaks   peaks in
                                                                           in April/May
                                                                               April/May (hereafter
                                                                                           (hereafter AM)
                                                                                                      AM) and
                                                                                                            and
another short rainfall cycle from (October–November).

      Figure
      Figure 3.  Mean monthly
              3. Mean monthly rainfall
                                rainfall over
                                         over Ethiopia
                                              Ethiopia for
                                                       for (a)
                                                           (a) nine
                                                               nine summer
                                                                    summer zones
                                                                           zones (1951–2010)
                                                                                 (1951–2010) and
                                                                                             and (b)
                                                                                                 (b) five
                                                                                                     five
      spring
      spring zones
             zones (1951–2000).
                   (1951–2000).
3.2.2. Interannual Rainfall Variability
3.2.2. Interannual Rainfall Variability
      Figure 4a shows a time series of standardized summer rainfall variability for each zone from
      Figure 4a shows a time series of standardized summer rainfall variability for each zone from
1951 to 2015 with a considerable variation between wet and dry years from one zone to another. The
1951 to 2015 with a considerable variation between wet and dry years from one zone to another. The
northern and central rainfall zones displayed a successive time period of 2–4 years of dry and wet
northern and central rainfall zones displayed a successive time period of 2–4 years of dry and wet
years without any distinct trend, in addition to three records of drought years in 1965, 1984, and 2002.
years without any distinct trend, in addition to three records of drought years in 1965, 1984, and 2002.
Moreover, the magnitude of the series gradually decreased for all zones, except for the central zones
Moreover, the magnitude of the series gradually decreased for all zones, except for the central zones
(7 and 8). Figure 4b indicates the time series of standardized spring rainfall variability for each zone
(7 and 8). Figure 4b indicates the time series of standardized spring rainfall variability for each zone
from 1951 to 2000, where the eastern and southern zones indicated a continual below-average amount
from 1951 to 2000, where the eastern and southern zones indicated a continual below-average amount
of rainfall from 1952 to 1956, but recovered in the late 1950s. Moreover, the drought years appeared in
of rainfall from 1952 to 1956, but recovered in the late 1950s. Moreover, the drought years appeared
1974, 1980, and 1984 with a prevalent drier condition from the beginning of the 1990s. Both figures also
in 1974, 1980, and 1984 with a prevalent drier condition from the beginning of the 1990s. Both figures
confirmed Ethiopia’s significant interannual rainfall variability with the year 1984 being the major year
also confirmed Ethiopia’s significant interannual rainfall variability with the year 1984 being the
of drought that covered the whole of Ethiopia [6], in which the standard deviations varied between
major year of drought that covered the whole of Ethiopia [6], in which the standard deviations varied
0.7-below-average in the southern zones and greater-than-2 below-average in the northern zones.
between 0.7-below-average in the southern zones and greater-than-2 below-average in the northern
zones. Moreover, the country experienced abundant amounts of rainfall for 4 years (1951, 1961, 1967,
and 1982) of the given 65 years for the study. These results were consistent with Seleshi and Zanke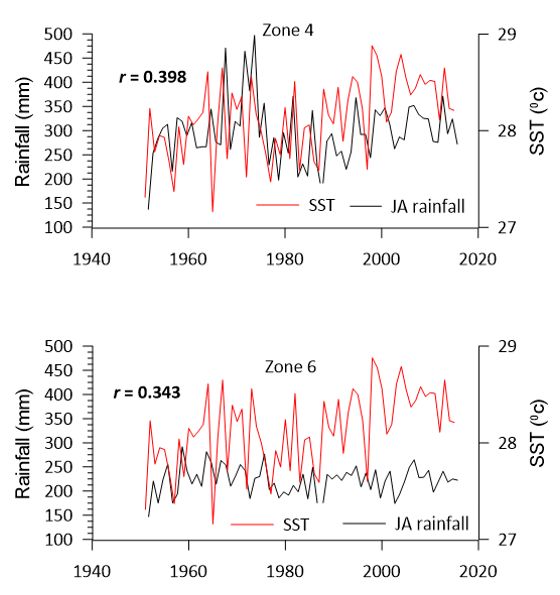
Water 2020, 12, 55                                                                                                    8 of 19

Moreover, the country experienced abundant amounts of rainfall for 4 years (1951, 1961, 1967, and
  Water 2020, 12, 55                                                                                8 of 19
1982) of the given 65 years for the study. These results were consistent with Seleshi and Zanke [6]
for[6]their analysis of the annual rainfall totals and annual rainy days over the country. The Ethiopian
        for their analysis of the annual rainfall totals and annual rainy days over the country. The
rainfall
  Ethiopian rainfallhas
           variability     been described
                        variability has beenin described
                                                numerousin
                                                         studies, depending
                                                           numerous   studies,ondepending
                                                                                 the leading
                                                                                           onmechanisms
                                                                                              the leading of
the
  mechanisms of the ITCZ migration, influences of topography, and various interactions ofsystem
      ITCZ   migration,  influences  of topography,   and various interactions  of hydro-climate   hydro-on
regional
  climatescales
            system[6,70].
                     on regional scales [6,70].

      Figure 4. Standardized time-series plot of annual rainfall totals for (a) summer rainfall zones (1951–2015)
        Figure 4. Standardized time-series plot of annual rainfall totals for (a) summer rainfall zones (1951–
      and (b) spring rainfall zones (1951–2000).
        2015) and (b) spring rainfall zones (1951–2000).
3.3. Teleconnections
  3.3. Teleconnections
3.3.1. Cross-Correlation between Summer Rainfall (July/August Peak) and Oceanic SSTs
  3.3.1. Cross-Correlation between Summer Rainfall (July/August Peak) and Oceanic SSTs
      Firstly, for the 65 years of summer rainfall (1951–2015), the correlation coefficients ±0.24, ±0.32, and
        Firstly, for the to
±0.40 corresponding      65significance
                            years of summerlevelsrainfall
                                                   of 0.05, (1951    2015),
                                                             0.01, –and     thewere
                                                                        0.001    correlation  coefficients
                                                                                      calculated            ±0.24, ±0.32,
                                                                                                   using two-tailed   t-test.
  and  ±0.40  corresponding    to significance   levels  of 0.05, 0.01, and   0.001  were  calculated
As shown in Figure 5, the common summer rainfall zones having the same significantly correlated        using  two-tailed
  t-test.
SST        As shown
     regions           in Figure 5,
                were statistically     the common
                                    extracted           summer rainfall
                                                and represented               zones having
                                                                      at significance    levels.the same significantly
                                                                                                 In particular, this study
  correlated   SST  regions were   statistically extracted    and   represented   at significance  levels.
relied on the 0.01 significance level with r = ±0.32, showing a significantly strong correlation at a lag  In particular,
  thisof
time   study   relied onbetween
          5–8 months     the 0.01 significance
                                  the July/Augustlevel rainfall
                                                        with r = and
                                                                  ±0.32, showing
                                                                       SST           a significantly
                                                                             at the nine             strong and
                                                                                           zones. Positive   correlation
                                                                                                                  negative
  at a lag time of 5–8 months between the July/August rainfall and SST at the nine zones. Positive and
correlations were represented in red and blue colors, respectively (Figure 5).
  negative correlations were represented in red and blue colors, respectively (Figure 5).
Water 2020, 12, 55 9 of 19
Water 2020, 12, 55 9 of 19
Figure 5. Cont.Water 2020, 12, 55 10 of 19
Water 2020, 12, 55 10 of 19
Figure Maps(a)
Figure5.5.Maps (a)and
and(b)
(b)showing
showingthethenine
nine summer
summer rainfall
rainfall zones
zones with
with cross-correlations
cross-correlationsbetween
between
July/Augustsummer
July/August summerrainfall
rainfall of
of each
each zone
zone and
and sea
sea surface
surface temperatures
temperatures (SSTs)
(SSTs) for
for different
different oceanic
oceanic
regionsatatlag
regions lagtimes
timesofof5–8
5–8months.
months.
From
Fromthethestandpoint
standpointof offorecasting,
forecasting, possible
possible correlations of SST withwith rainfall
rainfall at
at longer
longerlag
lagtimes
times
arepotentially
are potentiallyeffective.
effective.For
For instance,
instance, asas shown in the left side
side of
of Figure
Figure 6,6,at
at5–6
5–6months
monthslag lagperiod,
period,
GulfofofGuinea
Gulf GuineaSSTSSTshowed
showedaa significantly
significantly positive correlation with July/August rainfallrainfallin
inthe
thecentral
central
zones(6(6and
zones and9),
9),while
whiletwo
two regions
regions in in the Pacific Ocean exhibited
exhibited the
thestrongest
strongestteleconnection
teleconnection(positive
(positive
andnegative)
and negative)between
between SST
SST and
and rainfall
rainfall at
at zones
zones 8 and 9, due to the well-known
well-known Pacific
Pacific events
eventsof of
ENSO. A recent investigation of Gleixner et
ENSO. A recent investigation of Gleixner et al. [15] al. [15] revealed that half of Ethiopian summer rainfall
Ethiopian summer rainfall is is
affectedbybythe
affected thevariation
variationofof equatorial
equatorial Pacific
Pacific SST.
SST. Additionally,
Additionally, various
various previous
previous studies
studies indicated
indicated the
the teleconnection
teleconnection betweenbetween
SST ofSSTthe of the Pacific
Pacific and Ethiopian
and Ethiopian summersummer rainfall [1,4,9,13,19,71]
rainfall [1,4,9,13,19,71] and excessand of
excess of rainfall during
rainfall during spring season.spring season.Water 2020, 12, 55 11 of 19
Water 2020, 12, 55 11 of 19
Water 2020, 12, 55 11 of 19
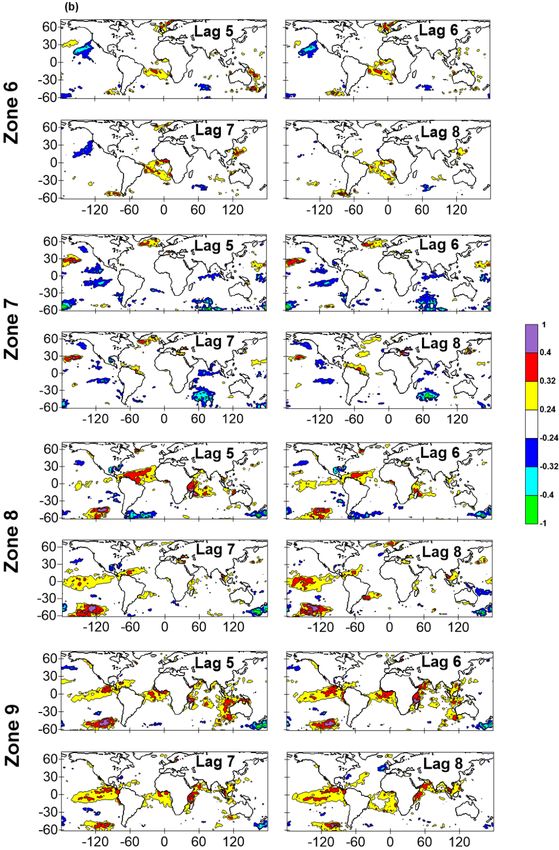
Figure 6. Extraction of common summer rainfall zones having the same significantly correlated SST
Figure 6. Extraction
Figure 6. Extraction of
of common
common summer
summer rainfall
rainfall zones
zones having
having the
the same
same significantly
significantly correlated
correlated SST
SST
regions (r ≥ 0.32) at lag times of 5–6 months (left side) and 6–7 months (right side). Red and blue
regions ≥
regions (r ≥ 0.32) at lag times of 5–6 months (left side) and 6–7 months (right side). Red
(r 0.32) at lag times of 5–6 months (left side) and 6–7 months (right side). Red and
and blue
blue
colors indicate positive and negative correlations, respectively.
colors
colors indicate
indicate positive
positive and
and negative
negative correlations,
correlations, respectively.
respectively.
AtAt6–7 months lag period, the central summer rainfall zones 4 and 6 6indicated a significantly
At 6–7
6–7 months
months lag lag period,
period, the the central
central summer
summer rainfall
rainfall zones
zones 44 andand 6 indicated
indicated aa significantly
significantly
positive
positive correlation with both Gulf of Guinea and a small area over the southeastern part part theinPacific.
the
positive correlation
correlationwith withbothboth GulfGulf of Guinea
of Guinea andanda small area area
a small over theoversoutheastern
the southeastern inpart in the
Pacific.
Diro Diro
et al. et al. [2] identified
[2]etidentified the
the effect effect
ofeffect of the
the Pacific Pacific SST on rainfall, besides the influence of theof
Pacific. Diro al. [2] identified the of theSST on rainfall,
Pacific besides the
SST on rainfall, influence
besides of the Gulf
the influence of the
Gulf of Guinea,
Guinea, over different
over different parts of parts of Ethiopia.
Ethiopia. The strongest
The strongest influenceinfluence of southern
of southern IndianIndian
Ocean Oceanon
Gulf of Guinea, over different parts of Ethiopia. The strongest influence of southern IndianSST Ocean
SST on Ethiopian
Ethiopian rainfall
rainfallrainfall due
due to due to Ethiopia’s
Ethiopia’s location
location was indicated
was indicated at rainfall
at rainfall zones
zones 5
5 and and 7 (right
7 (right sideof
side
SST on Ethiopian to Ethiopia’s location was indicated at rainfall zones 5 and 7 (right side
ofFigure
Figure6); 6);however,
however,the theeffect
effectofofthe the Indian Ocean SST was disregarded, as as the study’s objective
of Figure 6); however, the effect of Indian
the Indian Ocean SST
Ocean was
SST disregarded,
was disregarded, theasstudy’s
the study’sobjective was
objective
was directed
directed toward
toward thethe remote
remote influence
influence (teleconnection)
(teleconnection) of of oceanic
oceanic SST SST
onon Ethiopian
Ethiopian rainfall.
rainfall. ForForthe
was directed toward the remote influence (teleconnection) of oceanic SST on Ethiopian rainfall. For
the northern
northern summer
summer zones
zones 1 1 and
and 2,
2, the
the northwest
northwest Pacific
Pacific showed
showed insignificant
insignificant influence
influence on onrainfall
rainfall
the northern summer zones 1 and 2, the northwest Pacific showed insignificant influence on rainfall
(negative
(negative correlation) atataalag time of 7–8 months
months(Figure
(Figure7). 7).InIn2005,
2005,Segele
Segeleandand Lamb [4][4] indicated
(negativecorrelation)
correlation) at alag lagtime
time ofof7–87–8 months (Figure 7). In 2005, Segele and Lamb Lamb indicated
[4] indicatedthat
that upper-level
upper-level features
features such
such as as
the asthe
AfricanAfrican easterly
easterly jet
jet (AEJ), (AEJ), and tropical easterly jet (TEJ) affect
that upper-level features such the African easterly jet and tropical
(AEJ), easterly easterly
and tropical jet (TEJ) jetaffect summer
(TEJ) affect
summer
rainfall rainfall
over over Ethiopia
Ethiopia based onbased
their on their strength
strength and and location.
location. Moreover, Moreover,
moisture moisture
flux from fluxAtlantic
the from
summer rainfall over Ethiopia based on their strength and location. Moreover, moisture flux from
the
andAtlantic
Indianand Indian
oceans and oceans
asoceans and as a circulation
a lower-level lower-levelaffected
circulation by theaffected
highs by
ofby the highs of
Mascarene Mascarene
the Atlantic and Indian and as a lower-level circulation affected the highsand St. Helena
of Mascarene
and St.
affects Helena
summer affects
rainfall summer
significantly rainfall
[40]. significantly
Generally, [40].
various Generally,
previous various
studies previous
[1,2,14,72,73] studies
identified
and St. Helena affects summer rainfall significantly [40]. Generally, various previous studies
[1,2,14,72,73]
the identified
teleconnection the
between teleconnection
SST of the Indian between SST
Ocean SST of
and of the Indian
Ethiopian Ocean
rainfall, and Ethiopian rainfall,
[1,2,14,72,73] identified the teleconnection between the Indian Oceanalso andthey suggested
Ethiopian that
rainfall,
also
seathey suggested that sea surface temperature anomalies (SSTA) of eastern part of Pacific Ocean
alsosurface temperature
they suggested thatanomalies
sea surface (SSTA) of eastern
temperature part of Pacific
anomalies (SSTA) Ocean may affect
of eastern part ofsummer
Pacificrainfall
Ocean
may
as aaffect
main summer
rainy rainfall
season. Theseas apositive
main rainy SSTAs season.
are These positive
associated with SSTAs in
deficits aresummer
associated withand
rainfall deficits
excess
may affect summer rainfall as a main rainy season. These positive SSTAs are associated with deficits
inof
summer
rainfall rainfall
during and
springexcess of rainfall during spring season.
season.
in summer rainfall and excess of rainfall during spring season.
Figure 7. Extraction of common summer rainfall zones having the same significantly correlated SST
7. Extraction of common summer rainfall zones having the same significantly correlated SST
Figure 7.
regions (r ≥ 0.32) at the lag time of 7–8 months.
regions (r
regions (r ≥
≥ 0.32) at the lag time of 7–8 months.Water 2020, 12, 55 12 of 19
Water 2020, 12, 55 12 of 19
3.3.2. Cross-Correlation between Spring Rainfall (April/May Peak) and Oceanic SSTs
3.3.2. Cross-Correlation between Spring Rainfall (April/May Peak) and Oceanic SSTs
As shown in Figure 8, the common spring rainfall zones having the same significantly correlated
As shown
SST regions in Figure 8, the
were statistically common
extracted andspring rainfall zones
represented having thelevels.
at significance same significantly
In particular,correlated
this study
relied on the 0.01 significance level with r = ±0.36, showing a significantly strong correlation atstudy
SST regions were statistically extracted and represented at significance levels. In particular, this the lag
relied
period ofon
5–8the 0.01 significance
months level with rrainfall
between April/May = ±0.36, and
showing
SST at a significantly
five zones. strong correlation at the lag
period of 5–8 months between April/May rainfall and SST at five zones.
Figure
Figure 8. Maps
8. Maps showing
showing thethe cross-correlationsbetween
cross-correlations between April/May
April/May spring
springrainfall
rainfallofofeach
eachzone
zoneand
and
SSTs for different oceanic regions at a lag time of 5–8 months.
SSTs for different oceanic regions at a lag time of 5–8 months.Water 2020, 12, 55 13 of 19
Water 2020, 12, 55 13 of 19
From
Fromthe
thestandpoint
standpointof ofprediction,
prediction,possible
possiblecorrelations
correlationsof ofSST
SSTwith
withrainfall
rainfallat
atlonger
longerlaglagtimes
times
are
are potentially
potentially effective.
effective. For
Forinstance,
instance,atatlag
lagtime
timeof of6–7
6–7months,
months,the thenorthern
northernAtlantic
AtlanticOcean
OceanSSTSST
showed
showedaasignificantly
significantlynegative
negativecorrelation
correlationwith
withspring
springrainfall
rainfallzones
zones33andand55representing
representingsouthern
southern
and
andsoutheastern
southeasternregions
regionsofofEthiopia
Ethiopia(left
(leftside
sideof ofFigure
Figure9).9).Moreover,
Moreover,at at7–8
7–8months,
months,twotworegions
regionsat at
the
thesouthern
southernIndian
IndianOcean
Oceanexhibited
exhibitedaastrong
strongpositive
positiveinfluence
influenceon onspring
springrainfall
rainfalldue
dueto toEthiopia’s
Ethiopia’s
location
locationfor
forthe
thesoutheastern
southeasternzones
zones44and
and55(right
(rightside
sideof
ofFigure
Figure9).
9). The
Thepassage
passageof ofITCZ
ITCZcontrols
controlsthe
the
shape
shapeofofseasonal
seasonalrainfall
rainfallcycle.
cycle.Annually,
Annually, ititoscillates
oscillates from 15◦ N
from 15° Nin inJuly
Julyto 15◦SSin
to15° inJanuary
Januaryand andback
back
again monomodaland
again causing monomodal and bimodal
bimodal rainfall
rainfall patterns
patterns over over northern
northern and southern
and southern parts of parts of
Ethiopia,
Ethiopia, respectively
respectively [72]. In to
[72]. In addition addition to the difference
the difference between the between the land
land surface andsurface
Indianand Indian
Ocean Ocean
in the heat
in the heat
capacity capacityITCZ’s
inducing inducing ITCZ’s meridional
meridional arm. produces
arm. The latter The latterrainfall
produces rainfall
during duringand
February February
March
and
overMarch over the southwestern
the southwestern part of
part of Ethiopia Ethiopia
[40]. [40]. Additionally,
Additionally, the strengththeandstrength
locationand location of
of upper-level
upper-level feature
feature of the of the subtropical
subtropical westerly jet westerly jet (STWJ)
(STWJ) affects affects
spring spring
rainfall overrainfall over the
the country [4]. country [4].
Figure 9. Extraction of common spring rainfall zones having the same significantly correlated SST
Figure 9. Extraction of common spring rainfall zones having the same significantly correlated SST
regions (r ≥ 0.36) at a lag time of 6–7 months (left side) and 7–8 months (right side). Red and blue
regions (r ≥ 0.36) at a lag time of 6–7 months (left side) and 7–8 months (right side). Red and blue
colors indicate positive and negative correlations, respectively.
colors indicate positive and negative correlations, respectively.
Generally, SST and spring rainfall teleconnections are spatially and temporally complicated, where
Generally, SST and spring rainfall teleconnections are spatially and temporally complicated,
Diro et al. ‘s [20] was the only previous study to investigate the influence of SSTs of the Pacific, Atlantic,
where Diro et al. ‘s [20] was the only previous study to investigate the influence of SSTs of the Pacific,
and Indian oceans on spring rains (March–May), depicting the main rainfall season over the southern
Atlantic, and Indian oceans on spring rains (March–May), depicting the main rainfall season over the
part of Ethiopia. Therefore, the results in this study provide a more detailed understanding of such
southern part of Ethiopia. Therefore, the results in this study provide a more detailed understanding
teleconnections that would be valuable for enhancing rainfall prediction system over Ethiopia.
of such teleconnections that would be valuable for enhancing rainfall prediction system over
Finally, to visualize the SST regions showing significant correlation with seasonal rainfall over
Ethiopia.
Ethiopia, the correlation coefficients between rainfall time series and SSTs were derived for the
Finally, to visualize the SST regions showing significant correlation with seasonal rainfall over
aforementioned summer and spring zones with significant correlations (Figures 10 and 11). These
Ethiopia, the correlation coefficients between rainfall time series and SSTs were derived for the
regions could be used as inputs for a forecasting model for further studies at a lead time before the
aforementioned summer and spring zones with significant correlations (Figures 10 and 11). These
rainfall season. For the summer season, a significant correlation was indicated (r ≥ ±0.37) at a lag time
regions could be used as inputs for a forecasting model for further studies at a lead time before the
of 5–6 and 6–7 months prior to the rainy season. In particular, summer zones (8 and 9) at 5–6 months
rainfall season. For the summer season, a significant correlation was indicated (r ≥ ±0.37) at a lag time
lag period indicated opposite sense of positive and negative correlations, with the difference in SSTs
of 5–6 and 6–7 months prior to the rainy season. In particular, summer zones (8 and 9) at 5–6 months
enhancing the correlation. Thus, both zones (8 and 9) exhibited the strongest correlation (r ≥ 0.46)
lag period indicated opposite sense of positive and negative correlations, with the difference in SSTs
between summer rainfall and SST among all other summer zones (Figure 10). On the other side,
enhancing the correlation. Thus, both zones (8 and 9) exhibited the strongest correlation (r ≥ 0.46)
the spring rainfall zones (3 and 5) also showed significant correlation (r ≥ −0.40) at 6–7 months lag
between summer rainfall and SST among all other summer zones (Figure 10). On the other side, the
time, representing the influence of northern Atlantic Ocean SST, while the southern Indian Ocean SST
spring rainfall zones (3 and 5) also showed significant correlation (r ≥ −0.40) at 6–7 months lag time,
exhibited the strongest correlation (r ≥ 0.5) at 7–8 months of lag time (Figure 11).
representing the influence of northern Atlantic Ocean SST, while the southern Indian Ocean SST
These results suggest that SSTs of the southern Pacific and northern Atlantic oceans could be
exhibited the strongest correlation (r ≥ 0.5) at 7–8 months of lag time (Figure 11).
effective as inputs for prediction models of Ethiopian summer and spring rainfalls, respectively, at a
These results suggest that SSTs of the southern Pacific and northern Atlantic oceans could be
lead time before these seasons.
effective as inputs for prediction models of Ethiopian summer and spring rainfalls, respectively, at a
lead time before these seasons.Water 2020, 12, 55 14 of 19
Water 2020, 12, 55 14 of 19
Water 2020, 12, 55 14 of 19
Figure 10. Significant cross-correlations between selected summer rainfall zones and oceanic SSTs at
Figure 10. Significant
Figure cross-correlations between selected summer rainfallzones
zonesand
andoceanic
oceanic SSTs at
lag times10.ofSignificant
5–6 monthscross-correlations
for zones (6 & 9) between
and (8 & selected summer
9) (left side) and rainfall
6–7 months for zones (4 & SSTs
6) andat
lag times of 5–6 months for zones (6 & 9) and (8 & 9) (left side) and 6–7 months for zones (4 &6) 6) and
(5lag
& times of 5–6
7) (right months
side) forrainfall
for the zones (6 & 9)
time and (1951–2015).
series (8 & 9) (left side)
Zonesand 6–7 months
8 and for zones
9 show the (4 & (r)
calculated and
by
(5 &(57)&(right side)
7) (right for the
side) and rainfall
for the time
rainfall time series (1951–2015). Zones 8 and 9 show the calculated (r) byby
series (1951–2015). Zones 8 and 9 show the calculated (r)
subtracting positive negative correlations.
subtracting positive
subtracting andand
positive negative
negativecorrelations.
correlations.
Figure 11. Significant cross-correlations between selected spring rainfall zones and oceanic SSTs at
Figure
Figure
lag 11. 11.
times of Significant
Significant
6–7 months cross-correlations
cross-correlations between
between
for zones 3 & 5 (left selected
selected
side) and spring for
spring
7–8 months rainfall
zoneszones
rainfall 4 & 5and
zones andoceanic
(rightoceanicSSTs
side) for theat at
SSTs
lag times
lag rainfall
times oftimeof 6–7 months
6–7series
months for zones
(1951–2000). 3 & 5 (left side) and 7–8 months for zones 4 & 5 (right side)
for zones 3 & 5 (left side) and 7–8 months for zones 4 & 5 (right side) for for thethe
rainfall time series (1951–2000).
rainfall time series (1951–2000).Water 2020, 12, 55 15 of 19
4. Conclusions
Ethiopian rainfall is characterized by both seasonal and interannual spatial variabilities. Thus,
understanding the teleconnection (remote link) between Ethiopian rainfall and oceanic SSTs is a key
factor for establishing future rainfall prediction models and further managing the country’s water
resources. For this reason, this study was directed toward analyzing rainfall time series on both
seasonal and annual scales, investigating their potential trends, and detecting their significance over
Ethiopia, along with investigating the oceanic SST regions that significantly influence Ethiopian rainfall
in order to detect the potential SST regions that could be valuable as input data for establishing
forecasting models in further studies. Firstly, in this study, rainfall data for summer (1951–2015) and
spring (1951–2000) seasons were analyzed for identification of the rainfall peaks of July/August and
April/May for summer and spring seasons, respectively.
Secondly, preliminary clustering or dividing of Ethiopia into homogenous rainfall zones was
applied, depending on seasonality and spatial homogeneity of rainfall data, which introduced a
new number of rainfall zones for Ethiopia with 14 homogenous rainfall zones: nine rainfall zones
for summer peak July/August and five zones for spring peak April/May. Thirdly, cross-correlations
between SST and rainfall peaks at the 0.01 significance level revealed oceanic regions that significantly
influence rainfall over Ethiopia at different lag times. For summer rainfall (main rainy season), the
influence of Gulf of Guinea (positive correlation) and two regions in the southern Pacific Ocean
(positive and negative correlations) was significantly detected at a lag time of 5–6 months.
In addition, SST of northwestern Pacific showed a weak negative influence on summer northern
rainfall zones (1 and 2) at a lag time 7–8 months, whereas SST of the Indian Ocean indicated a
significantly negative effect on summer eastern and western zones (5 and 7) at a lag time of 6–7 months,
being close to Ethiopia. For spring rainfall, the negative influence of the northern Atlantic Ocean SST
was strongly detected on spring rainfall zones (3 and 5) at a lag time of 6–7 months, whereas two areas
of the Indian Ocean showed a positive correlation between SSTs and spring rainfall zones (4 and 5).
Finally, correlation coefficients (r) between these significant SST oceanic regions and both summer
and spring rainfalls were derived for detection of the SST regions that could be valuable as input
data for prediction models at lead times before both seasons. For the summer season, at a lag time of
5–6 months, both central zones (8 and 9) exhibited the strongest positive correlation (r ≥ 0.46) between
summer rainfall and southern Pacific Ocean SST, among all other summer zones due to the difference
between positive and negative correlations at the two areas of the southern Pacific Ocean. Alternatively,
a significantly negative correlation (r ≥ −0.40) was identified between spring rainfall zones (3 and 5)
and the northern Atlantic Ocean SST at a lag time of 6–7 months before spring season.
Therefore, for later studies, it is recommended to use SST regions of the southern Pacific and
northern Atlantic oceans as effective input data for forecasting models of Ethiopian summer and spring
rainfall peaks at lead times of 5–6 and 6–7 months, respectively.
Author Contributions: Conceptualization, A.A., H.Y. and A.A.F.; methodology and software, A.A. and H.Y.;
formal analysis, A.A.; writing—original draft preparation, A.A.; supervision, H.Y. and K.S.; all authors H.Y., A.A.F.,
K.S., and R.K. reviewed the article. All authors have read and agreed to the published version of the manuscript.
Funding: This research was funded by International Platform for Dryland Research and Education (IPDRE),
Tottori University.
Acknowledgments: The authors thank the Egypt–Japan Education Partnership for the Ph.D. research grant for the
first author. The main data presented herein were sourced from the CRU database (https://www.cru.uea.ac.uk/data),
and the HadISST data from the British Atmospheric Data Center (https://www.metoffice.gov.uk/hadobs/hadisst/).
The authors would like to thank Enago (www.enago.jp) for the English language review. The authors are grateful
for the invaluable comments by two anonymous reviewers and editor on this paper.
Conflicts of Interest: The authors declare no conflict of interest.Water 2020, 12, 55 16 of 19
References
1. Diro, G.T.; Grimes, D.I.; Black, E. Teleconnections between Ethiopian summer rainfall and sea surface
temperature: Part I—observation and modelling. Clim. Dyn. 2011, 37, 103–119. [CrossRef]
2. Diro, G.T.; Grimes, D.I.; Black, E. Teleconnections between Ethiopian summer rainfall and sea surface
temperature: Part II. Seasonal forecasting. Clim. Dyn. 2011, 37, 121–131. [CrossRef]
3. Gamachu, D. Some patterns of altitudinal variation of climatic elements in the mountainous regions of
Ethiopia. Mt. Res. Dev. 1988, 8, 131–138. [CrossRef]
4. Segele, Z.T.; Lamb, P.J. Characterization and variability of Kiremt rainy season over Ethiopia. Meteorol.
Atmos. Phys. 2005, 89, 153–180. [CrossRef]
5. Jury, M.R.; Funk, C. Climatic trends over Ethiopia: Regional signals and drivers. Int. J. Climatol. 2012, 33,
1924–1935. [CrossRef]
6. Seleshi, Y.; Zanke, U. Recent changes in rainfall and rainy days in Ethiopia. Int. J. Climatol. J. R. Meteorol. Soc.
2004, 24, 973–983. [CrossRef]
7. Segele, Z.T.; Lamb, P.J.; Leslie, L.M. Large-scale atmospheric circulation and global sea surface temperature
associations with Horn of Africa June-September rainfall. Int. J. Climatol. 2009, 29, 1075–1100. [CrossRef]
8. Segele, Z.; Lamb, P.J.; Leslie, L.M. Seasonal-to-interannual variability of Ethiopia/Horn of Africa monsoon.
Part I: Associations of Wavelet-Filtered large-scale atmospheric circulation and global sea surface temperature.
J. Clim. 2009, 22, 3396–3421. [CrossRef]
9. Korecha, D.; Barnston, A.G. Predictability of June–September rainfall in Ethiopia. Mon. Weather Rev. 2007,
135, 628–650. [CrossRef]
10. Alhamshry, A.; Fenta, A.A.; Yasuda, H.; Shimizu, K.; Kawai, T. Prediction of summer rainfall over the source
region of the Blue Nile by using teleconnections based on sea surface temperatures. Theor. Appl. Climatol.
2019, 1–11. [CrossRef]
11. Yasuda, H.; Berndtsson, R.; Saito, T.; Anyoji, H.; Zhang, X. Prediction of Chinese Loess Plateau summer
rainfall using Pacific Ocean spring sea surface temperature. Int. J. 2009, 23, 719–729. [CrossRef]
12. Tootle, G.A.; Piechota, T.C. Relationships between Pacific and Atlantic Ocean sea surface temperatures and
US streamflow variability. Water Resour. Res. 2006, 42, W07411. [CrossRef]
13. Gissila, T.; Black, E.; Grimes, D.; Slingo, J. Seasonal forecasting of the Ethiopian summer rains. Int. J. Climatol.
2004, 24, 1345–1358. [CrossRef]
14. Camberlin, P. June-September rainfall in northeastern Africa and atmospheric signals over the tropics:
A zonal perspective. Int. J. Climatol. 1995, 15, 773–783. [CrossRef]
15. Gleixner, S.; Keenlyside, N.S.; Demissie, T.D.; Counillon, F.; Wang, Y.; Viste, E. Seasonal predictability of
Kiremt rainfall in coupled general circulation models. Environ. Res. Lett. 2017, 12, 114016. [CrossRef]
16. Camberlin, P.; Janicot, S.; Poccard, I. Seasonality and atmospheric dynamics of the teleconnection between
African rainfall and tropical sea surface temperature: Atlantic vs. ENSO. Int. J. Climatol. 2001, 21, 973–1005.
[CrossRef]
17. Seleshi, Y.; Demaree, G.R. Rainfall variability in the Ethiopian and Eritrean highlands and its links with the
Southern Oscilation Index. J. Biogeogr. 1995, 22, 945–952. [CrossRef]
18. Folland, C.K.; Palmer, T.N.; Parker, D.E. Sahel rainfall and world-wide sea temperature, 1901–1985. Nature
1986, 320, 602–607. [CrossRef]
19. Camberlin, P. Rainfall anomalies in the source region of the Nile and their connection with the Indian summer
monsoon. J. Clim. 1997, 10, 1380–1392. [CrossRef]
20. Diro, G.T.; Black, E.; Grimes, D.I.F. Seasonal forecasting of Ethiopian spring rains. Meteorol. Appl. 2008, 15,
73–83. [CrossRef]
21. Degefu, M.A.; Rowell, D.P.; Bewket, W. Teleconnections between Ethiopian rainfall variability and global
SSTs: Observations and methods for model evaluation. Meteorol. Atmos. Phys. 2017, 129, 173–186. [CrossRef]
22. Digna, R.; Castro-Gama, M.; van der Zaag, P.; Mohamed, Y.; Corzo, G.; Uhlenbrook, S. Optimal operation of
the Eastern Nile System using Genetic Algorithm, and benefits distribution of water resources development.
Water 2018, 10, 921. [CrossRef]
23. Fenta, A.A.; Kifle, A.; Gebreyohannes, T.; Hailu, G. Spatial analysis of groundwater potential using remote
sensing and GIS-based multi-criteria evaluation in Raya Valley, northern Ethiopia. Hydrogeol. J. 2015, 23,
195–206. [CrossRef]You can also read


