Reassessment of the Greater Vancouver Water District Secondary Disinfection Strategy
←
→
Page content transcription
If your browser does not render page correctly, please read the page content below
Reassessment of the Greater Vancouver Water
District Secondary Disinfection Strategy

Prepared by:
Tracy Wang
UBC Sustainability Scholar, 2020

Prepared for:
Larry Chow
Program Manager, Interagency Projects & Quality Control,
Water Services, Metro Vancouver

Vila Goh
Superintendent, Water Services Laboratories, Metro Vancouver

August 2020
Reassessment of the Greater Vancouver Water District Secondary Reassessment Strategy

Disclaimer

This report was produced as part of the UBC Sustainability Scholars Program, a partnership between the
University of British Columbia and various local governments and organizations in support of providing
graduate students with opportunities to do applied research on projects that advance sustainability
across the region.

This project was conducted under the mentorship of Metro Vancouver staff. The opinions and
recommendations in this report and any errors are those of the author and do not necessarily reflect the
views of Metro Vancouver or the University of British Columbia.

                                                                                           Page 1 of 34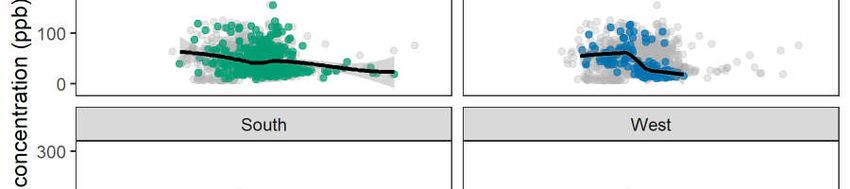
Reassessment of the Greater Vancouver Water District Secondary Reassessment Strategy

Contents
Disclaimer...................................................................................................................................................... 1
List of Tables ................................................................................................................................................. 3
List of Figures ................................................................................................................................................ 3
List of Acronyms ............................................................................................................................................ 4
1.     Executive Summary ............................................................................................................................... 5
2.     Introduction .......................................................................................................................................... 7
     2.1       The Greater Vancouver Water District ......................................................................................... 7
       2.1.1          Water Treatment .................................................................................................................. 7
       2.1.2          Reservoirs .............................................................................................................................. 7
       2.1.3          Secondary Disinfection Stations ........................................................................................... 8
     2.2       Data Collection .............................................................................................................................. 9
3.     Results ................................................................................................................................................. 10
     3.1       Interpretation of water quality results ....................................................................................... 10
       3.1.1          Residual chlorine ................................................................................................................. 10
       3.1.2          E.coli and total coliforms .................................................................................................... 13
       3.1.3          Heterotrophic Plate Count .................................................................................................. 14
       3.1.4          Disinfection By-Products ..................................................................................................... 16
     3.2       Microbiological results vs residual chlorine................................................................................ 18
       3.2.1          E.coli .................................................................................................................................... 18
       3.2.2          Total coliforms .................................................................................................................... 20
       3.2.3          Heterotrophic plate count .................................................................................................. 22
     3.3       Potential impact of increased residuals on corrosion control .................................................... 23
     3.4       Potential impacts on DBP formation .......................................................................................... 24
       3.4.1          pH ........................................................................................................................................ 25
       3.4.2          Residual chlorine ................................................................................................................. 27
     3.5       Temporal trends – seasonality and climate change ................................................................... 29
     3.6       Chlorine residual in filtered versus unfiltered water .................................................................. 31
4.     Summary and Recommendations ....................................................................................................... 32
References .................................................................................................................................................. 34

                                                                                                                                                Page 2 of 34
Reassessment of the Greater Vancouver Water District Secondary Reassessment Strategy
List of Tables
Table 1: Summary information of secondary disinfection stations .............................................................. 8
Table 2: Frequency of water quality testing ................................................................................................. 9
Table 3: Guidelines for Canadian Drinking Water Quality ............................................................................ 9
Table 4: Average HPC (CFU/mL) of all reservoirs and mains ...................................................................... 15
List of Figures
Figure 1: Average residual chlorine in reservoirs for 3 time periods from 1994-2019............................... 10
Figure 2: Average chlorine residual of all sampled transmission mains, 1994-2019 ................................. 11
Figure 3: Average chlorine residual of transmission mains, 2010-2019 ..................................................... 12
Figure 4: Annual incidences of non-compliance to BC Drinking Water Protection Regulation Schedule A in
reservoirs and mains ................................................................................................................................... 14
Figure 5: Average HAA concentration per local government distribution system, 2010-2019 .................. 17
Figure 6: Incidences of over-limit HAAs as a percentage of total samples per municipality...................... 18
Figure 7: E.coli results vs. residual chlorine in reservoirs ........................................................................... 19
Figure 8: E.coli results vs. residual chlorine in water mains ....................................................................... 19
Figure 9: Total coliforms vs. residual chlorine in reservoirs ....................................................................... 21
Figure 10: Total coliforms vs. residual chlorine in water mains. ................................................................ 21
Figure 11: Comparison of HPC and residual chlorine in reservoirs ............................................................ 22
Figure 12: Comparison of HPC and chlorine residual in water mains ........................................................ 23
Figure 13: pH versus chlorine residual in reservoirs and mains ................................................................. 24
Figure 14: Comparison of DBP concentrations and pH in municipal samples ............................................ 25
Figure 15: Breakdown of THM concentration vs pH data by systems operations area ............................. 26
Figure 16: Breakdown of HAA concentration vs pH data by systems operations area .............................. 26
Figure 17: THM concentration vs residual chlorine by systems operations area....................................... 28
Figure 18: HAA concentration vs residual chlorine by systems operations area ....................................... 28
Figure 19: Monthly variations of water quality parameters in historical samples ..................................... 30
Figure 20: Comparison of chlorine residual in reservoirs by water source ................................................ 31
Figure 21: Comparison of chlorine residual in municipalities by water source .......................................... 32
Page 3 of 34Reassessment of the Greater Vancouver Water District Secondary Reassessment Strategy
List of Acronyms
CFU Colony Forming Units
CWTP Coquitlam Water Treatment Plant
DBP Disinfection By-Product
E.coli Escherichia coli
EPA Environmental Protection Agency (USA)
GVWD Greater Vancouver Water District
HAA Haloacetic Acid
HPC Heterotrophic Plate Count
MAC Maximum Acceptable Concentration
mg/L Milligram per liter (0.001 g/L)
mL Milliliter (0.001 L)
pH Measure of acidity of water; pH 7 is neutral
ppb Parts per billion (Equivalent of microgram per liter, 0.001 mg/L)
SCFP Seymour Capilano Filtration Plant
THM Trihalomethane
UV Ultraviolet
WHO World Health Organization
Page 4 of 34Reassessment of the Greater Vancouver Water District Secondary Reassessment Strategy
1. Executive Summary
Residual Chlorine
Chlorine residual concentrations throughout the GVWD have increased from 1994 to 2019.
77% of reservoirs and 99% of water mains meet the target chlorine residual level of 0.5 mg/L. In
mains, lower chlorine residual concentration is associated with increasing distance from
chlorination facilities.
Low residual chlorine is of greatest concern in the Hellings Tank and Newton reservoirs, and in
local government distribution systems in Port Moody, Coquitlam, Belcarra, and New
Westminster.
Chlorine residual levels tend to be highest in mains surrounding the Cape Horn and Clayton
secondary disinfection stations.
Average residual chlorine in water from SCFP is marginally higher than that of water from CWTP.
Microbiological Results
There has been a sharp reduction in total coliforms and E.coli since 2000.
HPCs have been low in recent years—no sample has exceeded the US EPA standard of 500
CFU/mL since 2013. HPCs are most variable in Maple Ridge, Anmore and Belcarra, as well as in
the Ioco Main in Port Moody and the Pebble Hill Reservoir.
In general, microbial presence and residual chlorine concentration are negatively correlated.
Corrosion Control
pH and residual chlorine have both increased in recent years. The minimum pH of water leaving
the treatment plants is 7.5.
Increased pH boosting is planned to further boost pH. Theoretically, higher pH could suppress
the effectiveness of chlorine, leading to a need for increased dosing.
Disinfection By-Products
THMs are generally low and do not pose a risk in GVWD.
Average HAA concentrations were found to increase with distance from chlorination facilities.
The North Shore is an exception, with high average HAA despite its proximity to SCFP.
Instances of HAAs exceeding the MAC tend to occur in areas that undergo multiple instances of
chlorination. North Shore, Richmond, Surrey and Delta have the highest instances of over-limit
HAA concentrations.
DBPs in GVWD do not correlate strongly with pH. There is a slight positive correlation between
residual chlorine level and DBP formation.
Temporal Trends
Higher water temperatures from July to September are associated with lower residual chlorine
and higher potential for microbial regrowth.
With climate change projected to raise temperatures and increase seasonal fluctuations, more
seasonal adjustments to the secondary disinfection strategy may be required.
Page 5 of 34Reassessment of the Greater Vancouver Water District Secondary Reassessment Strategy
Recommendations for Secondary Disinfection Stations
Chlorine residuals are sufficient at:
o Cape Horn;
o Clayton;
o Kersland.
Increased chlorine dosing is recommended at:
o Central Park;
o Newton;
o Pitt River.
Increased operations from July to September are proposed in order to offset potential changes
in seasonal fluctuations caused by climate change.
Page 6 of 34Reassessment of the Greater Vancouver Water District Secondary Reassessment Strategy
2. Introduction
2.1 The Greater Vancouver Water District
The Greater Vancouver Water District (GVWD) is a subset of Metro Vancouver sharing a common water
treatment and distribution system. Metro Vancouver is responsible for the provision of clean, safe
drinking water to 21 of its 23 local authorities: 19 municipalities, one electoral area, and one Treaty First
Nation. Only the municipalities of Bowen Island and White Rock derive their drinking water from sources
other than the GVWD. Source water for the GVWD comes from three protected watersheds north of the
Lower Mainland: Seymour, Capilano, and Coquitlam. Prior to distribution, disinfection takes place at one
of two water treatment plants, located at the mouth of the Seymour and Coquitlam watersheds. From
there, treated water is sent through over 500km of transmission mains, 15 pumping stations, and 22 in-
system reservoirs operated by Metro Vancouver and eventually dispensed into local government water
distribution systems.
2.1.1 Water Treatment
The Seymour Capilano Filtration Plant (SCFP) began operations in December 2009. It is a chemically
assisted direct filtration plant with ultraviolet (UV) light and chlorine disinfection and pH adjustment via
lime and CO2. SCFP processes source water from the Seymour and Capilano Watersheds.
Raw source water is treated with polyaluminum chloride (PACl) and polymers to help aggregate
particles, forming visible floc that is then removed by filtration through anthracite and sand. Filtered
water is disinfected by UV light exposure and the addition of sodium hypochlorite (chlorine). UV
treatment is used because is more effective than chlorine at deactivating parasite cysts and oocysts,
such as those of Cryptosporidium and Giardia.
After disinfection, lime (calcium hydroxide) is added to raise the pH before the water enters two
clearwells, where the added chlorine and lime can blend with the water and continue the disinfection
process until it is distributed. During this retention time, carbon dioxide (CO2) in solution is used to
adjust the water’s pH to a minimum of 7.5 before leaving the facility. This is to meet aesthetic limits for
pH and minimize corrosion of metal components of the drinking water system. Once the water’s
chemical parameters have stabilized, it is ready for transmission throughout Metro Vancouver.
The Coquitlam Water Treatment Plant (CWTP) uses ozonation, UV treatment, chlorination, and soda ash
to treat water from the Coquitlam Watershed. Coquitlam water is not filtered prior to chemical
treatment because of its already low turbidity and particulate content. Ozonation helps remove micro-
organisms from the water, reduces disinfection by-products and improves water clarity, which enhances
the effectivity of the subsequent UV treatment. Soda ash is used in place of lime to raise pH, and finally
the pH is trimmed down using CO2.
2.1.2 Reservoirs
Treated drinking water is stored in 22 reservoirs throughout Metro Vancouver. Water quality is
optimized by the use of secondary disinfection as well as a reservoir cycling strategy that adjusts filling
Page 7 of 34Reassessment of the Greater Vancouver Water District Secondary Reassessment Strategy
levels according to chlorine residual and bacteriology results. Monitoring of water quality in these
reservoirs occurs on a weekly basis at minimum.
2.1.3 Secondary Disinfection Stations
Eight secondary disinfection (or re-chlorination) stations are operated by Metro Vancouver throughout
the GVWD. These stations are designed to increase the chlorine residual of outflowing water to meet a
target concentration based on a number of factors including source water turbidity, the amount of
bacterial regrowth detected in local government distribution system samples, and the chlorine demand
in the water.
Since the commission of SCFP in 2009, the rate of chlorine decay in filtered water has dropped
significantly, reducing the need for secondary disinfection stations. The target outflowing chlorine dose
for secondary disinfection stations that receive SCFP water is 0.8 mg/L; this threshold is frequently met
by incoming water, such that additional chlorine dosing is not required at these facilities.
Assessment of the operation of the eight stations is underway to determine if changes should be made
to the current secondary disinfection scheme.
Table 1 shows the locations of the secondary disinfection stations, the mains they service, and the
source treatment plant from which their water is derived.
Table 1: Summary information of secondary disinfection stations
Facility Location Main(s) serviced Water Supply
Cape Horn Mariner Way, Coquitlam Main No.2 CWTP
at Cape Horn Pump Stations Coquitlam Main No.3
Central Park Patterson Ave., South Burnaby Main No.1 Primarily SCFP
at Central Park Reservoir South Burnaby Main No.2
Chilco Capilano Main No. 4 at Chilco St., Capilano Main No. 4 SCFP
near Alberni St.
Clayton 72 Ave. & 191 St., Whalley Clayton Main CWTP
at Clayton Tank Reservoir Jericho Clayton Main
Kersland Kersland Dr., Cambie Richmond Main SCFP
at Kersland Reservoir
Newton 63 Ave. & 128 St., South Surrey Supply Main Primarily SCFP
at Newton Reservoir
Pitt River Lougheed Hwy, east end of Pitt Haney Main No.2 CWTP
River Bridge
Haney Main No.3
Vancouver Heights N. Boundary Rd. & Eton St. Boundary Road Main No. 5 SCFP
Page 8 of 34Reassessment of the Greater Vancouver Water District Secondary Reassessment Strategy
2.2 Data Collection
From January 1994 to December 2019, over 120,000 samples from GVWD transmission mains and
44,000 reservoir water samples have been collected for water quality testing. Samples collected from
various locations in local government distribution systems during this time total approximately 350,000.
Table 2 is a section from the 2019 Annual Report showing the most relevant parameters for water
quality monitoring and the frequency at which they are measured. Compliance standards for these
parameters are summarized in Table 3.
Table 2: Frequency of water quality testing
Water Type Parameter Frequency
Total coliform and E. coli Weekly per site
Heterotrophic plate count Weekly per site
GVWD Water Mains
Free chlorine Weekly per site
Trihalomethanes, haloacetic acids, pH Quarterly at selected sites
Total coliform and E. coli Weekly per site
GVWD Reservoirs Heterotrophic plate count Weekly per site
Free chlorine Weekly per site
Total coliform and E. coli Weekly per site
Local Government Heterotrophic plate count Weekly per site
Distribution System Free chlorine Weekly per site
Trihalomethanes, haloacetic acids, pH Quarterly at selected sites
Table 3: Guidelines for Canadian Drinking Water Quality
Parameter Maximum acceptable Notes
concentration
Free chlorine N/A Typical values in Canadian drinking
water range from 0.04 – 2.0 mg/L.
E.coli None detectable per 100mL No E.coli is acceptable for treated
drinking water.
Total coliforms None detectable per 100mL Used as an indicator of water quality
(recommended) within the distribution system.
HPC 500 CFU/mL (recommended) Used as an indicator of water quality
within the distribution system.
Haloacetic acids 0.08 mg/L By-product of drinking water
disinfection with chlorine.
Trihalomethanes 0.100 mg/L By-product of drinking water
disinfection with chlorine.
Page 9 of 34Reassessment of the Greater Vancouver Water District Secondary Reassessment Strategy
3. Results
3.1 Interpretation of water quality results
3.1.1 Residual chlorine
Figure 1 shows the average chlorine residual in GVWD reservoirs since 1994. Averages are calculated by
time periods corresponding with significant changes in the GVWD infrastructure: 1997 was when
secondary disinfection was implemented, while late 2009 (rounded to 2010) marked the commission of
SCFP. A target concentration of 0.5 mg/L is set for reservoirs.
In general, chlorine residual has been increasing over the years. From 2010 to 2019, the average across
all reservoirs was 0.6 mg/L, with a standard deviation of 0.1 mg/L. The reservoir with the lowest average
chlorine residual is Hellings Tank at 0.46 mg/L. A full table summary of Figure 1 can be found in the
Appendix.
Chlorine residual data for the Maple Ridge Reservoir are not available from 2006 onward in the dataset
used. Due to sampling conditions, data collected from the reservoir were not a representative sample of
the reservoir. The 2019 Annual Report states an average chlorine residual concentration of 0.52 mg/L
from 2016 to 2019 for the Maple Ridge Reservoir.
Figure 1: Average residual chlorine in reservoirs for 3 time periods from 1994-2019.
Page 10 of 34Reassessment of the Greater Vancouver Water District Secondary Reassessment Strategy
Data from 76 transmission mains are included in the analysis. Figure 2 summarizes the average residual
throughout all these mains, divided into subsections relating to infrastructure changes. A table of
averages for each main is provided in the Appendix.
Figure 2: Average chlorine residual of all sampled transmission mains, 1994-2019
Chlorine residual in recent years is substantially higher than in 1994, though concentrations actually
peaked in the early 2000s before stabilizing at slightly lower levels. From 2010 to 2019, chlorine residual
across all mains averaged 0.76 mg/L. Figure 3 details the average residual per transmission main during
this time period. Mains connecting to secondary disinfection stations are highlighted in orange.
Mains in Surrey and Coquitlam (especially near the Cape Horn re-chlorination station) tend to contain
the greatest chlorine residual. Conversely, mains with the lowest average residual are focused around
areas such as Maple Ridge, New Westminster, and the boundary between Burnaby and Coquitlam,
suggesting that the probability of chlorine decay generally increases with distance from chlorination
facilities. Of the mains directly serviced by secondary disinfection stations, the majority sampled
consistently returned chlorine residual levels near or above the average of 0.76 mg/L, with Boundary
Road Main No. 5 (serviced by the Vancouver Heights station) containing the lowest overall residual
chlorine. From 2018 to 2019, this main’s residual levels dropped to approx. 0.66-0.70 mg/L.
In local government distribution systems, chlorine residuals ranged from 0.41 mg/L to 0.76 mg/L from
2015 to 2019, averaging approx. 0.56 mg/L. Municipalities with above-average chlorine were (in order of
highest to lowest) Richmond, Burnaby, Maple Ridge, Anmore, and Vancouver, while municipalities with
Page 11 of 34Reassessment of the Greater Vancouver Water District Secondary Reassessment Strategy
Figure 3: Average chlorine residual of transmission mains, 2010-2019
Page 12 of 34Reassessment of the Greater Vancouver Water District Secondary Reassessment Strategy
the lowest residuals were Port Moody, Coquitlam, Belcarra, and New Westminster. Independent water
treatment conducted by the local governments may account for differences in residual chlorine levels
between mains and municipal networks. Variations in chlorine residual were greatest in the City of
Langley and Anmore, while Vancouver and Richmond experienced the most stable levels. A detailed
breakdown of residual chlorine concentrations in local government systems is provided in the Appendix.
There is no maximum or minimum acceptable concentration for chlorine residual. The Guidelines for
Canadian Drinking Water Quality cite a range of 0.04-2.0 mg/L as normal for Canadian drinking waters
(Health Canada, 2019). Typically, higher chlorine concentrations are encouraged in order to increase
disinfection potential and thus reduce the risk of microbial contamination. However, factors such as the
cost of resources and disinfection by-product formation (discussed below) must be considered.
3.1.2 E.coli and total coliforms
Microbiological quality is one of the top priorities in drinking water treatment. Waterborne pathogens,
including Escherichia coli (E.coli), Cryptosporidium and Giardia, pose severe risks to human health when
ingested unless proper disinfection can render them inactive.
Coliform bacteria occur naturally in water, soil and vegetation; most do not cause disease in humans.
However, some species, such as E.coli, proliferate in human and animal feces. The presence of E.coli in
drinking water is a serious health concern, as it may indicate fecal contamination and the presence of
other enteric pathogens that can cause gastrointestinal illnesses. Therefore, E.coli monitoring is a vital
component of any water quality maintenance regime (Health Canada, 2020).
Total coliforms measure all the coliform bacteria species present in a water sample. While not directly
correlated with human health risk, they are used as indicators of how well the drinking water treatment
and distribution systems are operating. In water leaving a treatment plant, high total coliforms suggest
inadequate treatment; within a storage and distribution system, they can indicate bacterial regrowth or
contamination from outside sources. Sampling locations repeatedly testing positive for total coliforms
should be investigated.
Standards for total coliforms and E.coli are provided in Schedule A of the BC Drinking Water Protection
Regulation:
1: No sample should be positive for E. coli.
2: When more than 1 sample is collected in a 30-day period, not more than 10% of the samples should
be positive for total coliform bacteria.
3: No sample should contain more than 10 total coliform bacteria per 100 mL.
Figure 4 displays the annual number of reservoir and main samples failing to comply with the above
criteria. These incidences have decreased substantially since the 1990s due to improvements in the
drinking water treatment infrastructure and strategy. A similar decrease in microbiological presence can
be observed in local government distribution systems.
Page 13 of 34Reassessment of the Greater Vancouver Water District Secondary Reassessment Strategy
Figure 4: Annual incidences of non-compliance to BC Drinking Water Protection Regulation Schedule A in reservoirs and
mains
3.1.3 Heterotrophic Plate Count
Heterotrophs are organisms that consume organic carbon for energy. In drinking water systems, these
typically consist of bacteria, with some molds and yeasts also present.
Page 14 of 34Reassessment of the Greater Vancouver Water District Secondary Reassessment Strategy
Heterotrophic plate counts (HPCs) indicate the levels of heterotrophs in a drinking water sample, and
can be measured from a number of internationally standardized methods that utilize colony formation
on culture media. HPC tests do not distinguish specific heterotroph species present in the water.
HPC results do not directly reflect water safety or human health hazards, but can be used to monitor
general microbial water quality throughout the transmission and distribution system. Each drinking
water system has a baseline range of HPC levels depending on local characteristics; unexpected
deviations from this range could indicate a change in the treatment process or problems in the
distribution system, such as contamination. Low, consistent HPC levels usually mean a drinking water
system is functioning properly (Health Canada, 2012).
In the transmission/distribution system, HPC fluctuations can be signs of stagnation, tuberculation, low
residual chlorine, or high availability of nutrients for microbial regrowth. The Guidelines for Canadian
Drinking Water Quality do not provide a maximum acceptable level for HPC; however, 500 CFU/mL is
the typical acceptable upper limit. This value was set in 1989 by the US EPA as a non-health-related
secondary standard, owing to concerns over interference with coliform tests (Bartram, Cotruvo, Exner,
Fricker, & Glasmacher, 2003).
HPC within the GVWD distribution system has decreased significantly. Table 4 shows the average HPC of
all samples during each phase of infrastructure changes for reservoirs and water mains. Generally, only a
small proportion of samples test high, but both the maximum value of high samples and the frequency
with which they occur have declined significantly since 1994.
Table 4: Average HPC (CFU/mL) of all reservoirs and mains
Years 1994-1996 1997-2009 2010-2019
Reservoirs 5018 571 6
Mains 219 76 9
Between 2010 and 2019, 8 of the 22 reservoirs yielded samples with HPC exceeding the
recommendation of 500 CFU/mL. Of those, only the Pebble Hill Reservoir had over 1% of its samples
testing high. However, it is important to note that no data are available for the Maple Ridge Reservoir
during this time period. Based on results from 1994-2009, it is possible that this reservoir may also be at
risk for high HPC. A table of detailed HPC results is available in the Appendix.
HPCs in all sampled transmission mains have not exceeded 500 CFU/mL since 2013. As variations from
baseline levels are more important than absolute HPC values, standard deviation is used in this analysis
to evaluate HPC quality. From 2018 to 2019, the greatest variation occurred at the Ioco Main in Port
Moody, with a standard deviation of over 640 CFU/mL; the next highest deviations were approx. 100
CFU/mL. Since Ioco samples also consistently returned some of the lowest chlorine residual levels, it
may be worth reassessing the integrity of this main.
HPCs in samples from local government distribution systems have experienced great temporal
variability. Of the municipalities sampled, Anmore and Belcarra showed consistently high fluctuations in
HPC, while Maple Ridge experienced the greatest changes overall, suggesting significant improvements
Page 15 of 34Reassessment of the Greater Vancouver Water District Secondary Reassessment Strategy
to its infrastructure. Port Coquitlam, Port Moody, Surrey, and the University Endowment Lands exhibit
the most stable HPCs overall. While Vancouver also appears to have low variations in HPC, data is
available only from 2015 to 2019, so a definitive conclusion about long-term stability cannot be made.
3.1.4 Disinfection By-Products
As treated drinking water travels through the distribution system, changes in water quality can occur as
chlorine reacts with the dissolved organic matter naturally present in the water. The resulting
compounds are known collectively as disinfection by-products (DBPs). DBPs typically refer to any organic
or inorganic compounds that form inadvertently during water disinfection, but chlorinated DBPs are of
particular concern due to their potential to cause various health effects. Some DBPs are classified as
possible carcinogens.
There are two main categories of chlorinated DBPs: haloacetic acids (HAAs) and trihalomethanes
(THMs). The GVWD analyses for the following major compounds from each group:
Haloacetic acids (HAAs): monobromoacetic acid, monochloroacetic acid, dibromoacetic acid,
dichloroacetic acid, and trichloroacetic acid;
Trihalomethanes (THMs): bromodichloromethane, chlorodibromomethane, chloroform, and
bromoform.
Water samples are analyzed on a quarterly basis. The Guidelines for Canadian Drinking Water Quality
state a maximum acceptable concentration (MAC) of 0.100 mg/L for THMs and 0.08 mg/L for HAAs, both
as locational yearly running averages (Health Canada, 2019).
The THM standard has been met consistently in all sampled municipalities. Of the few incidences where
THM levels exceeded the MAC, almost all occurred in the North Shore region, where SCFP is located—
chlorination from source water disinfection could be contributing to increased THM formation. High
samples averaged approx. 0.12 mg/L, 0.02 mg/L above the MAC.
Page 16 of 34Reassessment of the Greater Vancouver Water District Secondary Reassessment Strategy
Figure 5: Average HAA concentration per local government distribution system, 2010-2019
In general, HAA levels have been on the decline in recent years. HAA formation potential increases with
water age; this is roughly consistent with the results in Figure 5, which show that between 2010-2019,
average HAA concentrations tended to occur in municipalities requiring longer transport distances and
thus longer residence times within the distribution system. Notable exceptions are Anmore and the
North Shore—these are regions with relatively close proximity to chlorination sources that nonetheless
experience higher HAA levels.
Figure 6 displays incidences of sample sites returning an annual average HAA concentration above the
MAC as a percentage of the total sites sampled in each municipality. Due to temporal gaps in data for
some sample sites, moving averages could not be calculated reliably. Entries that contain no columns,
such as Anmore and Belcarra, represent municipalities included in the analysis that had no recorded
incidences of high HAA—numbers for Figure 6 are presented in the Appendix. Over-limit HAAs occurred
largely in the North Shore, Richmond and Delta, areas of significant chlorination (the North Shore via
primary water treatment, Richmond and Delta through two instances of en route re-chlorination).
Page 17 of 34Reassessment of the Greater Vancouver Water District Secondary Reassessment Strategy
Figure 6: Incidences of over-limit HAAs as a percentage of total samples per municipality
3.2 Microbiological results vs residual chlorine
3.2.1 E.coli
The presence of E.coli in treated drinking water is a serious threat to human health. In most drinking
water administrations, a single sample testing positive for E.coli triggers a number of preventative and
diagnostic measures to protect residents from potential gastrointestinal illness and other health effects.
Disinfection and monitoring of E.coli is one of the key aspects of any drinking water treatment regime.
Figures 7 and 8 compare chlorine concentration to the frequency of positive E.coli samples in reservoirs
and mains. Chlorine residual values of historical samples are divided into discrete increments, and for
each increment the occurrences of positive samples are calculated as a percentage of the total number
of samples. Overall, the higher the chlorine residual, the less likely it will be that samples test positive
for E.coli. Above a chlorine residual level of 1.0 mg/L in reservoirs and 1.4 mg/L in mains, no positive
samples were recorded.
In recent years, proportionately fewer samples are positive for E.coli, even at low residual levels. This
would suggest that the presence of E.coli depends on factors other than chlorine residual. Most likely,
improvements in analysis methods have reduced laboratory and sampling contamination and thus
decreased the incidences of falsely positive E.coli samples.
Page 18 of 34Reassessment of the Greater Vancouver Water District Secondary Reassessment Strategy
Figure 7: E.coli results vs. residual chlorine in reservoirs
Figure 8: E.coli results vs. residual chlorine in water mains
Page 19 of 34Reassessment of the Greater Vancouver Water District Secondary Reassessment Strategy
3.2.2 Total coliforms
Total coliforms are used as an indicator of drinking water quality throughout the distribution system.
The presence of coliforms in suggests bacterial regrowth within the system or possible contamination of
the water from outside sources, such as intrusion of untreated water. Standards for total coliforms are
dictated in Schedule A of the BC Drinking Water Protection Regulation:
1: No sample should be positive for E. coli.
2: When more than 1 sample is collected in a 30-day period, not more than 10% of the samples should
be positive for total coliform bacteria.
3: No sample should contain more than 10 total coliform bacteria per 100 mL.
Historical data of total coliform and chlorine residual indicate that high coliform counts generally
coincided with low chlorine concentrations. Overall, the two parameters are negatively correlated: as
residual chlorine levels increase, total coliform counts decrease.
Figure 9 and Figure 10 show the historical changes in total coliforms and chlorine residual within
reservoirs and mains. For each increment of chlorine residual, the frequency of samples positive for
coliforms (1 CFU/mL or greater) is tallied as a percentage of all samples in that chlorine range. In Figure
10, one outlier sample with 3.5 mg/L chlorine residual was omitted from the graph—the maximum
chlorine dosage allowed in the GVWD distribution system is 1.5 mg/L.
As with E.coli, instances of high coliforms (over 10 CFU/mL, per Schedule A of the BC Drinking Water
Protection Regulation) have decreased substantially over the years. Similar conclusions can be made
about total coliforms as E.coli: incidences of positive samples have generally been low in recent years
regardless of chlorine residual, suggesting that coliform presence is not directly correlated with chlorine
concentration. Sample contamination due to laboratory conditions is likely partially responsible for the
distribution in the figures below.
Page 20 of 34Reassessment of the Greater Vancouver Water District Secondary Reassessment Strategy
Figure 9: Total coliforms vs. residual chlorine in reservoirs
Figure 10: Total coliforms vs. residual chlorine in water mains.
Page 21 of 34Reassessment of the Greater Vancouver Water District Secondary Reassessment Strategy
3.2.3 Heterotrophic plate count
Heterotrophic plate count (HPC) measures the amount of heterotrophic organisms present in drinking
water. Together with total coliforms, it is used to gauge changes in water quality throughout a drinking
water treatment and distribution system. HPCs above site-specific baseline levels generally reflect
conditions conducive to microbiological growth and indicate an increased risk for the proliferation of
potentially disease-causing micro-organisms.
Figures 11 and 12 compare HPC against chlorine residual in reservoirs and in mains. In general, there
appears to be an inverse relationship between these parameters. The correlation is generally smooth
and continuous in reservoirs, but in water mains it is less well-defined. Unlike in reservoirs, water is
consistently in motion inside transmission mains, potentially leading to flow-related factors that result in
the large variation in HPC.
Data with chlorine residual above 2.0 mg/L were removed as outliers from both graphs. As chlorine
dosing in the GVWD does not exceed 1.5 mg/L, samples with chlorine residuals above this value should
not be considered representative of typical conditions within the distribution system.
Recent years have seen a significant reduction in HPC per unit of residual chlorine; few samples
exceeded 500 CFU/mL from 2018 to 2019. Given the correlation between HPC and chlorine residual, it is
likely that chlorine would be directly effective at reducing HPC.
Figure 11: Comparison of HPC and residual chlorine in reservoirs
Page 22 of 34Reassessment of the Greater Vancouver Water District Secondary Reassessment Strategy
Figure 12: Comparison of HPC and chlorine residual in water mains
3.3 Potential impact of increased residuals on corrosion control
Though the pH of typical drinking water does not pose any health concerns, an aesthetic standard of
7.0-10.5 is recommended by the Guidelines for Canadian Drinking Water Quality. Among other benefits,
pH control minimizes the corrosion of metal components of the GVWD treatment and distribution
system.
Corrosion control facilities at SCFP and CWTP use lime (calcium hydroxide) and soda ash (sodium
carbonate), respectively, to raise the pH and boost the alkalinity of the water. Once disinfected water
enters the clearwells, pH is further adjusted with the addition of CO2, which lowers it closer to neutral
(pH 7.0). Lime and CO2 treatment at SCFP has been active since 2010. CWTP’s CO2 system began
commission in 2019, but has not yet reached its full operational capacity.
The GVWD plans to increase the soda ash dose in order to achieve a higher alkalinity. The subsequent
rise in pH may affect free chlorine levels. In water, chlorine exists primarily in two forms: hypochlorous
acid (HOCl) and hypochlorite (ClO-). Hypochlorous acid, the more potent disinfectant of the two, is the
dominant form at low pH, with the two species existing in equal amounts at a pH of 7.5 (Bowman &
Mealy, 2007). Theoretically, increasing the pH would cause a decrease in the distribution of
hypochlorous acid, resulting in reduced disinfection potential. This effect can be counteracted by
increasing the overall free chlorine concentration, i.e. increasing chlorine dosage.
Historical pH and residual chlorine data in Figure 13 show that in reservoirs, both pH and residual
chlorine concentration have trended higher since 2010. In addition, the tighter clustering of data points
Page 23 of 34Reassessment of the Greater Vancouver Water District Secondary Reassessment Strategy
after 2010 than before indicates an improvement in the control of pH and chlorine residual during water
treatment and thus better stability of both parameters throughout the distribution system. Results are
inconclusive for transmission mains and municipalities due to a lack of sufficient data.
With increased soda ash dosage, a heavier reliance on the CO2 systems may be needed to adjust the pH
to levels that do not interfere with residual chlorine activity. Meeting the aesthetic limit for pH and
maintaining the disinfection potential of treated water are parameters that are inversely proportional,
and a balance must be found between the two.
Figure 13: pH versus chlorine residual in reservoirs and mains
3.4 Potential impacts on DBP formation
Disinfection by-product (DBP) formation is affected by a variety of factors. Variations in chlorine
concentration, reaction time, concentration and characteristics of dissolved organic matter (DBP
precursor compounds), water temperature, and pH lead to differences in DBP composition throughout
the distribution system. DBP formation tends to pervade throughout the drinking water treatment and
distribution system, since reactions continue as long as chlorine and reactive dissolved organic matter
are present in water.
Page 24 of 34Reassessment of the Greater Vancouver Water District Secondary Reassessment Strategy
3.4.1 pH
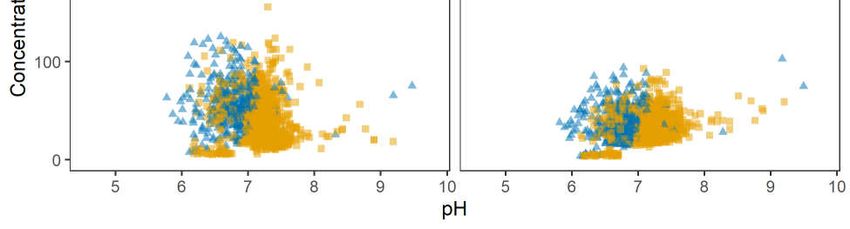
Figure 14 compares THM and HAA concentrations to pH. The majority of samples plot into two clusters:
a large group in the pH 6-8 range that spans a wide range of DBP concentrations, and a minute low-DBP
cluster at pH 6-6.8 range. The clusters are more differentiable in THMs than HAAs.
Both groups share other similarities: while pH has generally increased over the years, DBP concentration
shows no definitive trend toward higher or lower values. Concentration data for both DBP groups taper
off at approx. pH 8. At even higher pH, THM concentration was found to increase, while HAA behavior is
more ambiguous.
Figure 14: Comparison of DBP concentrations and pH in municipal samples
Page 25 of 34Reassessment of the Greater Vancouver Water District Secondary Reassessment Strategy
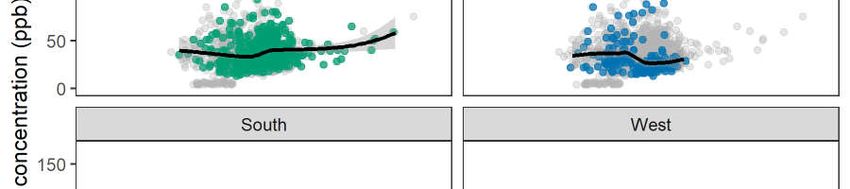
Figure 15: Breakdown of THM concentration vs pH data by systems operations area
Figure 16: Breakdown of HAA concentration vs pH data by systems operations area
Page 26 of 34Reassessment of the Greater Vancouver Water District Secondary Reassessment Strategy
Figures 15 and 16 break down DBP concentration and pH by systems operations area. The low-pH, low-
DBP samples at pH 6-7 are focused in the South District of the GVWD—specifically, Delta and Langley.
Data smoothing lines added to each subplot show shapes characteristic for each operations area. For
most areas, the difference in data shapes between THMs and HAAs are minor, and each operations area
contains samples that encompass the entire pH 6-8 range. This suggests that within the GVWD,
locational variations in play a more significant role than pH in DBP formation.
A review of scholarly literature indicates that THM formation tends to decrease with lower pH, while
HAA formation increases (Hansen, Willach, Antoniou, Mosbæk, Albrechtsen, & Andersen, 2012).
Historical data do not definitively reflect these trends, but this general relationship should be considered
with regards to planned future changes to the GVWD. An increase in pH could see a reduction in HAA
levels, which have historically been of higher concern than THMs.
3.4.2 Residual chlorine
Chlorine is a key component in DBP formation, reacting directly with precursor compounds (usually
dissolved organic matter) to form halogenated species. A comparison of DBPs and chlorine residual
levels is shown in Figures 17 and 18. Note that chlorine data for the North Shore was unavailable, so the
North District facet is greyed out.
As with pH and temperature, each systems operation area exhibits its own characteristic data shape and
approximate trend line, which are more similar between DBP groups than between operations areas.
Conditions throughout the distribution system appear not to discriminate significantly between THM
and HAA formation, despite the knowledge that retention time of the water in the system should
influence THM versus HAA formation and decay. Furthermore, the trend lines are relatively flat.
Typically, a positive correlation between residual chlorine and DBP concentration is expected. That no
such correlation appears to exist for GVWD samples could indicate the presence of other factors
affecting DBP formation, or a low availability of DBP precursor compounds. Given the largely
inconclusive results from temperature and pH analysis, it is possible that DBP precursors in the water
are easily exhausted, or that the retention time of water in the GVWD distribution system is not long
enough to prompt further reactions and produce higher DBP concentrations.
Page 27 of 34Reassessment of the Greater Vancouver Water District Secondary Reassessment Strategy
Figure 17: THM concentration vs residual chlorine by systems operations area
Figure 18: HAA concentration vs residual chlorine by systems operations area
Page 28 of 34Reassessment of the Greater Vancouver Water District Secondary Reassessment Strategy
3.5 Temporal trends – seasonality and climate change
Metro Vancouver’s drinking water is derived from lakes in three protected watersheds north of the
Lower Mainland. As surface water sources, the quality of these lakes is highly susceptible to
environmental changes. Seasonal fluctuations in rainfall may bring organic matter from the watersheds
into the lakes, resulting in variations in source water quality. Depending on the efficacy of primary
treatment, some of these changes may persist into the distribution system.
Figure 19 shows a by-month analysis of historical data. Note that, while some annual patterns do exist,
for most of these parameters there is more variation from year to year than between the months of a
year. Improvements to the disinfection and distribution scheme have reduced seasonal changes in
residual chlorine and microbiological results substantially in recent years.
On average, residual chlorine levels are lowest in the late summer to early autumn months, coinciding
with a rise in microbiological activity (HPC, total coliforms and E.coli). Water levels in the source lakes
are low during these months, leading to a greater concentration of organic matter in the water
(including micro-organisms). Increased temperatures in the summer are conducive to higher organismal
metabolism, contributing to the potential for microbiological re-growth within the distribution system.
Increased disinfection and monitoring may be necessary during these months to maintain a high water
quality standard.
Long-term temporal analysis shows an overall improvement in the quality of treated water; any
influences of climate change from 1994 to 2019 may be outweighed by advancements made to the
water treatment strategy. With respect to potential effects of climate change on secondary disinfection,
two possible trends in water quality are postulated:
1. A gradual rise in water temperature, and subsequent increased potential for microbial activity
and (re-)growth, is expected as overall ambient temperatures climb;
2. Seasonal fluctuations (temperature range, onset of precipitation, etc.) may become more
extreme as climate change progresses, which would exacerbate the monthly water quality
variations seen in Figure 19. The current water disinfection regime may need to be adjusted on a
seasonal basis to match these potential fluctuations.
Due to the quarterly nature of DBP sampling, the temporal resolution is not sufficiently high for a sound
seasonal analysis. A cursory analysis using the data available found no general trends from quarter to
quarter.
Page 29 of 34Reassessment of the Greater Vancouver Water District Secondary Reassessment Strategy
Figure 19: Monthly variations of water quality parameters in historical samples
Page 30 of 34Reassessment of the Greater Vancouver Water District Secondary Reassessment Strategy
3.6 Chlorine residual in filtered versus unfiltered water
In general, treated water from SCFP is distributed to the North and West Districts of the GVWD, while
CWTP water services the East and South Districts. There are some exceptions, such as Richmond and
Delta in the South District, which obtain water primarily from SCFP. Other areas may alternate sources
depending on water demand and distribution capacity.
Differences in residual chlorine levels between SCFP-sourced and CWTP-sourced infrastructure are
observable in reservoirs and in municipal distribution systems; however, mains exhibit approximately
the same average chlorine residual regardless of source. Treated water from CWTP typically experiences
a greater rate of chlorine decay than treated water from SCFP due to the lack of filtration. Figures 20
and 21 show that CWTP water has historically had lower average chlorine residuals. In recent years,
however, the difference has lessened considerably and may not be statistically significant.
CWTP-treated water has contained lower residual chlorine levels than SCFP-treated water even before
the commission of SCFP in late 2009. The decrease in chlorine decay rate caused by the implementation
of the new filtration system is not observable in historical data, which shows a consistent pattern
between the two sources. This is likely due to re-chlorination via the secondary disinfection stations,
which have operated since 1997.
Figure 20: Comparison of chlorine residual in reservoirs by water source
Page 31 of 34Reassessment of the Greater Vancouver Water District Secondary Reassessment Strategy
Figure 21: Comparison of chlorine residual in municipalities by water source
4. Summary and Recommendations
Based on the above analyses, water quality in Metro Vancouver has improved in all aspects since 1994.
Chlorine residuals rose substantially in GVWD and local government distribution systems when
secondary disinfection was implemented 1997, and continued to increase with the introduction of the
Seymour Capilano Filtration Plant in late 2009.
Overall, residual chlorine levels are above 0.5 mg/L throughout most of GVWD. Lower concentrations
tend to occur in the Maple Ridge/Port Moody area, as well as parts of New Westminster and at the
boundary between Burnaby and Coquitlam. These are regions that generally require longer transport
distances from chlorination facilities. The secondary disinfection stations associated with them are Pitt
River, Central Park and Vancouver Heights, respectively. In recent years, Coquitlam water mains near
the Cape Horn Reservoir have had some of the highest chlorine residuals in GVWD, and some cells of the
Clayton Tank Reservoir exhibit similarly high chlorine. These areas are serviced by the Cape Horn and
Clayton stations.
Treated water from SCFP contains slightly higher chlorine residuals than water from CWTP, likely
because the filtration process decreases the chlorine decay rate. The change in decay rate is not
observable in historical data likely due to re-chlorination from the secondary disinfection stations.
The increase of chlorine residuals throughout the GVWD is correlated with a drastic decrease in HPCs,
total coliforms, and E.coli. Areas with low chlorine residuals face the greatest concern for heterotroph
Page 32 of 34Reassessment of the Greater Vancouver Water District Secondary Reassessment Strategy
and coliform growth. In particular, infrastructure around Maple Ridge and Pebble Hill historically
experienced high HPCs the most frequently within the distribution system.
In general, DBP concentrations are compliant with the Guidelines for Canadian Drinking Water Quality.
Analysis found a weak relationship between residual chlorine concentration and overall DBP
concentration in the GVWD; however, historical evidence suggests that HAA formation is positively
correlated with residence time in the distribution system, with municipalities further from the primary
water treatment plants having higher average concentrations. In addition, HAAs are typically of higher
concern in the North Shore, Richmond, Delta, and Surrey, most of which are associated with multiple
instances of chlorine dosing.
Seasonal variations in temperature are correlated with variations in the potential for microbial
regrowth: historically, the warmer months (July to September) experience lower residual chlorine,
higher HPCs, and higher incidences of E.coli and total coliforms. This trend is expected to become more
dramatic as climate change raises overall temperatures and causes greater fluctuations in weather
patterns, so seasonal adjustments to the secondary disinfection strategy may become more necessary
to optimize water quality.
The following recommendations are made with regards to secondary disinfection stations:
Reduction of operations at:
o Clayton due to sufficient residual chlorine in the Barnston and Clayton Langley mains;
o Cape Horn due to sufficient residual chlorine in the Coquitlam and Sapperton mains;
o Kersland due to sufficient residual chlorine in Richmond, and to reduce DBP formation
potential.
Increased chlorine dosing at:
o Central Park to boost residual chlorine levels in New Westminster and the Hellings Tank
Reservoir;
o Newton due to low average residual chlorine in Surrey;
o Pitt River to bolster residual chlorine in water reaching the Maple Ridge Reservoir.
Overall, increased operations from July to September to offset possible seasonal changes in
chlorine residual.
Page 33 of 34Reassessment of the Greater Vancouver Water District Secondary Reassessment Strategy
References
Bartram, J., Cotruvo, J., Exner, M., Fricker, C., & Glasmacher, A. (2003). Heterotrophic Plate Counts and
Drinking-water Safety: The Significance of HPCs for Water Quality and Human Health. London:
IWA Publishing, Alliance House.
Bowman, G., & Mealy, R. (2007, December). The Fundamentals of Chlorine Chemistry and Disinfection.
Retrieved June 2020, from Wisconsin Department of Natural Resources:
https://dnr.wi.gov/regulations/labcert/documents/training/CL2Chemistry.pdf
Drinking Water Protection Regulation B.C. Reg. 200/2003. (2003, May 16). Drinking Water Protection
Act. Victoria, BC, Canada.
Hambly, D., Andrey, J., Mills, B., & Fletcher, C. (2013). Projected implications of climate change for road
safety in Greater Vancouver, Canada. Climatic Change, 116, 613-629.
Hansen, K., Willach, S., Antoniou, M., Mosbæk, H., Albrechtsen, H.-J., & Andersen, H. (2012, December).
Effect of pH on the formation of disinfection byproducts in swimming pool water – Is less THM
better? Water Research, 46(19), 6399-6409.
Health Canada. (2012, January). Guidance on the Use of Heterotrophic Plate Counts in Canadian Drinking
Water Supplies. Retrieved June 2020, from Government of Canada:
https://www.canada.ca/en/health-canada/services/publications/healthy-living/guidance-use-
heterotrophic-plate-counts-canadian-drinking-water-supplies.html
Health Canada. (2019, June). Guidelines for Canadian Drinking Water Quality - Summary Table.
Retrieved June 2020, from Government of Canada: https://www.canada.ca/en/health-
canada/services/environmental-workplace-health/reports-publications/water-
quality/guidelines-canadian-drinking-water-quality-summary-table.html
Health Canada. (2020, March 20). Guidelines for Canadian Drinking Water Quality: Guideline Technical
Document – Escherichia coli. Retrieved June 2020, from Government of Canada.
Hung, Y.-C., Waters, B., Yemireddy, V., & Huang, C.-H. (2017). pH effect on the formation of THM and
HAA disinfection byproducts and potential control strategies for food processing. Journal of
Integrative Agriculture, 16(12), 2914-2923.
Metro Vancouver. (2011). Drinking Water Management Plan. Vancouver: Metro Vancouver.
Metro Vancouver. (2019). Greater Vancouver Water District 2019 Water Quality Annual Report.
Vancouver: Metro Vancouver.
Metro Vancouver. (2020). Metro Vancouver Maps. Retrieved June 2020, from Metro Vancouver:
https://gis.metrovancouver.org/mvmaps/Water
World Health Organization. (2003). Chlorine in drinking-water - Background document for development
of WHO Guidelines for Drinking-water Quality. Retrieved June 2020, from World Health
Organization: https://www.who.int/water_sanitation_health/dwq/chlorine.pdf
Page 34 of 34You can also read